
Abstract
An algorithm is developed for footstep, vehicle, and rain detection using seismic sensors operating in a wireless sensor network. Each standalone seismic sensor is coupled with a wireless node, and alarm conditions were evaluated at the sensor rather than at the gateway. The algorithm utilizes slow and quick adaptive thresholds to eliminate static and dynamic noise to check for any disturbance. Duration calculation and filters were used to identify the correct alarm condition. The algorithm was performed on preliminary field tests, and detection performance was verified. Footstep alarm condition up to 8 meters and vehicle presence alarm condition up to 50 meters were observed. Presence of rain did not create any alarm condition. Detection based on kurtosis was also performed and shortcomings of kurtosis especially for vehicle detection were discussed, proposed algorithm has minimal load on the sensor board and its data processing unit; thus, it is energy efficient and suitable for wireless sensor alarm networks.
1. Introduction
Unauthorized human detection is an important and, mostly, an integral part of any security system. In building and perimeter of the building are two essential components of these security systems. In building or immediate vicinity of the structure can be monitored with cameras or security personnel, but perimeter of the building, especially wide open area security systems, requires sensors for intruder detection. Those sensors can be of many different forms ranging from passive and/or active infrared, thermal, seismic, ultrasound, and microphones to electromechanical film. Visually obscured sensors are definitely desired, which makes seismic or acoustic sensors preferable over other sensors. In this study, we used seismic sensors to detect vibrations in the ground to identify and classify human, rain, and vehicle in the prescribed range of the sensor.
Detection methods are usually based on either time or frequency domain. High frequency vibrations decay faster than low frequency vibrations so that the frequency components of a signal can be difficult to differentiate depending on measurement distance. In addition, vibration transmission characteristics are dependent on the soil type and weather conditions. Thus, frequency components of vehicle and footsteps can easily overlap due to vibration transmission characteristics of the soil. Nevertheless, two types of spectrum analyses methods exist for the intruder detection: narrow band and wide band spectrum analyses. Wide band spectrum analyses methods focus on single footstep and vehicle vibration. However, vehicle and footstep vibrations may have frequency components at the same frequency [1, 2]. On the other hand, narrow band spectrum analyses methods focus on several footsteps and vehicle components [3–5]. However, narrow and wide band spectrum analyses require FFT algorithms. Because of the limited memory and power, FFT use is not preferred in wireless sensor network devices. Although FFT may provide promising traffic detection, an alternate analog signal processing may be necessary due to demanding power requirements of FFT evaluation using digital circuits.
Another widely accepted detection method is “kurtosis”, which measures extreme deviations from mean signal [6]. However, detecting intruder movements with kurtosis does not produce clear successful results because vibration of certain types of noise can easily generate deviations similar to human steps. Another popular intruder detection method is based on “Copula” theory [7, 8]. Copula is in essence full measure of statistical dependence among random variables [7]. However, understanding and quantifying dependence is a challenging task in multivariate statistical modeling. Markov Models are also used in detection of footsteps [9]. Multimodal fusion of sensor data for detection was also proposed in a recent study [10].
The proposed system utilizes wireless communication among sensors that are standalone units and each unit has its own power supply (battery) to operate. All sensor boards are equipped with a wireless unit operating at 2.4 GHz to enable two-way (half duplex) communication between other sensors and the gateway. Geophone sensor SM-24 is used as the seismic sensor and electronic circuit that includes proper filtering and amplification is designed to process analog signal. Filtered and amplified sensor signal is digitized with 12-bit analog-to-digital-converter and processed for alarm conditions. Alarm conditions are communicated to a wireless sensor network (WSN) at 2.4 GHz. WSN board is designed using Texas Instruments tranceiver (CC2420) and microconroller family (MSP430F1611).
Detection also requires signal processing algorithm where human and vehicle classification can be done. Signal processing algorithm is utilized on the sensor board, and only alarm conditions are broadcasted to the network. The algorithm is designed to eliminate the effects of soil type, environment changes, and ambient noise. Design details of the algorithm are explained in Section 2. Typical scenarios for all types of threats are analyzed for performance evaluation in Section 3. Kurtosis based detection is discussed in Section 4.
2. Detection Algorithm
Detection algorithm works in real time and analyses durations of signals above two adaptive thresholds. The main reasoning behind defining adaptive thresholds is that there are time-dependent noise sources such as elevators, cranes, high power generators, and wind. These types of continuous noise sources generate noise at the same frequency of footsteps and vehicle movement. However, rain is not a continuous noise source, and, because of this, it is defined as a classification object.
Main parts of the algorithms are thresholds, duration calculator, duration filter, classification, and alarm decision as shown in Figure 1.
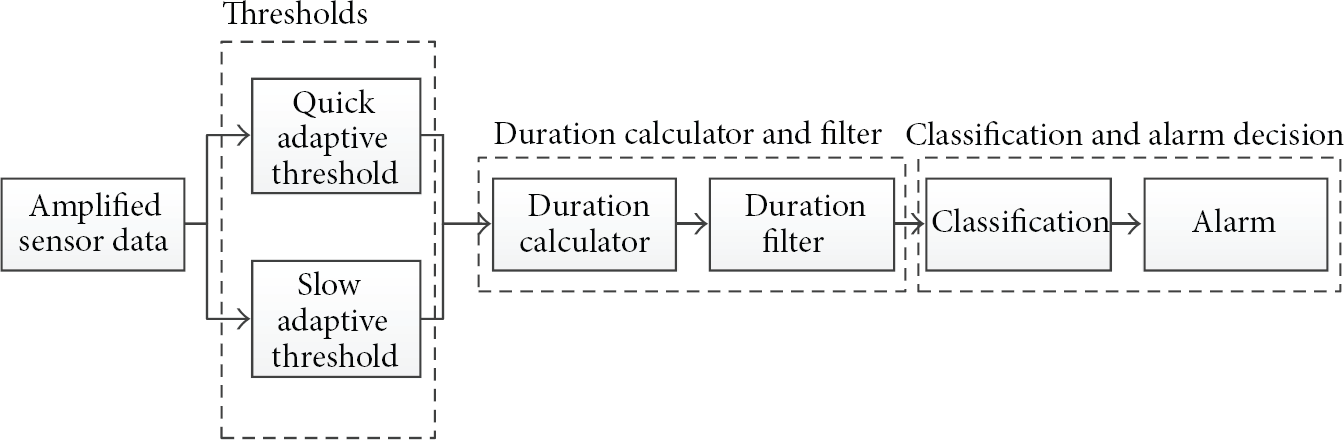
Blocks of signal processing algorithm.
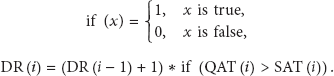
Two different thresholds are used to determine the durations of the signals: slow adaptive threshold (SAT) and quick adaptive threshold (QAT). SAT is following the noise level with a static and dynamic offset. SAT is designed to eliminate continuous noise effects from the classification by taking the average of the last incoming M number of sensor data and adding necessary offset values. To determine offset values, a power factor of average (PFA) is defined. PFA is simply a scalar, number and it empirically reflects maximum level of present noise to average noise. For instance, we used a PFA value of 3 in our algorithm to state that maximum noise level is most likely 3 times larger than the average, which is calculated for the last M data points (10K in our algorithm). Another scale factor called dynamic offset is also defined to account for soil and weather induced noise effects. Static offset is hardware dependent and is based on ambient noise level received by the sensor for the target detection range. SAT is calculated at every data point as follows:


Definitions of constants in the algorithm.


Definitions of signal durations.
3. Algorithm Performance
A preliminary test setup is formed to test the algorithm. In all tests, intruders are following a line where sensor is placed in the middle as illustrated in Figure 3. Data were collected with seismic sensors with 250 samples/second. Each seismic sensor is coupled with a wireless node operating in a WSN. Alarm “1” is defined as rain, “2” is footstep, and “5” is vehicle.

Test setup for footstep detection.
3.1. Noise Performance
Noise data were collected without moving or making any vibration on the ground to test false alarm rate of the algorithm. Raw data with SAT and QAT are shown in Figure 4, and duration calculators and filters are shown in Figure 5. An alarm was not triggered by the algorithm. Also, QAT did not pass SAT at any point of the original signal as expected.

Thresholds and original signal for noise only signal.

Duration, filtered duration, and alarm results for noise only data.
3.2. Footstep Detection
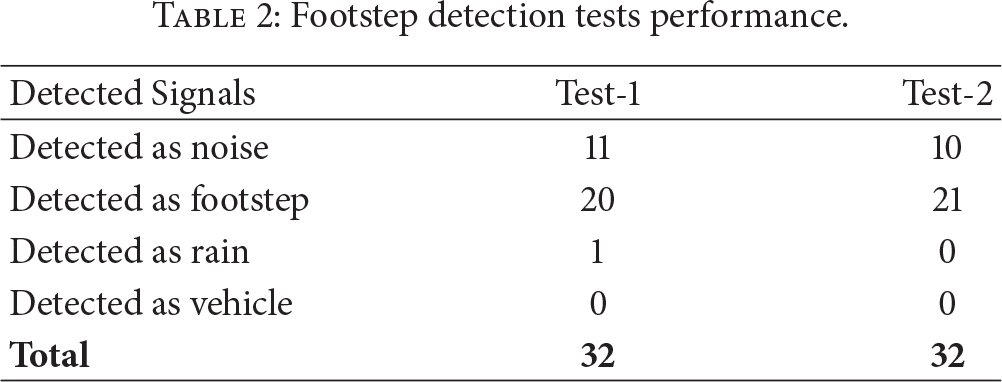
Footstep detection tests were performed in two different test locations. In Test-1, amplification gain of the seismic signal is chosen as 3000 and in Test-2 as 5000. In footstep tests, 30-meter path walked down and 40 footsteps were generated. Original signal for Test-1, its SAT and QAT values, and duration filters with alarm classification are shown in Figures 6, 7, and 8, respectively.

Original footstep signal.

QAT and SAT of original footstep signal.

Duration, filtered duration, and alarm result of footstep signal.
In both tests, 40 steps have been taken and 20 of them have been detected as footsteps. With this, footstep detection range was observed to be close to 8 meters. However, the range can be increased with higher amplification of seismic signals. 32 of 40 footsteps have been detected and 11 of them were classified as a noise. The algorithm produced one false alarm only. Detailed footstep detection test performances are listed in Table 2.
Footstep detection tests performance.
3.3. Vehicle Detection
Vehicle detection tests were executed in two different test locations each having different vehicle speeds. In Test-1, vehicle speed was 10 Km/hr, and, in Test-2, it was 30 Km/hr. The test setup is illustrated in Figure 9. Original signal for Test-1, corresponding SAT and QAT values, and duration filters with alarm classification are shown in Figures 10, 11, and 12, respectively. In both tests, vehicle presence was detected.

Vehicle test description.

Original vehicle vibration signal for 10 Km/hr speed (Test-1).
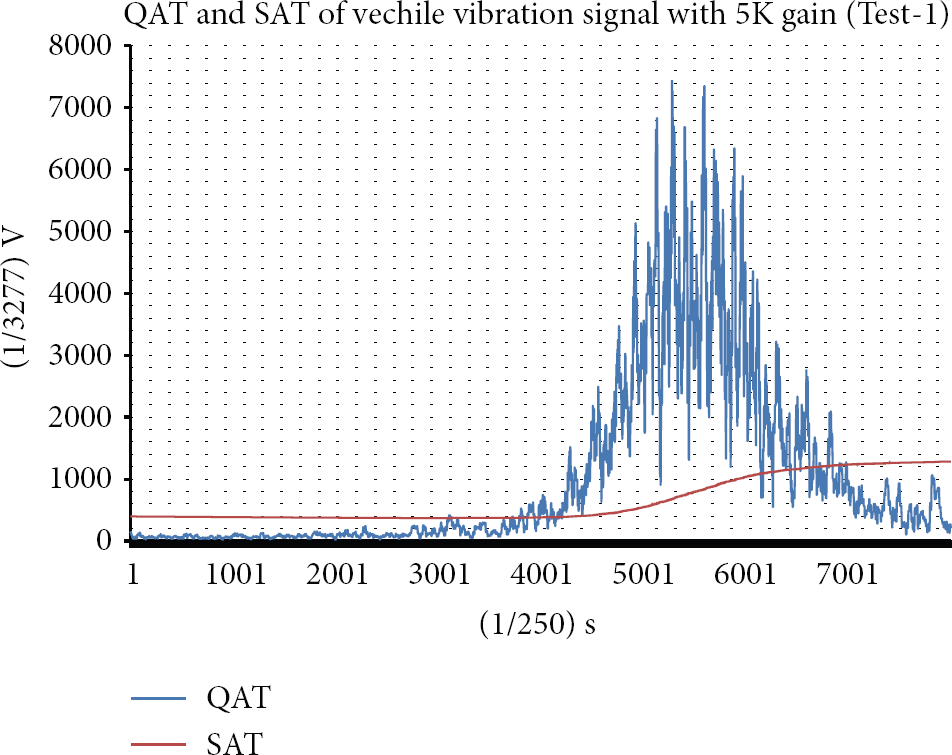
QAT and SAT of original vehicle signal (Test-1).

Duration, filtered duration, and alarm result of vehicle signal (Test-1).
3.4. Rain Detection
Rain detection tests were executed at two different test locations. Original signal for Test-1, corresponding SAT and QAT values, and duration filters with alarm classification are shown in Figures 13, 14, and 15, respectively. In both tests, unwanted signals were detected, but they did not produce any false alarms. Detailed rain detection test performances are listed in Table 3.
Rain test performance.

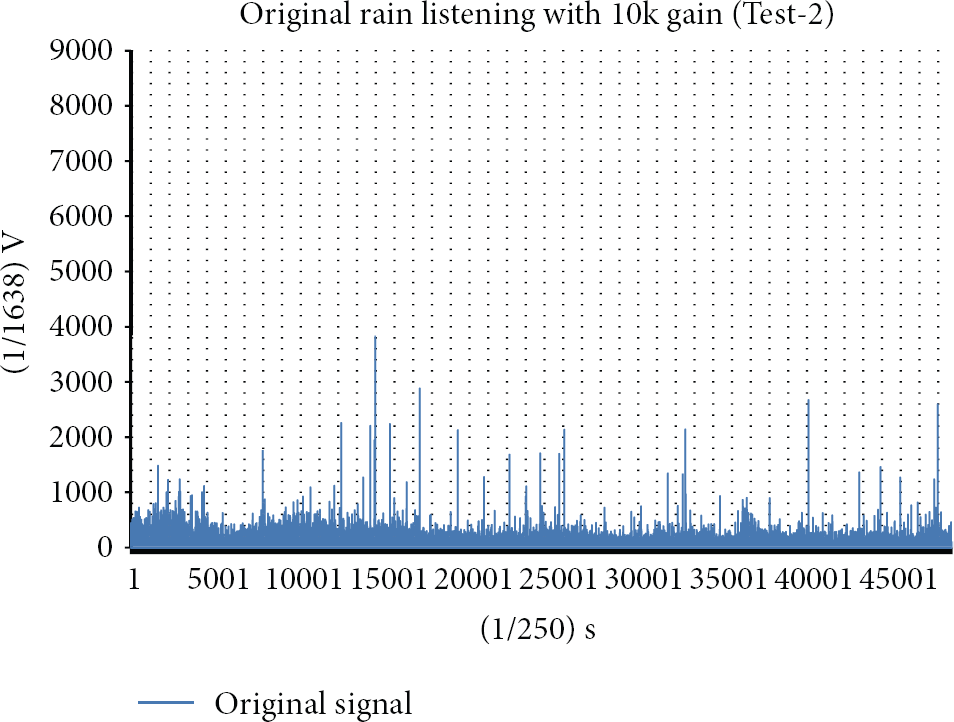
Original rain signal (Test-2).

QAT and SAT of rain signal (Test-2).

Duration, filtered duration, and alarm result of rain signal (Test-2).
4. Detection with Kurtosis
Kurtosis measures the “peakedness” of the real random variable. There are different versions of kurtosis, but we used the most common one for intruder detection:

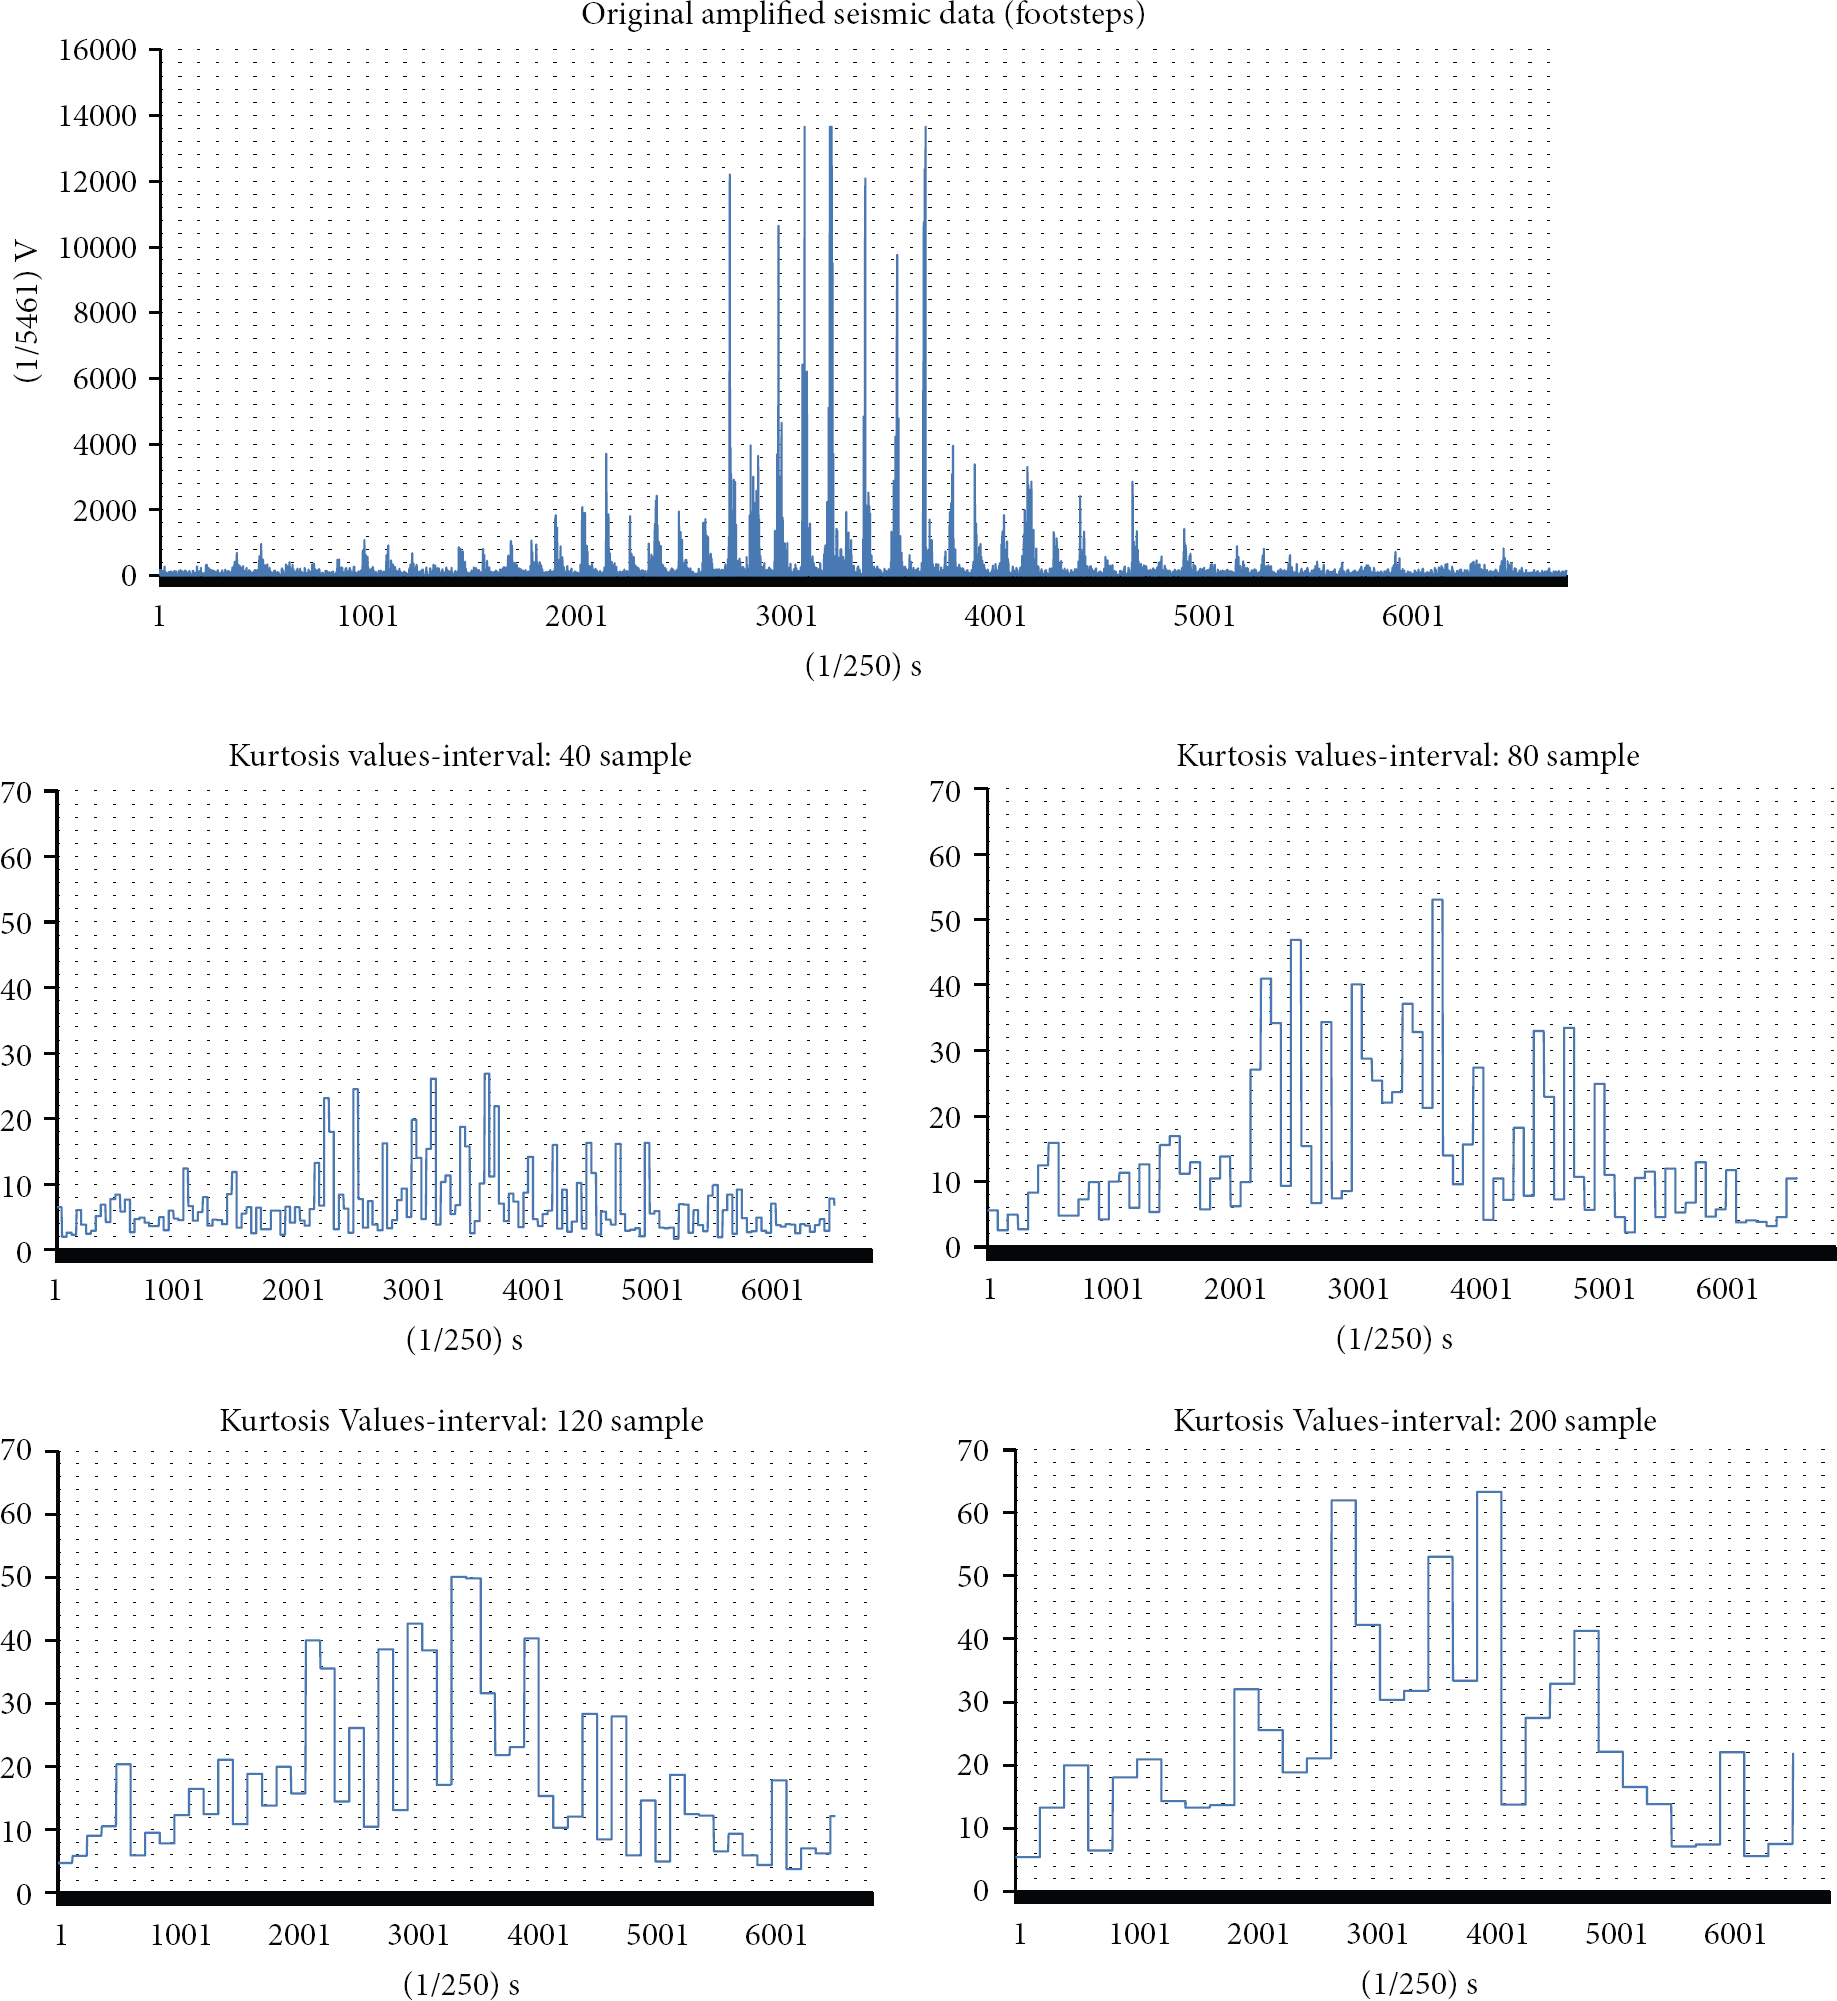
Kurtosis of footstep data with different interval sizes.
5. Conclusion
Real-time detection using seismic sensor data was developed to identify the presence of footsteps, vehicle, and rain. Algorithm is based on slow and adaptive quick thresholds with duration calculators and filters. Proposed algorithm was tested on several test scenarios, and its detection and classification success were assessed on several field tests. Footstep detection up to 8 meters and moving vehicle with two different speeds were detected successfully. Kurtosis based algorithm was also developed for comparison, and it was observed that kurtosis was not adequate in classification of all three response types. Although two different test scenarios were implemented, the algorithm needs further verification with extensive field tests.