
Abstract
The large generator faults are mostly from the stator insulation, which is aged by exposure to a combination of thermal, electrical, mechanical, and harsh environment stresses. Condition evaluation of stator insulation is an important measure of ensuring the safe operation and extending the remaining life of large generator. In this paper, a diagnosis method based on the partial discharge (PD) measurement was used for the condition evaluation of the stator insulation. The statistical parameters of partial discharge phase resolved distribution were proposed to assess the aging condition of stator insulation. A partial least square (PLS) approach was used to explore and extract relationships between the statistical parameters of partial discharge distribution with physical properties and performance such as electrical breakdown strength. Results of the PD testing and statistical analysis show that the statistical parameter Sk extent of partial discharge distribution changes much more remarkably with the aging time than do the other parameters. The statistical parameter Sk can be considered as a potential indicator of stator insulation aging. The PLS approach can effectively assess the stator insulation aging condition and can provide a predictive capability for the stator insulation diagnosis.
1. Introduction
Stator winding is a main component of high-voltage (HV) rotating machines (generators and large motors). Stator insulation failure of HV rotating machine can result in catastrophic damages to the equipment, loss or derating of power output, lengthy forced outages, and heavy costs to the utility. A large number of HV rotating machines failed due to stator winding problems, especially insulation deterioration. Electrical, mechanical, thermal, and environmental stresses remain major factors for the insulation degradation and accelerated aging [1]. These stresses impose, individually and in a collective manner, degradation of the stator winding insulation. It has been shown that the stator winding insulation is also one of the most vulnerable components used in an HV rotating machine. Surveys published in [2–4] show that about 30–40% of rotating machine failures are initiated from problems in the stator insulation. Further, a recent survey published in [5] shows that the percentage of stator related failures is about 60–70% for HV rotating machines. The reliability of rotating machines is almost defined by the condition of the stator winding insulation. Therefore, stator insulation condition assessment is a vital step for the purpose of estimating residual life and reliability of rotating machine, and there has been a lot of effort in identifying the causes of stator insulation degradation and failure and finding methods for assessing the condition of stator insulation systems in the past decades [6].
Historically, several conventional methods and parameters for assessing the high-voltage insulation condition have been proposed in the literature, such as measurements of insulation resistance (IR) and polarization index (PI), recovery voltage and ramped-DC voltage, capacitance (C) and dissipation factor (tan δ), AC and DC hipot tests, and partial discharge tests, as suggested in some standards [6–10]. All these traditional methods are complementary but incomplete and, on the other hand, the nondestructive parameters used to evaluate the condition of stator winding insulation are still controversial [11]. Therefore, it is necessary to find the sensitive parameters and develop some new assessment methods for the deterioration condition indication and assessment of stator winding insulation.
Generally, there are two kinds of methods to assess the condition of stator winding insulation, which are the direct method and the indirect method. A direct measure of the integrity of an insulation system may be the breakdown strength under Ac stress, as determined through destructive testing, which damages the winding and makes the machine unserviceable. An indirect measure of an insulation system may be nondestructive diagnostic tests, after which the insulation remains serviceable. However, the credibility in estimating the insulation's condition using these nondestructive tests should be well correlated to the results of breakdown tests.
In order to check aging symptoms and correlation factors, such as electrical diagnostic parameters, partial discharge (PD) measurement test was employed to assess the condition of stator insulation in this paper. Several statistical parameters of phase resolved PD distribution, called fingerprint parameters, were proposed. A partial least square (PLS) statistical approach was used to investigate the correlation between the breakdown strength and the PD fingerprint parameters, which is also used to assess the insulation condition assessment of large generator stator winding. The effectiveness of this method was verified by the test results of generator stator bars.
This paper is organized as follows. Section 2 introduces the stator bar experimental specimens and accelerated aging model used in this study. Section 3 describes the parameters test for the condition estimation of large generator stator insulation. The characteristics of PD distributions are analyzed and the results are shown in Section 4. And subsequently, Section 5 discusses some experimental results. Finally, Section 6 provides a conclusion.
2. Stator Bar Specimens and Accelerated Aging Model
The insulation of the model stator bars was made of epoxy/mica resin rich with the thickness of 3.5 mm, and the conductor of model bars was made of aluminum with the length of 1200 mm. The structure of the stator bar is shown as Figure 1.
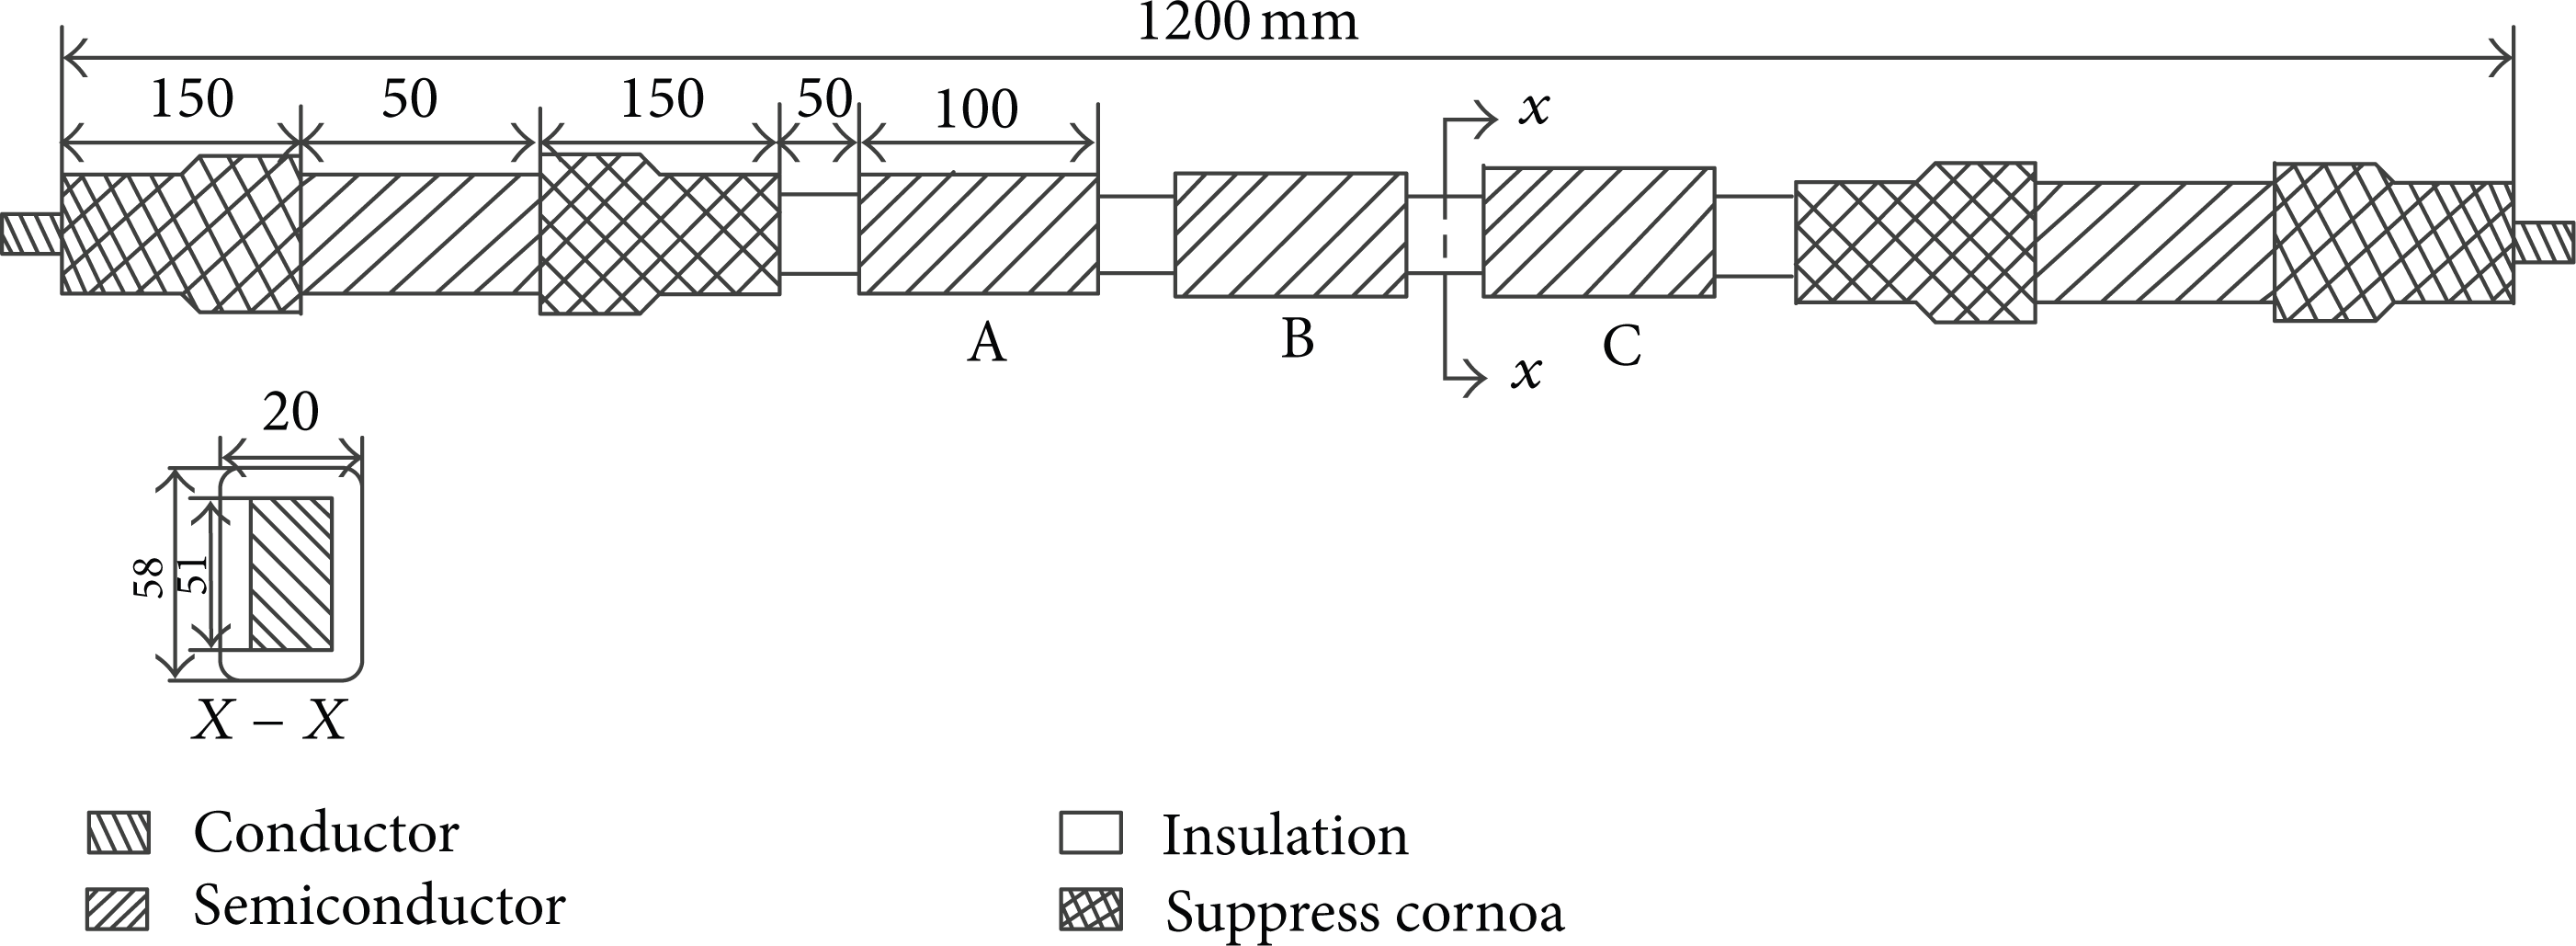
Structure of the stator bar.
To study the characteristic parameters and aging regulations of stator bar, the model stator bars were used to perform the accelerating aging test in laboratory. As mentioned above, several stresses were imposed to stator bar insulation in operation. According to IEEE Std.275, thermal, mechanical vibration and environmental stresses were applied in sequence. Considering the aging process of stator bar during the real operation of large generator, a combined multistress test model was proposed, as shown in Figure 2. The electrical, thermal, and mechanical vibration stresses were imposed on stator bars simultaneously.

The multistress test model, ((T) thermal stress, (E) electrical stress, (MV) mechanical vibration, (Test) test parameters, and (BR) breakdown test).
The acceleration aging tests were conducted on model stator bars at various stress levels for model bar simultaneity. Various stress levels were designed as: (a) electrical stress: aging electrical field intensity is 6.5 kV/mm and aging voltage is 22.75 kV; (b) thermal stress: aging temperature is 180°C; (c) mechanical stress: vibration frequency is 100 Hz and vibration extent is 1000 μm. In order to measure the nondestructive parameters, the insulation surface of ends of the model bar specimens was coated with silicone carbide paint to suppress corona for application of electrical stress. As shown in Figure 1, the middle three sections of stator bar were used to measure dielectric loss parameters tan δ and Δtan δ. The two ends of stator bar were used for the measurement of PD.
3. Parameters Measurement
In this study, PD measurement was performed after every aging cycle. Some PD parameters were employed to assess the condition of stator insulation under multistress aging. Breakdown voltage (VBD) test was performed on all specimens throughout the whole aging period to determine the remaining VBD after obtaining the PD parameters. In this way, the dielectric properties of ground wall insulation degradation with aging time could be obtained from every nondestructive measurement. The relation between the nondestructive parameters and the VBD could be studied based on the final measurement.
3.1. PD Measurement
In order to acquire the PD experimental data, the PD measurement system was proposed, as shown in Figure 3.
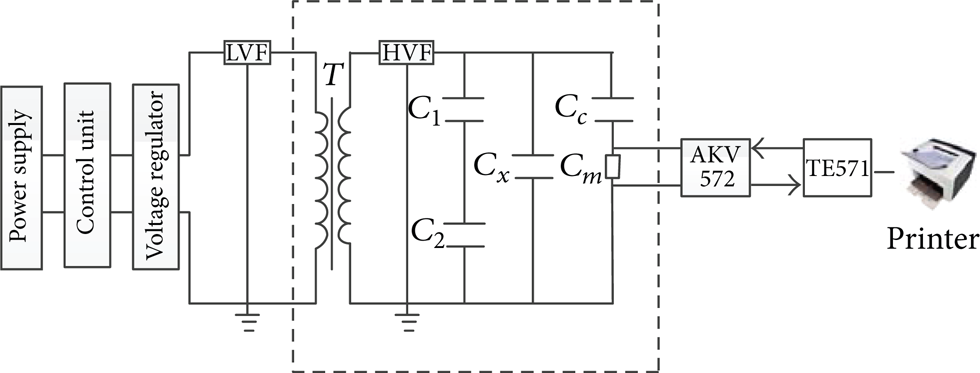
Schematic diagram of PD measurement system (LVF: low voltage filter, T: transformer, HVF: high voltage filter, C x : specimen, C c : coupling capacitor, C m : measurement impedance, AKV572: analog amplifier, and TE571: PD analyzer).
All the instruments were placed in a shielding room shown in the dashed frame. The PD analyzer and oscilloscope were connected to the measuring impedance through a high-frequency coaxial cable with characteristic impedance of 50 Ω. The PD measuring system is calibrated for each specimen before measurement by a standard calibrator manufactured by HAEFELY TRENCH.
3.2. AC Destructive Test
AC destructive experiment was performed to detect withstanding voltage ability of the stator bars. The specimens were broken down after each aging cycle in order to acquire the relation between the breakdown voltage (VBD) and the aging time. All breakdown tests were conducted according to the related IEC standard. The number of samples reduced gradually after each aging cycle due to breakdown, and the multistress accelerating aging finished after all samples were broken down. The test results demonstrated that the breakdown site was mainly located at the edge of the stator bar. The electrical, thermal, and mechanical stresses were the most severe at the edge of bar during the multistress accelerating aging, where the electrical field was also the highest during the breakdown test. Therefore, almost all the samples were broken down at their edges.
4. Measurement Analysis and Results
The characteristics of PD and PD detection techniques have gained popularity in the past years, which is now considered as one of the most useful diagnostic tools for generators. Efforts have been made in the course of years to relate PD magnitude, energy, and other parameters to insulation damage. Understanding the mechanisms of PD and degradation of insulating materials is important to improve the reliability of diagnosis.
In recent years, advancement of computer hardware and pattern recognition techniques has provided automation and improvement of the PD interpretation process. As a result of the computer-aided processing [12, 13], massive amounts of PD measurements can be interpreted efficiently and reliably [14, 15]. The well-known pattern recognition methods applied to PD analysis are expert systems, neural networks, fuzzy classifiers, fractal models, statistical methods, and others [16]. Phase resolved plots directly reflect the pulses distribution properties of PD. Phase resolved PD analysis results were obtained and reported in this section. The PD statistical parameters are also noted in this study for PD diagnosis.
4.1. Phase Resolved PD Analysis
PD is a complex physical phenomenon, in which discharges are involved in electrically weak regions of solid insulation materials. Much work has been done to understand and describe the nature of PD phenomena. In order to obtain meaningful data for pattern recognition, it is necessary to acquire the fingerprints of the PD signals under well-defined conditions for which the cause of PD is known. For many years, PD recognition was performed by visual examination, namely, on an oscilloscope screen. In recent years, the use of computer-aided processing technique has facilitated the automation of the recognition task. Phase resolved partial discharge (PRPD) measurement systems Especially have become very popular [17].
In phase-resolved PD measurement data, PD pulses are grouped by their phase angle with respect to power frequency sine wave. Consequently, the voltage cycles are divided into phase windows representing the phase angle axis (0 to 360°). The test voltage is to be held constant and the voltage phase angle is divided into a suitable number of small bins or windows. The digital PD detector is used to collect all the individual quasi-integrated pulses and quantifying each of these PD pulses by their discharge magnitude (q), the corresponding phase angle, or discharge epoch (φ), at which they occur and their number densities or discharge rates (n) over some chosen interval of time. The analysis software plots these data either as univariate distributions (functions of the phase positions φ) or as a bivariate distribution (such as φ-q-n plots). By taking appropriate averages of these statistical distributions, the observed PD patterns throughout the whole phase angle axis result in two-or three-dimensional patterns [18]. The main distributions, being function of the phase angle φ, are as follows. (a) Maximum pulse height phase resolved distribution H qmax (φ) and the pulse count distribution H n (φ) that represents the number of the observed discharges in each phase window as a function of the phase angle. (b) The mean pulse height distribution H qn (φ) which represents the average amplitude in each phase window as a function of the phase angle. H qn (φ) is derived from the total discharge amount in each phase window divided by the number of discharges in the same phase window.
Because of the phase-dependent behavior of PD generated under ac voltages conditions, several quantities as function of the phase angle can be used to describe the PD phenomena. The shapes of H qmax (φ), H qn (φ), H n (φ), and three-dimensional distribution H n (φ,q) changed with aging time. These distributions have characteristic shapes, which vary with the type of the defects [19]. Experience has shown that the shape belonging to the positive half of the HV sine wave differs much from that of the negative half, so that their characteristic shapes are available for recognition purposes.
In fact, regardless of whether the recognition process is performed by a computer system or experts, standard PD analyses usually apply phase resolved PD pulse height and phase of occurrence distribution to extract information about the characteristics of defects, as well as PD induced aging of the insulating materials [17]. However, it is difficult to describe the changes in deterioration of specimen insulation quantitatively with them. Therefore, authors make an attempt to introduce statistical parameters for analyzing the aging extent of insulation.
4.2. Statistical Parameters Analysis
The profiles of H qmax (φ), H n (φ), and H qn (φ) characteristics provide information of defects in insulation, in which partial discharges happen. In theory, the shapes of H qmax (φ), H n (φ), and H qn (φ) distributions can be used to classify discharges, either by recognizing them by eye or by observing them with pattern classifying approach. However, a more distinctive method has been based on the application of PD statistical parameters (operators). The term “operator” is used in this paper to denote mathematical descriptions or parameters. These statistical parameters (operators) are nothing more than the mathematical concepts according to the definitions in [18] and there is no relation to the test condition. These statistical parameters (operators) have been proved to be effective for PD analysis [19], especially for detecting the kind of defect or treeing [20]. In this approach, several aspects of the shape of the distributions are described by mathematical functions, as shown in the following.
The first operator is skewness Sk, which describes the asymmetry of a distribution with respect to a normal distribution. Sk = 0 means symmetric, Sk > 0 means asymmetric with the left side large, and Sk < 0 means asymmetric with larger right side. Sk is defined as

where q
i
is the recorded PD value and p
i
the probability of frequency of appearance for that value q
i
in time window i, μ is the mean
Ku indicates increased sharpness or the amount of concentration of the distribution with respect to the normal distribution. Ku = 0 means a normal distribution, Ku > 0 means a sharp distribution, and Ku < 0 means a flat distribution. Ku is defined as

Cc is used to evaluate the difference in shape between the distributions both in the positive and negative half cycles. Cc = 1 means 100% shape symmetry and, on the other hand, Cc = 0 means total asymmetry. The following formula is used to calculate the Cc:

where q i + and q i − are the mean discharge magnitude in i phase window in positive and negative half cycles, respectively, and N is the number of phase window per half cycle.
The asymmetry, Asy of H qmax (φ), H n (φ), and H qn (φ) as the quotient of the mean discharge level in the positive and in the negative half of voltage cycle, is defined as
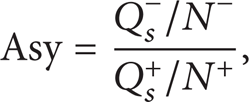
where Q s + and Q s − are the sum of discharges of the H qmax (φ), H n (φ), and H qn (φ) distributions in the positive and the negative half of the voltage cycle; N+ and N− are the number of discharges of the H qmax (φ), H n (φ) and H qn (φ) distributions in the positive or negative half of the voltage cycle.
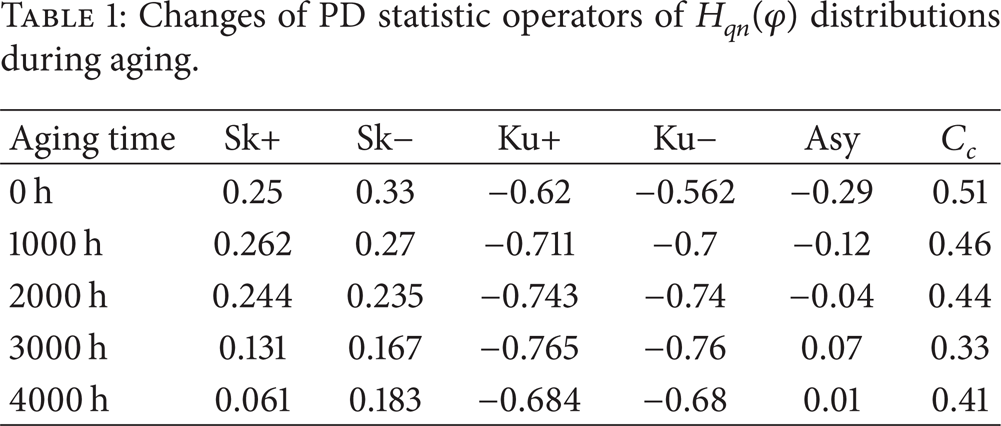
As aforementioned, Figures 4 and 5 show phase-position quantities of PD happening in various stator bars insulation, which had been conducted by multistress aging, respectively. An interpretation of the changes of PD statistical operators is listed in Table 1.
Changes of PD statistic operators of H qn (φ) distributions during aging.

Skewness change of phase-resolved distributions of PD.
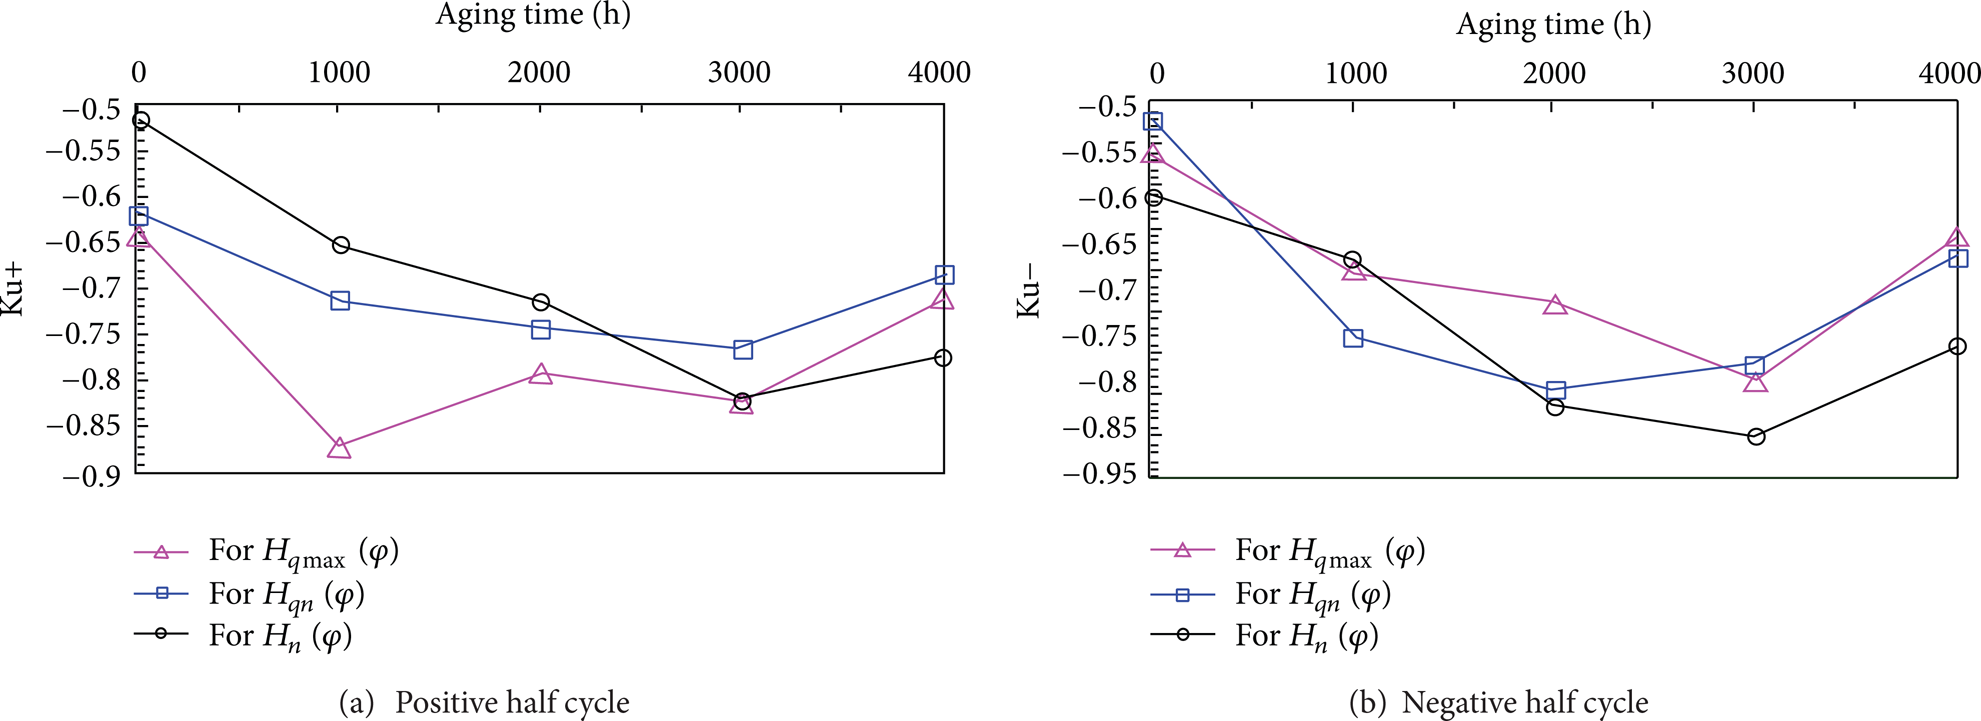
Kurtosis change of phase-resolved distributions of PD.
The test results indicate that all the specimens show the similar changing trend with little difference, so the test data of only one of the specimens subjected to all aging cycles are given in Figures 4–7.

Cc change of phase-resolved distributions of PD.

Asy change of phase-resolved distributions of PD.
Figures 4 (a) and 4 (b) show the positive and negative skewness changes of H qmax (φ), H qn (φ), and H n (φ) distributions with aging time. Each point in Figure 4 represents the skewness obtained at rated voltages of 6.6 kV. It is evident that the skewness decreases with the aging time no matter in positive half cycle or in negative half cycle. The changes of skewness of H qmax (φ), H qn (φ), and H n (φ) indicate that the change trend of voids is from flat to narrow in ground insulation. The H qn (φ) distributions of dielectric-bounded cavities (square and flat) as well as those of electrode-bounded cavities are characterized by positive values of Sk. Further, H qn (φ) processed for multiple cavities is also represented by positive Sk values [21].
The relations between the kurtosis of H qmax (φ), H qn (φ), and H n (φ) distributions and aging time are shown in Figure 5. No linear correlation between the kurtosis of PD distributions and aging time was found. The kurtosis Ku proved to be a good discriminator for multiple cavities [21]. Figure 5 shows that in the case of multiple cavities, the Ku value of the H qmax (φ), H qn (φ), and H n (φ) distribution is clearly negative. The result is in accord with the literature [21].
Figure 6 shows the change of cross-correlation factor of PD phase resolved distributions with aging time. It can be seen from Figure 6 that the cross-correlation factor of the H qmax (φ), H qn (φ), and H n (φ) distributions decreased nonmonotonously with aging time. Figure 7 indicates the asymmetric degree of H qmax (φ), H qn (φ), and H n (φ) increase with aging time.
These are better visible during the time that the discharges are stable. The above mentioned characteristics may prove to be useful for the development of a system for the diagnose of defects in insulating constructions.
4.3. Analysis of Relationship between VBD and PD Parameters
Breakdown voltage (VBD) is considered to be the most objective criterion for residual life of large generator. However, breakdown test is destructive. Recent efforts have been directed towards the condition assessment of stator insulation by using nondestructive insulation diagnostic measurement data. A review of extensive research works in this area reveals that the correlation between the nondestructive parameters and residual life (insulation breakdown voltage) is still controversial among researchers. As aforementioned, PD measurement has gained popularity over the years and is now considered as one of the most useful tools for insulation diagnosis and aging assessment of generators. However, the credibility in estimating the insulation's aging condition using PD tests should be well correlated to the results of breakdown tests. So PD data was systematically analyzed using a partial least square (PLS) approach in this study and the relationships between the breakdown voltage VBD and PD data were investigated.
Statistical data analysis has been widely used in establishing models from experimental or historical data. Typical problems in multivariate statistical analysis are high dimensionality and collinearity in a sparse sample data set. The partial least squares (PLS) modeling method is one of the most useful measures for overcoming these problems. PLS is a multivariate statistical data analysis and regression method, which uses projection into latent variables to reduce high-dimensional and strongly correlated data to a much smaller data set that can then be interpreted. Consider a given data base

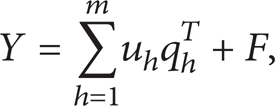
where p and q are loading vectors, and E and F are residuals. This relation is known as the PLS outer relation. The relation between score vectors t h and u h is known as the inner relation. The problems of sparse sample data set and multicollinearity are therefore solved effectively in regression analysis. For the m choice, a cross validation method [22] can be applied. The threshold of E variance can also be used as stopping criterion.
The PLS outer relation can be further expressed as

If a linear relation exists between latent variable matrices

The function f(·) expresses a linear or nonlinear function, detailed in [22, 24].
Over the multistress aging duration (0, 1000, 2000, 3000, and 4000 hours), PD and destructive tests were performed on 15 aging stator bar specimens after each aging period and a set of data was collected and testing data is shown in Table 2. There are six input variables and one output variable for the analysis model. As in the aforementioned results, the changes of statistical parameters of H qmax (φ), H qn (φ), and H n (φ) have similar trend curves with aging time. So the statistical parameters of H qn (φ), such as Sk+, Sk−, Ku+, Ku−, Asy, and Cc are used as the input variables in this study. The output is the breakdown voltage VBD.
Testing data.

To avoid the mistakes of analysis caused by unreal variations due to different units and/or scalar levels, a centered-compress (standardization) method was adopted in data preprocessing. The data set (including explanatory and response variables) was firstly standardized by

where i = 1, …, n; j = 1, …, p, n are the sample numbers, p is the explanatory variable numbers and s j is the standard deviation of explanatory variable x j . After being standardized, the mean and variance of each variable were equal to 0 and 1, respectively. The standardized preprocessing data is shown in Table 3.
Standardization preprocessing data.

Based on the PLS method, the first principal component t1 is extracted from data. The t1 synthesizes information of PD parameters matrix X and characterizes breakdown voltage VBD maximum. Three components (t1, t2, and t3) are extracted by these means. Various data messages of the stator winding condition parameters are shown in Figures 8–12.
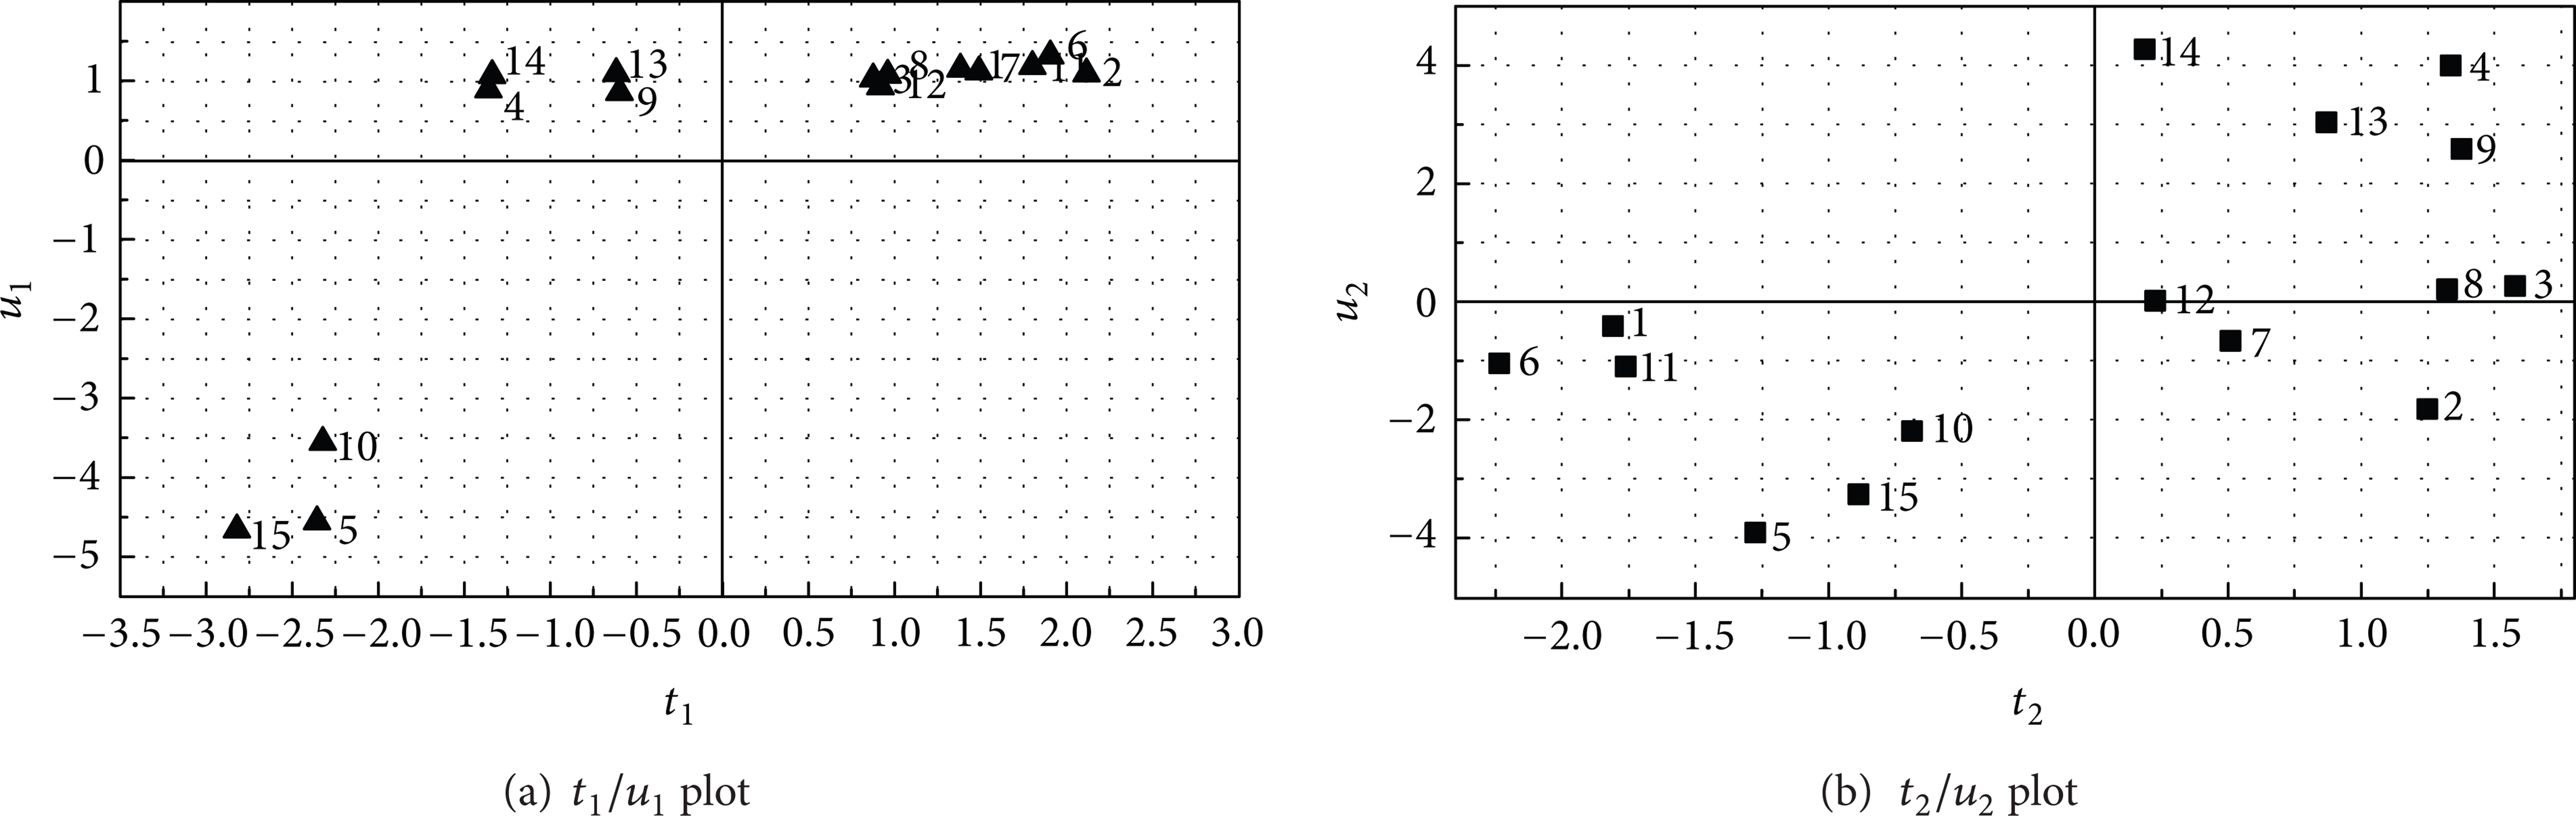
t/u plot of PD parameters.
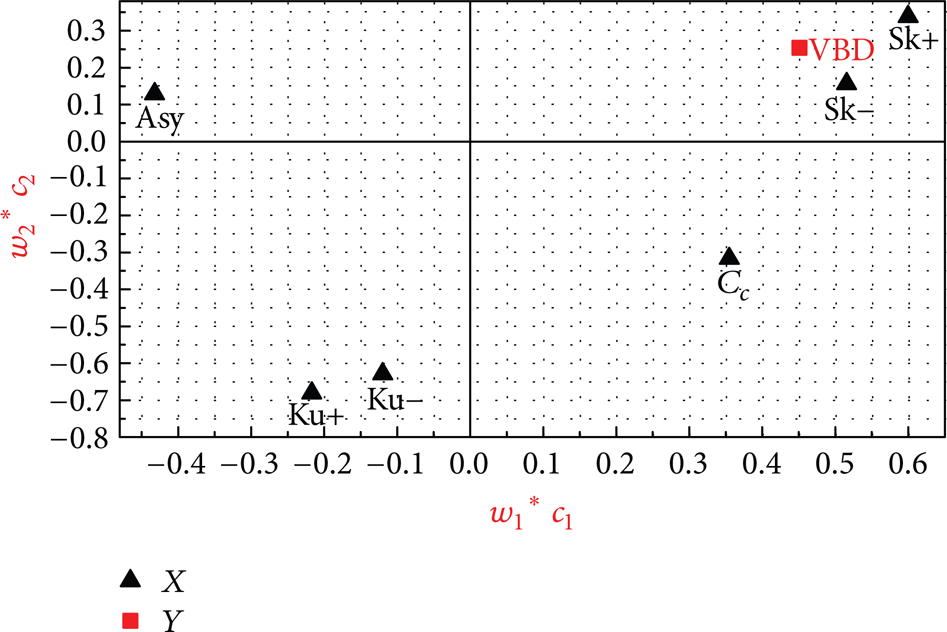
w1*c1/w2*c2 plot of PD parameters.

VIP plot of PD parameters.
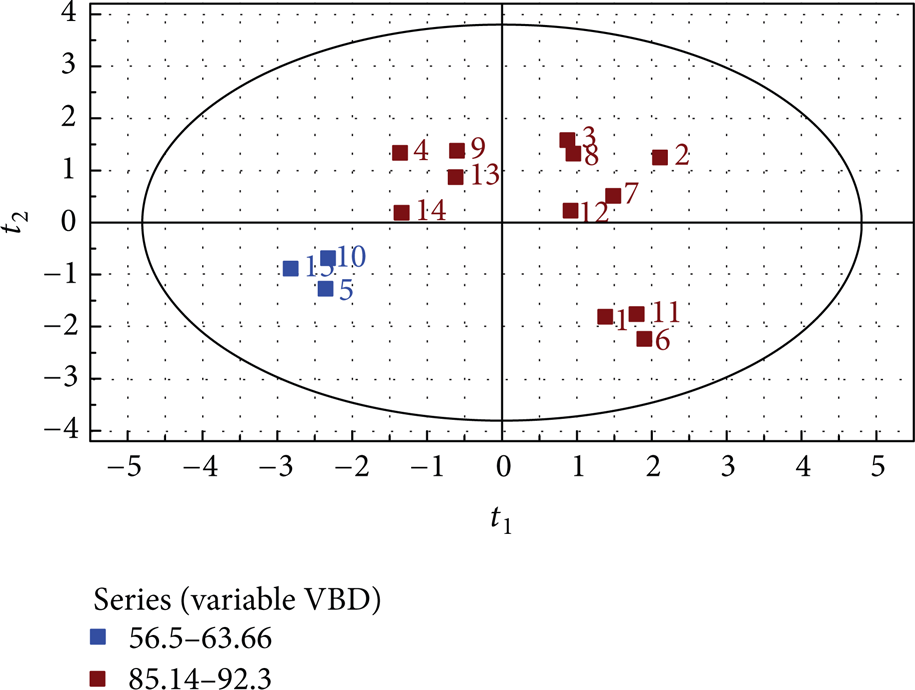
t1/t2 plot of PD parameters.
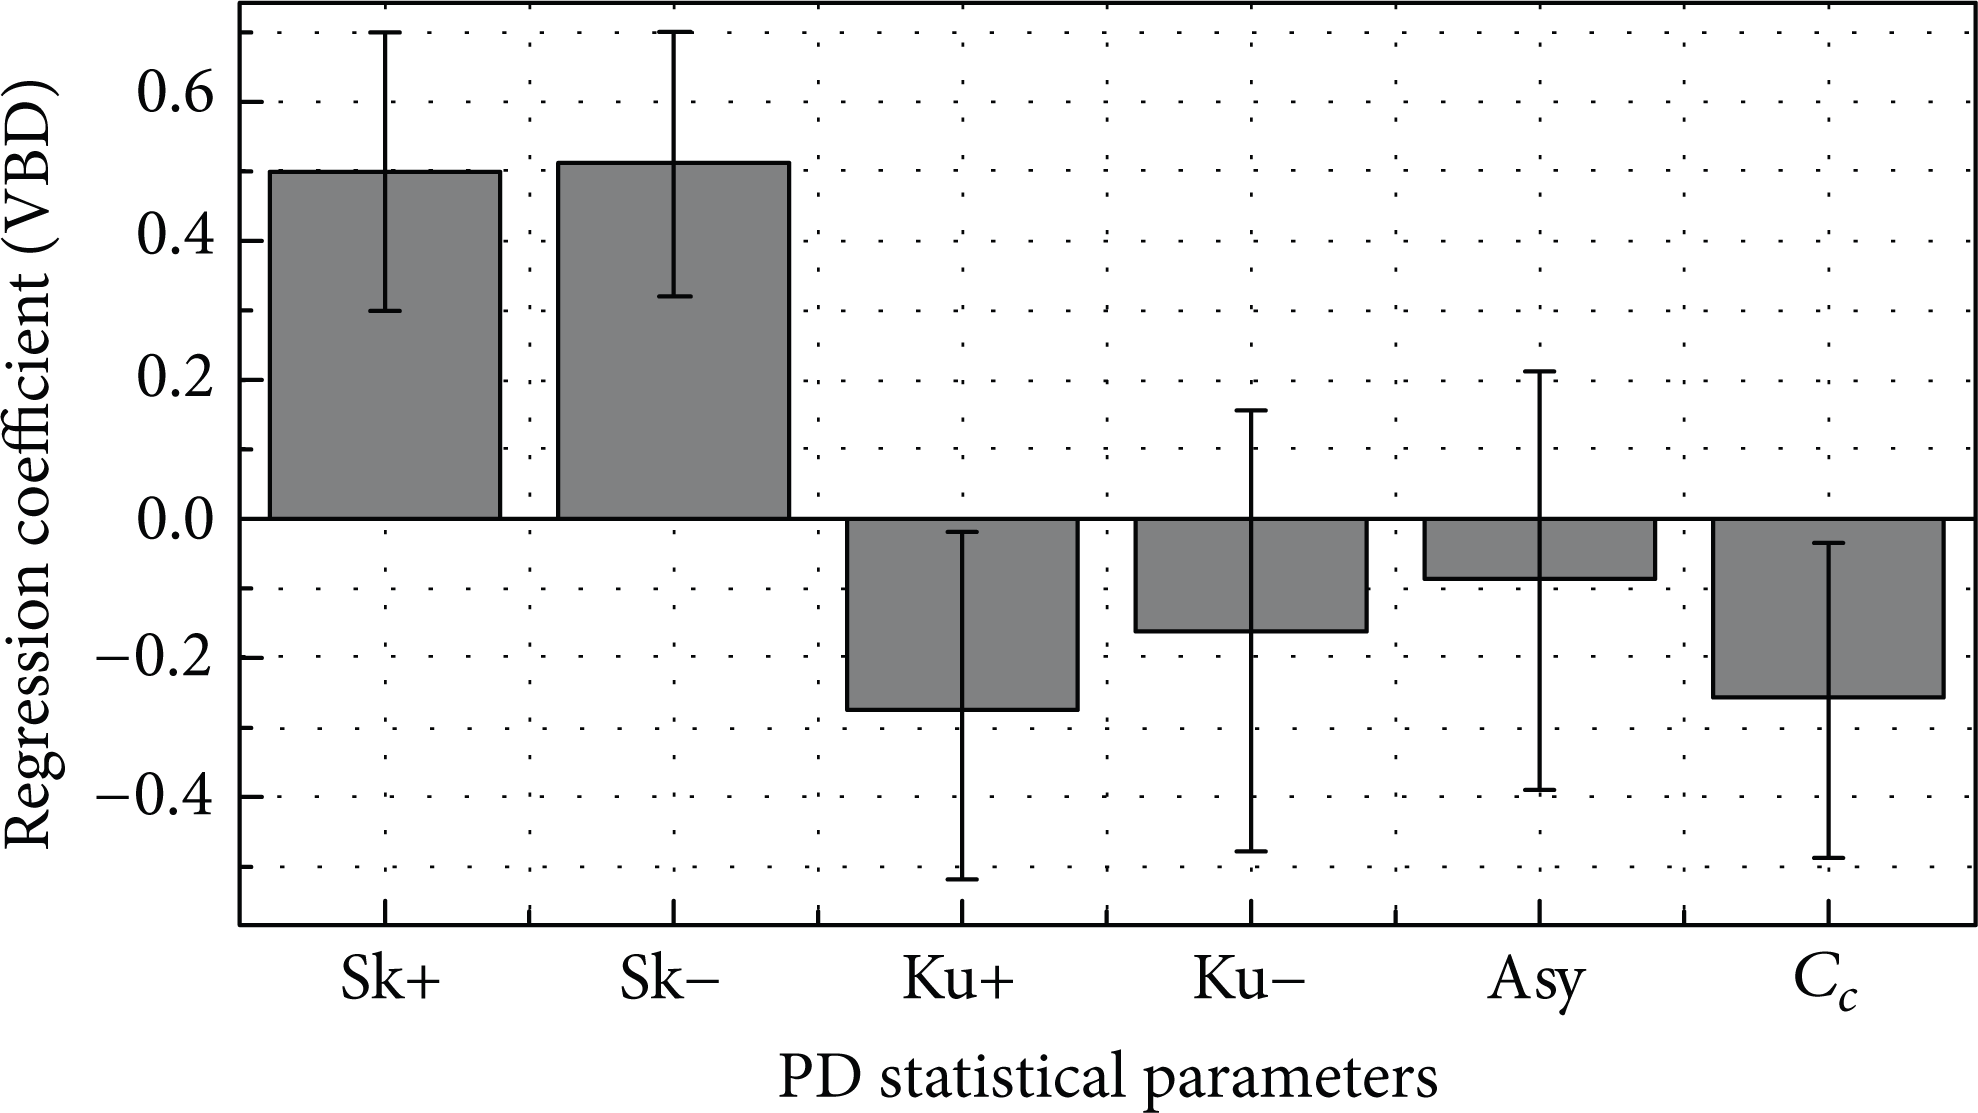
Regression coefficients plot of PD parameters.
5. Discussions
The PLS is a relative new data analysis method. Graphical analysis function of PLS is easy to understand various data messages of PD condition parameters. The relation between the PD parameters and breakdown voltage can be presented by t/u plot. The fitting results of each pair of latent variables (t and u) with the PLS inner mapping are shown in Figure 8. In order to analyze the experiments adequately, three components are extracted. The manner of component extraction using the PLS method shows that the information of t1 extracted from raw data is maximum (contributions rate is 54.7% by computing); score t2 takes second place (contributions rate is 33.7%) in comparison with the contribution rate of t3, 7.47%. Two scores are determined by the cross-validation method. In other words, the scores t1 and t2 (accumulative contributions rate is 88.4%) are enough to relate breakdown voltage VBD of generator stator.
In Figure 8 (a), 5, 10, and 15 are data samples of 4000 h aging duration. 4, 9, and 14 are samples with 3000 h aging duration. Figure 8 indicates that relation between the PD parameters and breakdown voltage (VBD) is linear approximately at the initial aging duration. The linear relation is not obvious with increase of aging time (especially after 4000 h). So the relation between the PD parameters and breakdown voltage cannot be characterized with linear relation simply.
The w1*c1/w2*c2 plot can express the correlativity between the PD parameters X and breakdown voltage (VBD) Y. The shorter distance stands for the better correlativity between the X and Y. Figure 9 indicates that there is a positive and stronger relation between skewness Sk and breakdown voltage VBD. This is in conformity with the experimental results of Figure 4, which shows that the changing trend of skewness Sk of PD distribution is sensitive and clear. The parameter Cc has negative stronger relation with VBD. Ku and Asy are hardly related with VBD.
Moreover, PLS method computes the influence on Y (VBD) of every term (PD parameters) in the model, called VIP (variable importance in the projection). The VIP values indicate the importance of terms in the model and the correlation of the terms to all the responses. Figure 10 shows that the effect of Sk is mostly in regression modeling and secondly in Cc and so on.
Distributing data samples can be observed easily using t1/t2 plot in the Hotelling's T2 ellipse box. Figure 11 indicates that there are not abnormal data in experimental data. The blue data point is, most different by other data points. Clearly, 5, 10, and 15 are data samples of 4000 h aging duration. The breakdown voltage (VBD) of these specimens is the lowest. Moreover, the regression coefficients of a simple PLS fitting model are shown in Figure 12. Although this paper only presents a simple regression model that is not enough to characterize the life model of stator bar, some novel ideas can be directed for further research work. In the near future, we will use improved nonlinear PLS modeling method to characterize life model by increasing aging time.
6. Conclusions
Nondestructive measurement has gained popularity and is now considered as one of the most useful tools for insulation diagnosis and aging assessment of generators. In order to check aging symptoms and correlation factors such as electrical diagnostic parameters, partial discharge (PD) measurement test was employed to assess the condition of stator insulation in this paper. The model stator bars were used to perform the accelerating aging test. The characteristics of the shapes of phase-resolved PD distributions were investigated. The relationships between the breakdown voltage VBD and PD statistical parameters data were systematically analyzed using a partial least square (PLS) approach.
The test results indicate that the phase-resolved PD distributions change much more remarkably with the aging time and can be used to describe the PD phenomena. The profiles of the phase-resolved PD distributions characteristics provide information about defects in insulation in which partial discharges are taking place.
Moreover, the statistical analysis of PD distributions is meaningful for aging-condition assessment of stator bar insulation. It is found clearly that the statistical parameter Sk decreases continuously with the aging time. Comparing with Ku, Asy, and Cc, the statistical parameter Sk of PD distributions is more sensitive to the change of PD activities occurring in the insulation of stator bar during the aging. Therefore, the parameter Sk would be taken as a characteristic parameter for the aging-condition assessment of stator winding insulation.
Because a direct indicator of insulation condition is the breakdown voltage under ac stresses, the breakdown test was also performed after each aging cycle in order to acquire the true aging condition. Correlation between nondestructive test data and destructive data was analyzed by means of PLS statistical model. The analysis results indicate that the PD statistical parameters are correlated to the results of breakdown tests. It is evident that the correlation coefficient of breakdown voltage with the PD statistical parameter Sk was the largest among all the correlation coefficients, which shows that the statistical parameter Sk of PD distributions is more suitable for the aging-condition assessment of the stator-bar insulation than other PD statistical parameters (comparing with Ku, Asy, and Cc).
Consequently, the mentioned above PD characteristics and PLS analysis approach may prove to be useful for the development of a system for the condition assessment of large generator stator insulation.
Footnotes
Acknowledgments
This work is supported by the National Natural Science Foundation of China (Grant no. 51177110) and Shanghai Natural Science Foundation of China (Grant no. 11ZR1439500).