
Abstract
With the advance of embedded sensing devices, Pervasive Urban Sensing (PUS) with probe vehicles is becoming increasingly practical. A probe vehicle is equipped with onboard sensing devices that detect urban information as the probe vehicle drive across the road network. For example, GPS sensors can detect real-time vehicle status including instant speed and physical position. PUS can provide the general public valuable urban sensing information, such as frequently updated digital maps, and real-time traffic light states. In this paper, we first present the framework of Pervasive Urban Sensing with probe vehicles. Next, we present two cases of urban sensing with probe vehicles. As case one, we discuss the design of a sensing algorithm for detecting the instant state of traffic lights. As case two, we discuss the design of sensing algorithms for recognizing roads by using the vehicular footprints. Some preliminary results of these two cases of urban sensing are presented and discussed.
1. Introduction
Governments and organizations have been engaged in providing convenient traveling experiences for citizens and drivers [1–5]. Besides convenience, reliability and security should also be guaranteed by Pervasive Urban Sensing (PUS). As a result, organizations and researches are creating and developing services such as digital map construction and update [6–9], traffic light optimization [1, 2], traffic flow detection [10], and so forth. Digital map construction and update are the foundation for most other services. The conventional method of digital map construction is based on geological survey, which is a time-consuming and expensive process. What is more, for the areas where new road networks are created or existed roads are reconstructed or closed, these digital maps may become outdated and not applicable for other services in PUS. Traffic light optimization is another important task in PUS, as drivers and passengers spend a large proportion of time waiting red lights. Thus, the switching history of traffic lights red-green status should be collected and optimization systems should be designed. Current way of collecting light history status is by field survey, which is laborious and not applicable to large-scale metropolis. Besides, traffic flow detection is the key component in navigation systems to provide reliable and optimal route scheduling for drivers.
Nowadays, an increasing number of vehicles are deployed with GPS devices for location detection and other status measurements. Taxis companies equip their taxis [11] with GPS devices for the requirement of supervisory control and scheduling. Apart from that, systems for collecting real-time taxis GPS traces and visualization projects should also be developed. For civilian vehicles, GPS devices are usually deployed together with the navigation systems. We collected GPS traces of about 4,000 taxis in Shanghai from March 2006 to May 2007. The GPS traces are coarse grained in terms of large sampling interval and inaccurate data sensory data.
It is probe vehicles equipped with GPS devices that make PUS possible and thriving. It is feasible to realize PUS with probe vehicles as urban activities or events especially those related to transportation will have direct effect on the movement status of probe vehicle. Through methodologies such as data analysis and data mining, these activities or events can be extracted from the GPS traces reported by probe vehicles.
There are several considerable advantages of urban sensing with probe vehicles. First, the expense will be reduced as the necessary elements of sensing system already exited, including the probe vehicles, and the data transmission and collection system. Second, the coverage of the sensing area is guaranteed to be large as the probe vehicles will traverse nearly all the road segments in the city. Third, the GPS traces reported by probe vehicles can be utilized in many sensing researches, including road map sensing, traffic flow sensing, traffic light status sensing, emergent accidents sensing, and others related to transportation.
This paper presents an overview to Pervasive Urban Sensing with probe vehicles, accompanied with two concrete examples, that is, traffic light sensing and road map sensing. Instead of presenting complete details, this paper gives a general introduction. In [6–9, 12, 13], map building using offline GPS trajectories with low error and high sampling frequencies have been studied. Gravitation and repulsion force in physical theory are utilized to do map detection in [12]. The authors in [6, 8] developed algorithms to detect new roads. In [10], the authors applied compressed sensing theory to reconstruct the citywide traffic flow status with limited GPS trajectories. Traffic light optimization algorithms and systems are developed in [1, 2, 4] with the help of optimization theory and heuristic algorithms.
The rest of the paper is organized as follows. Section 2 presents the main framework of PUS system and the characters and GPS traces generated by probe vehicles. In Sections 3 and 4, we introduce two urban sensing cases, traffic light sensing and road map sensing. The problem formulation and challenges are given together with the sensing algorithms. Section 5 concludes the paper with a discussion.
2. Preliminary
In this section we will present the general framework for PUS and analyze the characteristics of GPS traces generated by probe vehicles.
2.1. Urban Sensing Framework
The main framework of PUS is shown in Figure 1. Suppose there are N probe vehicles in the system, and each of them moves freely in the city and generates GPS report periodically. The generated GPS report at time t by vehicle i is a five-tuple,

System architecture.
The GPS reports are delivered to the PUS server via data channel of GSM/GPRS. Note that the quality of the data delivery channel will affect the quantity of GPS reports stored in the PUS sensing server. It is the PUS server that collects the real-time GPS reports and executes the Pervasive Urban Sensing tasks. After the real-time and reliable sensing results are produced, they will be made available to public through Internet.
2.2. Analysis of Real Vehicular GPS Traces
The fleet of probe vehicles we utilize in the PUS system are taxis from several taxis companies, and the sampling duration is from March 2006 to May 2007. Before conducting urban sensing, it is necessary to analyze the GPS reports in order to get the overall distribution of the GPS reports and be clear about what characteristics of the data may lead to challenges in the process of urban sensing. Thus, we conduct statistical experiments with one week GPS data in 2007 and the results are shown below.
2.2.1. Sampling Interval
The purpose of equipping taxis with GPS devices is for supervisory control and scheduling, so it is not necessary for the sampling interval of taxis to be as frequent as 1 Hz, which is the usual sampling interval used in many traffic studies [6, 7]. Among all taxis that report nonstationary GPS coordinates, 1,855 sample at 16 sec when vacant and 61 sec when occupied (corresponding to SH-B group in [14]); 430 sample at a fixed interval 60-61 sec; the rest mostly sample by the distance traveled.
2.2.2. Speed
The speed of a vehicle is influenced by a number of factors. Three conclusions are got through analysis to the GPS data. First, there is a large probability for a vehicle to travel with low speed when facing traffic lights. Second, the average speed of a taxi when it is vacant is much slower than that when carry passengers as it usually just travels around slowly to catch passengers when vacant. Third, the average speed of a vehicle in peak hours is much slower than that in normal hours as the traffic condition is much better and traffic is more fluent in normal hours.
2.2.3. Resolution
The GPS coordinates reported include four fraction digits, that is, 0.0001 degree, which is 8.5 or 11.1 meters along latitudinal or longitudinal line in Shanghai, respectively. Resolution limit aside, GPS measurement noise can be modeled as a Gaussian distribution [15]. Different roads have different number of length. Finally, tunnels and high-rise buildings are dense in downtown Shanghai, which can result in significant noise [14]. Nevertheless, we found the GPS measurement accurate enough for road recognition. For example, 94% of records are within 100 meters to some road, among which 95% are within 38 meters to the nearest road [14]. Figure 2 shows GPS samples as red dots on the map. Most of these dots are located near roads.

GPS reports and their heading directions on OpenStreetMap.
2.2.4. Spatial Distribution
By mapping GPS records onto digital map, we find that the spatial distribution is uneven in the urban area. Hot spots effect is very evident. The frequency of collecting GPS reports in areas where big malls or subways exist is much larger than other places. This suggests that for the areas where a relatively small amount of taxis pass by, the time duration used for collecting GPS reports should be longer to guarantee the quality of PUS services.
3. Traffic Light Sensing
3.1. Background
The objective of traffic light sensing is to detect the states of traffic lights, which is very important in many researches and applications, such as traffic lights optimization [1, 4, 5], traffic management [2], and real-time vehicle navigation. It is required to have traffic light state in order to optimize traffic management [3]. A number of research projects [1, 2] about traffic light optimization are being carried out all around the world. To perform traffic lights optimization, the information of traffic light state is very important.
Vehicle networks [16, 17] have attracted more and more attentions as they are providing intelligence transportation services and Internet access [18]. Traffic light state information is very important in designing vehicle routing protocols for its impact on the mobility of vehicle. Moreover, efficient data delivery approaches can be discovered when traffic light state is available since a red traffic light may pause a traffic flow and create good connectivity for a certain duration [17, 19–21]. However, traffic light state has not been considered in existing vehicle mobility models due to the lack of state information of traffic lights.
Thus, traffic light sensing is very important since it is fundamental for many exciting applications. Few researches are related to traffic light sensing yet. One candidate approach to traffic light sensing is to deploy cameras at intersections and perform image processing to detect the states of traffic lights. However, the expense of this approach is unbearable thus the coverage will be limited. Furthermore, this approach is vulnerable to bad whether such as fog or rain.
In this section, we introduce the approach of traffic light sensing with probe vehicles, which achieves several advantages such as large coverage and low cost.
Several challenges are faced in traffic light sensing with probe vehicles. First, the periods of a traffic light are not fixed, but adaptive to the current traffic condition of the road segments attached to the intersection. To detect road traffic, loop detectors [22] are deployed beneath the road surface. Second, GPS reports for a traffic light are temporal discrete but the objective of traffic light sensing is to detect the state of a traffic light at any time. Third, the distribution of GPS reports in the city is uneven. Thus, the effect of traffic light sensing with probe vehicles on all the lights in the city should be investigated.
3.2. Problem Description
A traffic light is changing its state over time and the interval of state may be uncertain. We denote ℳ as the set of traffic lights we are interested in, and
Suppose we get a state estimate

Then, the problem of traffic light sensing is to estimate traffic light states with the objective of minimizing the average estimation error rate ξ as follows:

We have the intuition that there is strong correlation between traffic lights and probe vehicles movements. The movements of a vehicle running in the city is regulated by traffic lights. We can easily find that the speed of a vehicle facing a red light is much smaller than that facing a green light. This is apparent since vehicles have to stop and wait for a red traffic light to turn green.
However, we also find that when the light is in red, there is a considerable percentage of nonzero vehicle speeds, and the percentage of zero speed is nonnegligible when the light is in green. This is understandable because immediately after the light turns from red to green, the vehicles have to spend a certain time to slow down before they fully stop. The reason is similar for the phenomenon of zero speed when the light is in green.
Moreover, when a vehicle is further from the traffic light, for example, 150 m away from the light, the mobility of the vehicle is relatively less related to traffic light state. This suggests that GPS reports generated far away from the lights should be neglected in traffic light sensing.
3.3. Detecting Light States
In this section we propose a novel algorithm for traffic light sensing. Two steps are executed in the algorithm, Snapshot State Estimation and Panoramic Static Estimation. The Snapshot State Estimation is to estimate the status of traffic lights one vehicle is facing at the moments GPS reports are generated. Panoramic Static Estimation is to estimate the continuous status of traffic lights citywide between
In Snapshot State Estimation, clustering models in machine learning are utilized to estimate the state of the traffic light
For a traffic light l, the subset of sensory reports related to this light is denoted by
In Panoramic Static Estimation, the problem of traffic light sensing for light l is transformed into finding a series of boundary time instants
We design two other objectives, for example, Violation minimization and Conformability maximization. Violation minimization represents that the violation between
4. Road Map Sensing
4.1. Background
Road map sensing aims to construct and update of digital road map with probe vehicle. Road map construction and update are the foundations of most systems that provide traffic services, such as navigation systems, online-traffic condition system, and so forth. Traditionary approaches of road map construction and update are based on geological survey. However, for areas where new road networks are created or existed roads are reconstructed or closed, these approaches cannot provide timely accurate road map and leads to errors within the services based on road map. For example, temporary roads have caused fatal accidents with even experienced drivers [25].
With more and more vehicles are equipped with GPS tracking devices, for example, taxis [11], buses [26], commercial and utility vehicles, it is possible to conduct road map sensing using GPS reports generated by these vehicles [7, 9, 12, 13, 27]. Thus, most existing map sensing approaches adopt the same strategy of clustering GPS reports that are likely on the same road segment and calculate the road centerline for each cluster. The clustering is conducted either based on an existed map [7] or high-sampling-rate GPS trajectories [12], typically at 1 Hz.
In this section, we introduce the problem of road map sensing with probe vehicles which generate coarse-grained GPS reports. It is a very challenging task due to the lack of existed map and inaccuracy of GPS reports.
Map building using offline GPS trajectories with high sampling frequencies have been studied too [6–9, 12, 13]. B-spline fitting is a popular method for approximating highways from GPS data [6, 8]. When the actual drive path of the GPS trace is unknown, data clustering is needed to group together traces that are likely from the same road [7, 9, 12, 13]. This problem is very challenging even with high-sampling-rate data. In [7, 13], the clustering is assisted by a base map. In [12], gravitational and attraction forces are simulated to cluster GPS traces. With a sampling interval of 15 seconds or higher, clustering GPS traces is extremely difficult. In our GPS traces, it is not uncommon that a taxi generates no more than one sample per road segment. The trajectory bears little or no similarity with the true road geometry. Highly accurate GPS locations benefit the data clustering significantly. In [12], the standard deviation of the GPS Gaussian noise is estimated to be 4.07 meters. With highly accurate GPS devices, traces from the same road but opposite heading directions are clearly distinguishable even visually [9, 12]. With a resolution limit already at around 10 meters, we have never observed any clear separation of GPS traces heading opposite directions.
In our algorithm, heading directions of vehicles are utilized to assist the data clustering. This information has been used to separate traces of opposite driving directions [9] and has been used to coarsely split traces in the preprocessing step [13]. Different GPS traces are then grouped together based on trajectory similarity. Some existing work go beyond road recognition and infer intersection and lane structures [7, 27], which we do not address in this paper.
4.2. Problem Description
Road map sensing aims to construct and update maps from coarse-grained GPS records reported by probe vehicles. A complete routable map used in navigation devices would contain geometry, lane configuration, speed limit, turn restriction, road type information, and so forth. In this section we focus on the recognition of road geometry, which is of first priority in building routable map.
The data set utilized for road map sensing is
There are several challenges in road map sensing with probe vehicles. First, errors exist in the GPS reports generated by probe vehicles. As shown in Figure 2, we can see that most GPS reports are away from the centerline of road segments, and heading directions of reports on the same road segments are not uniform. Second, the distribution of GPS reports on road segments is uneven. Some road segments have only few attaching GPS reports, for example, the circles one in Figure 2, and the frameworks of these road segments are not clear just with GPS reports. Third, we can connect consecutive footprints of a vehicle and get a continuous trajectory, as shown in Figure 3. Although such trajectories can provide sufficient information for detecting roads with few footprints, they also bring negative influence. In Figure 3, we can see that a considerable number of the raw trajectories are messy and provide no useful information for road map sensing. This is because these raw trajectories are not the actual drive paths of the vehicles.

Vehicle trajectories by connecting consecutive GPS reports of every vehicle.
4.3. Detecting Roads
In this section we propose the algorithm for road map sensing. The basic idea is to first aggregate the GPS trajectories that are likely on the same road segments into one cluster, and then apply fitting algorithms to obtain a polyline representing the road centerline for each cluster. However, in the very beginning, useless components in the GPS trajectories should be discarded.
As shown in Figure 4, we discard the part of GPS trajectories that cannot agree with real travelling route of vehicles. The criterion used is that the heading directions of two consecutive GPS reports together with the orientation of connected line segment in the trajectory should be the same for one vehicle.

Result of trajectories pruning. Useless components are discarded.
As shown in Figure 5, trajectories clusters are plotted in different colors. The basic idea is to allocate trajectories generated by vehicles likely travelling on the same road segments to one cluster.
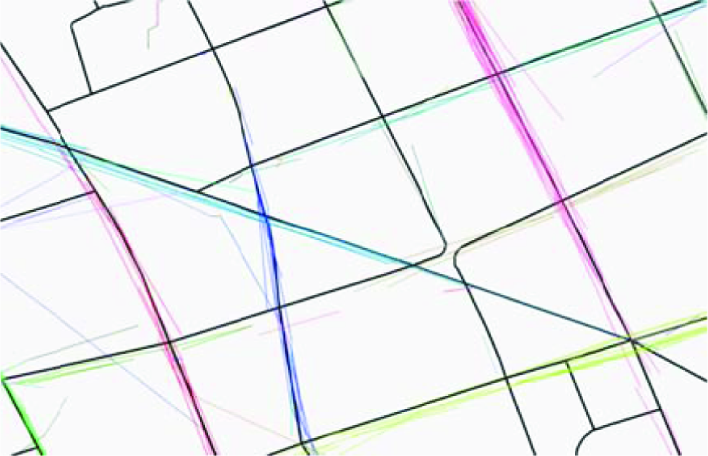
Result of trajectories clustering. Different clusters are in different colors.
For one GPS trajectory cluster shown in Figure 5, we want to generate one road segment utilizing cure fitting algorithms. Many fitting algorithms could be applied, including polynomial fitting, Weibull fitting, and so forth. We considered and tried nearly all fitting algorithms but the results are not good, as the background road segment of one trajectories cluster can be various types, for example, straight line, arches, or even curve. Finally, we found spline fitting [6, 8] is suitable and modify it to make it adaptive. The fitting result of an area selected is shown in Figure 6.

Road map sensing result: dashed lines are roads in OpenStreetMap, and red ones are those recognized.
In the trajectories clustering step, the problem shown in Figure 7 comes up. One possible approach to solve the problem is as follows. Firstly, find one polyline as the backbone. Secondly, GPS reports near the backbone are allocated into one new cluster and removed from the original cluster. Repeat these two steps till no more GPS reports exist in the cluster.

The problem: trajectories at road splits with small separation angles are allocated into one cluster.
5. Conclusion
This paper has presented the concept of Pervasive Urban Sensing (PUS) with probe vehicles. The general framework of PUS is presented. In addition, we also present some analysis on a dataset of real vehicular traces that have been collected from taxis operational in Shanghai, China. Two cases of PUS, that is, traffic light sensing and road sensing with probe vehicles are discussed. The problems of the two sensing cases are described. In addition, the basic algorithms for resolving the two sensing problems are presented.
We believe that PUB with probe vehicles will become increasingly practical and it will benefit the people living in cities by providing with valuable real-time urban information. However, many challenging issues remain untouched and a lot of research efforts are still required.
Footnotes
Acknowledgments
This research is supported in part by Shanghai Pujiang Talents Program (10PJ1405800), Shanghai Chen Guang Program (10CG11), NSFC (no. 61170238, 60903190, 61027009, 61202375, 61170237), MIIT of China (2009ZX03006-001-01), Doctoral Fund of Ministry of Education of China (20100073120021), National 863 Program (2009AA012201 and 2011AA010500), HP IRP (CW267311), SJTU SMC Project (201120), STCSM (08dz1501600), Singapore NRF (CREATE E2S2), and Program for Changjiang Scholars and Innovative Research Team in Universities of China (IRT1158, PCSIRT).