
Abstract
To improve conversion film techniques, control film properties and improve quality of following techniques, in this study, the environment-friendly phytic conversion films were deposited on AZ91D magnesium alloy. The performance evolution of the film during the forming process such as mechanical property, residual stress, corrosion resistance, micromorphology, composition, and roughness was investigated by nanomechanical testing system, electrochemical workstation, scanning electron microscope, Auger electron spectroscopy, and atomic force microscope. The results indicate that, in the forming process, the changes of micromorphology, roughness, mechanical property, and corrosion property are closely related to the variation of elements and residual stress. With the prolonging of film formation time, the difference between film elements and substrate elements gradually increases, and the residual stress first increases then decreases. When the film formation time is about 30 min, the film begins to crack and the residual stress is released, which leads to the decrease of mechanical property and corrosion resistance of the film.
1. Introduction
Chemical conversion film is widely applied to various fields of surface modification and protection due to its low cost, convenient preparation, uniform thickness, and special physicochemical property [1–4]. Usually as middle protective coating, stability and reliability of conversion film has significance to the safety and protective effect of following coating [5–7]. Microstructure, elements, mechanical property, and residual stress of conversion film are the major factors that contribute to failures such as cracking, stripping, falling off, and corrosion in direct and indirect application process, which can severely influence the range of application and service life of film [8–11]. In the forming process, changes of elements or thickness and dry shrinkage may lead to some residual stress within conversion film [12, 13]. Determination of this kind of stress has not been reported at present. Conversion film is important yet special in protection field, and residual stress may lead to deformation, cracking [14]. Therefore, accurate determination of micromechanical property and residual stress has great engineering significance and scientific value for the control and design of conversion film with good properties.
Because of the particularity of conversion film preparation techniques, its mechanical property is affected by many factors and changes with chemical reactions [14, 15]. Therefore, it is significant to study the microstructure, composition, roughness, and evolution law of residual stress in film forming process to improve conversion film techniques, control film properties and improve quality of following techniques. In this study, the evolution of the microstructure, composition, roughness, corrosion resistance, nanomechanical property, and residual stress in the film formation process was investigated.
2. Experimental
Die-cast AZ91D magnesium alloy samples were used as the substrate. Test coupons were polished by waterproof abrasive paper, from 360 grits down to 2500 grits, and after that fine-polished by using diamond paste of 3.5 μm; then they were degreased with absolute ethanol in ultrasonic bath for 15 min and subsequently dried by cold air at room temperature. The conversion treatment parameters were as follows: phytic acid concentration of 5 g/L and temperature of 20°C.
The morphologies of conversion coatings were observed using atomic force microscopes (AFM) and scanning electron microscopy (SEM). The characterization of the composition and depth distribution of elements in the conversion coatings was detected by Auger electron spectroscopy (AES) depth profiling with a base pressure below 1 × 10⁷ Pa. For electron excitation a primary electron beam of 10 keV was used. During depth profiling the samples were sputtered by two symmetrically inclined Ar ion beams of 2 keV. The sputtering rate was about 6 nm/min. The atomic concentrations were calculated by means of relative sensitivity factors of 0.3 for P transition at 120 eV, 0.085 for C transition at 272 eV, 0.35 for O transition at 506 eV, 0.13 for Mg transition at 1178 eV, and 0.075 for Al transition at 1390 eV.
All the electrochemical experiments were carried out in 3.5% NaCl solution at room temperature with the electrochemical system (Parstat 2273). The surface area of the working electrodes was 1 cm2. Ag/AgCl electrode was used as the reference electrode, and platinum plate with a surface area of about 1 cm2 was used as the auxiliary electrode. Potentiodynamic polarization experiments were performed at a scan rate of 0.3 mV/s.
Nanomechanical properties were conducted by employing a TriboIndenter (Hysitron Corporation) with the displacement and load resolutions being 0.1 nm and 0.1 μN, respectively. Indentation was made using a Berkovich indenter calibrated with a standard fused silica specimen. The indenter was also used as an AFM tip, and the indented surface was imaged after indentation. An average indentation load-depth curve and the corresponding real contact area were used to calculate the residual stress in the conversion coatings.
3. Results and Discussions
3.1. Microstructure and Composition of Conversion Coating
The dissolution of substrate and the formation of films are relatively fast at the initial stage. In order to deeply analyze this process, the film morphology is observed by using AFM at the initial stage of film formation (0–15 min), and the results are shown in Figure 1. The morphology of untreated sample is shown in Figure 1 (a). The surface is relatively smooth with some slight protuberances and pits. Figure 1 (b) shows the morphology of sample immersed in phytic acid solution for 1 s. The pits are deeper than the untreated sample, which may be due to the dissolution of substrate. Some compounds appear in the pits which are used as the nucleation points of the films beginning to form. Figure 1 (c) shows the morphology of sample immersed in phytic acid solution for 5 s. Pits in Figure 1 (b) have been filled on the whole, and the film was deposited on the surface. After 15 s, the deposition of chelate continues on the formed film as shown in Figure 1 (d). Many growing points uniformly spread on the surface, and the protuberances and pits turn slight. When time continues to increase, particulates continuously grow, and the film becomes thicker and thicker as shown in Figures 1 (e) and 1 (f). After 15 min, the film grows nodular without obvious protuberances and pits, and the consistent film comes into being on the surface of AZ91D.
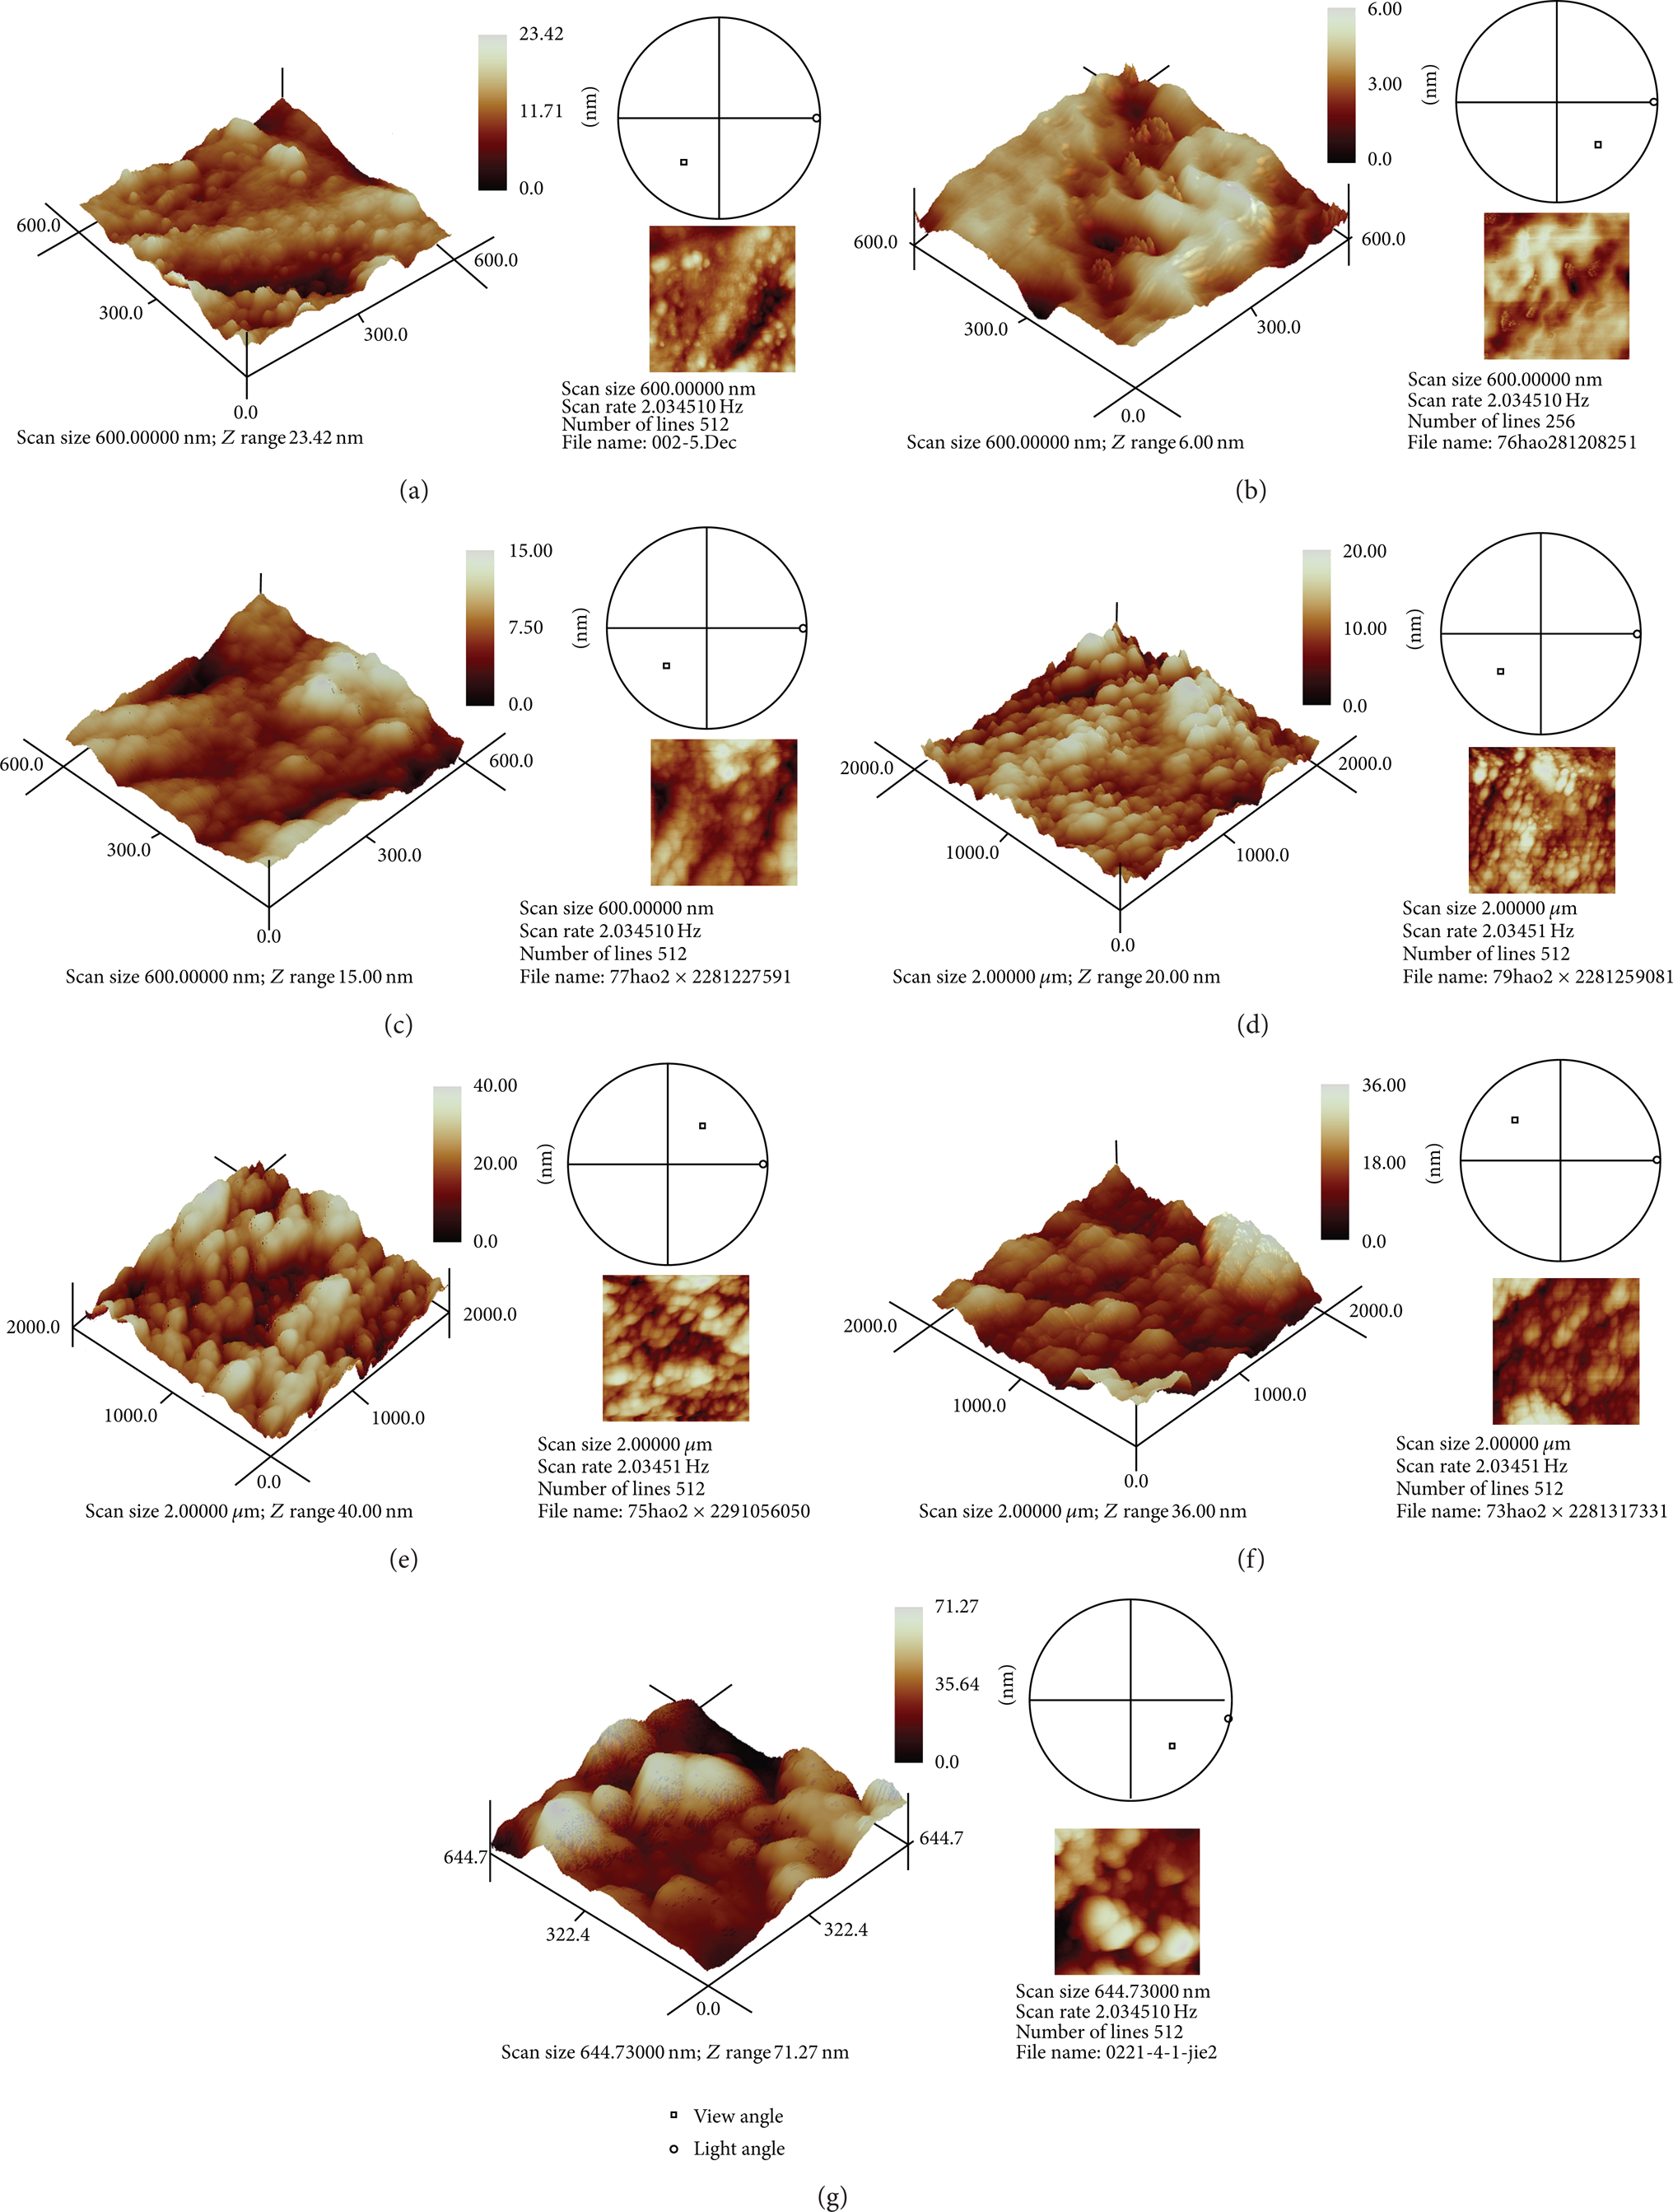
AFM pictures of conversion film at different forming times: (a) 0 min, (b) 1 s, (c) 5 s, (d) 15 s, (e) 1 min, (f) 5 min, and (g) 15 min.
Figure 2 shows the further analysis of conversion surface morphology at different forming times by using SEM. In Figure 2 (a), the surface morphology of AZ91D shows that the surface is mainly composed of dark α phase and bright β phase. After 5 min (Figure 2 (b)) and 15 min (Figure 2 (c)), the surface is smooth without cracks. After the film has been formed, the second phase still exists, which shows that the film formed in this stage is relatively thin. After 1 hour, microcracks begin to appear on the surface, and with the increase of time the crack density and width increase. The film formed on β phase is more compact than that on α phase, as is shown in Figures 2 (d), 2 (e), and 2 (f).
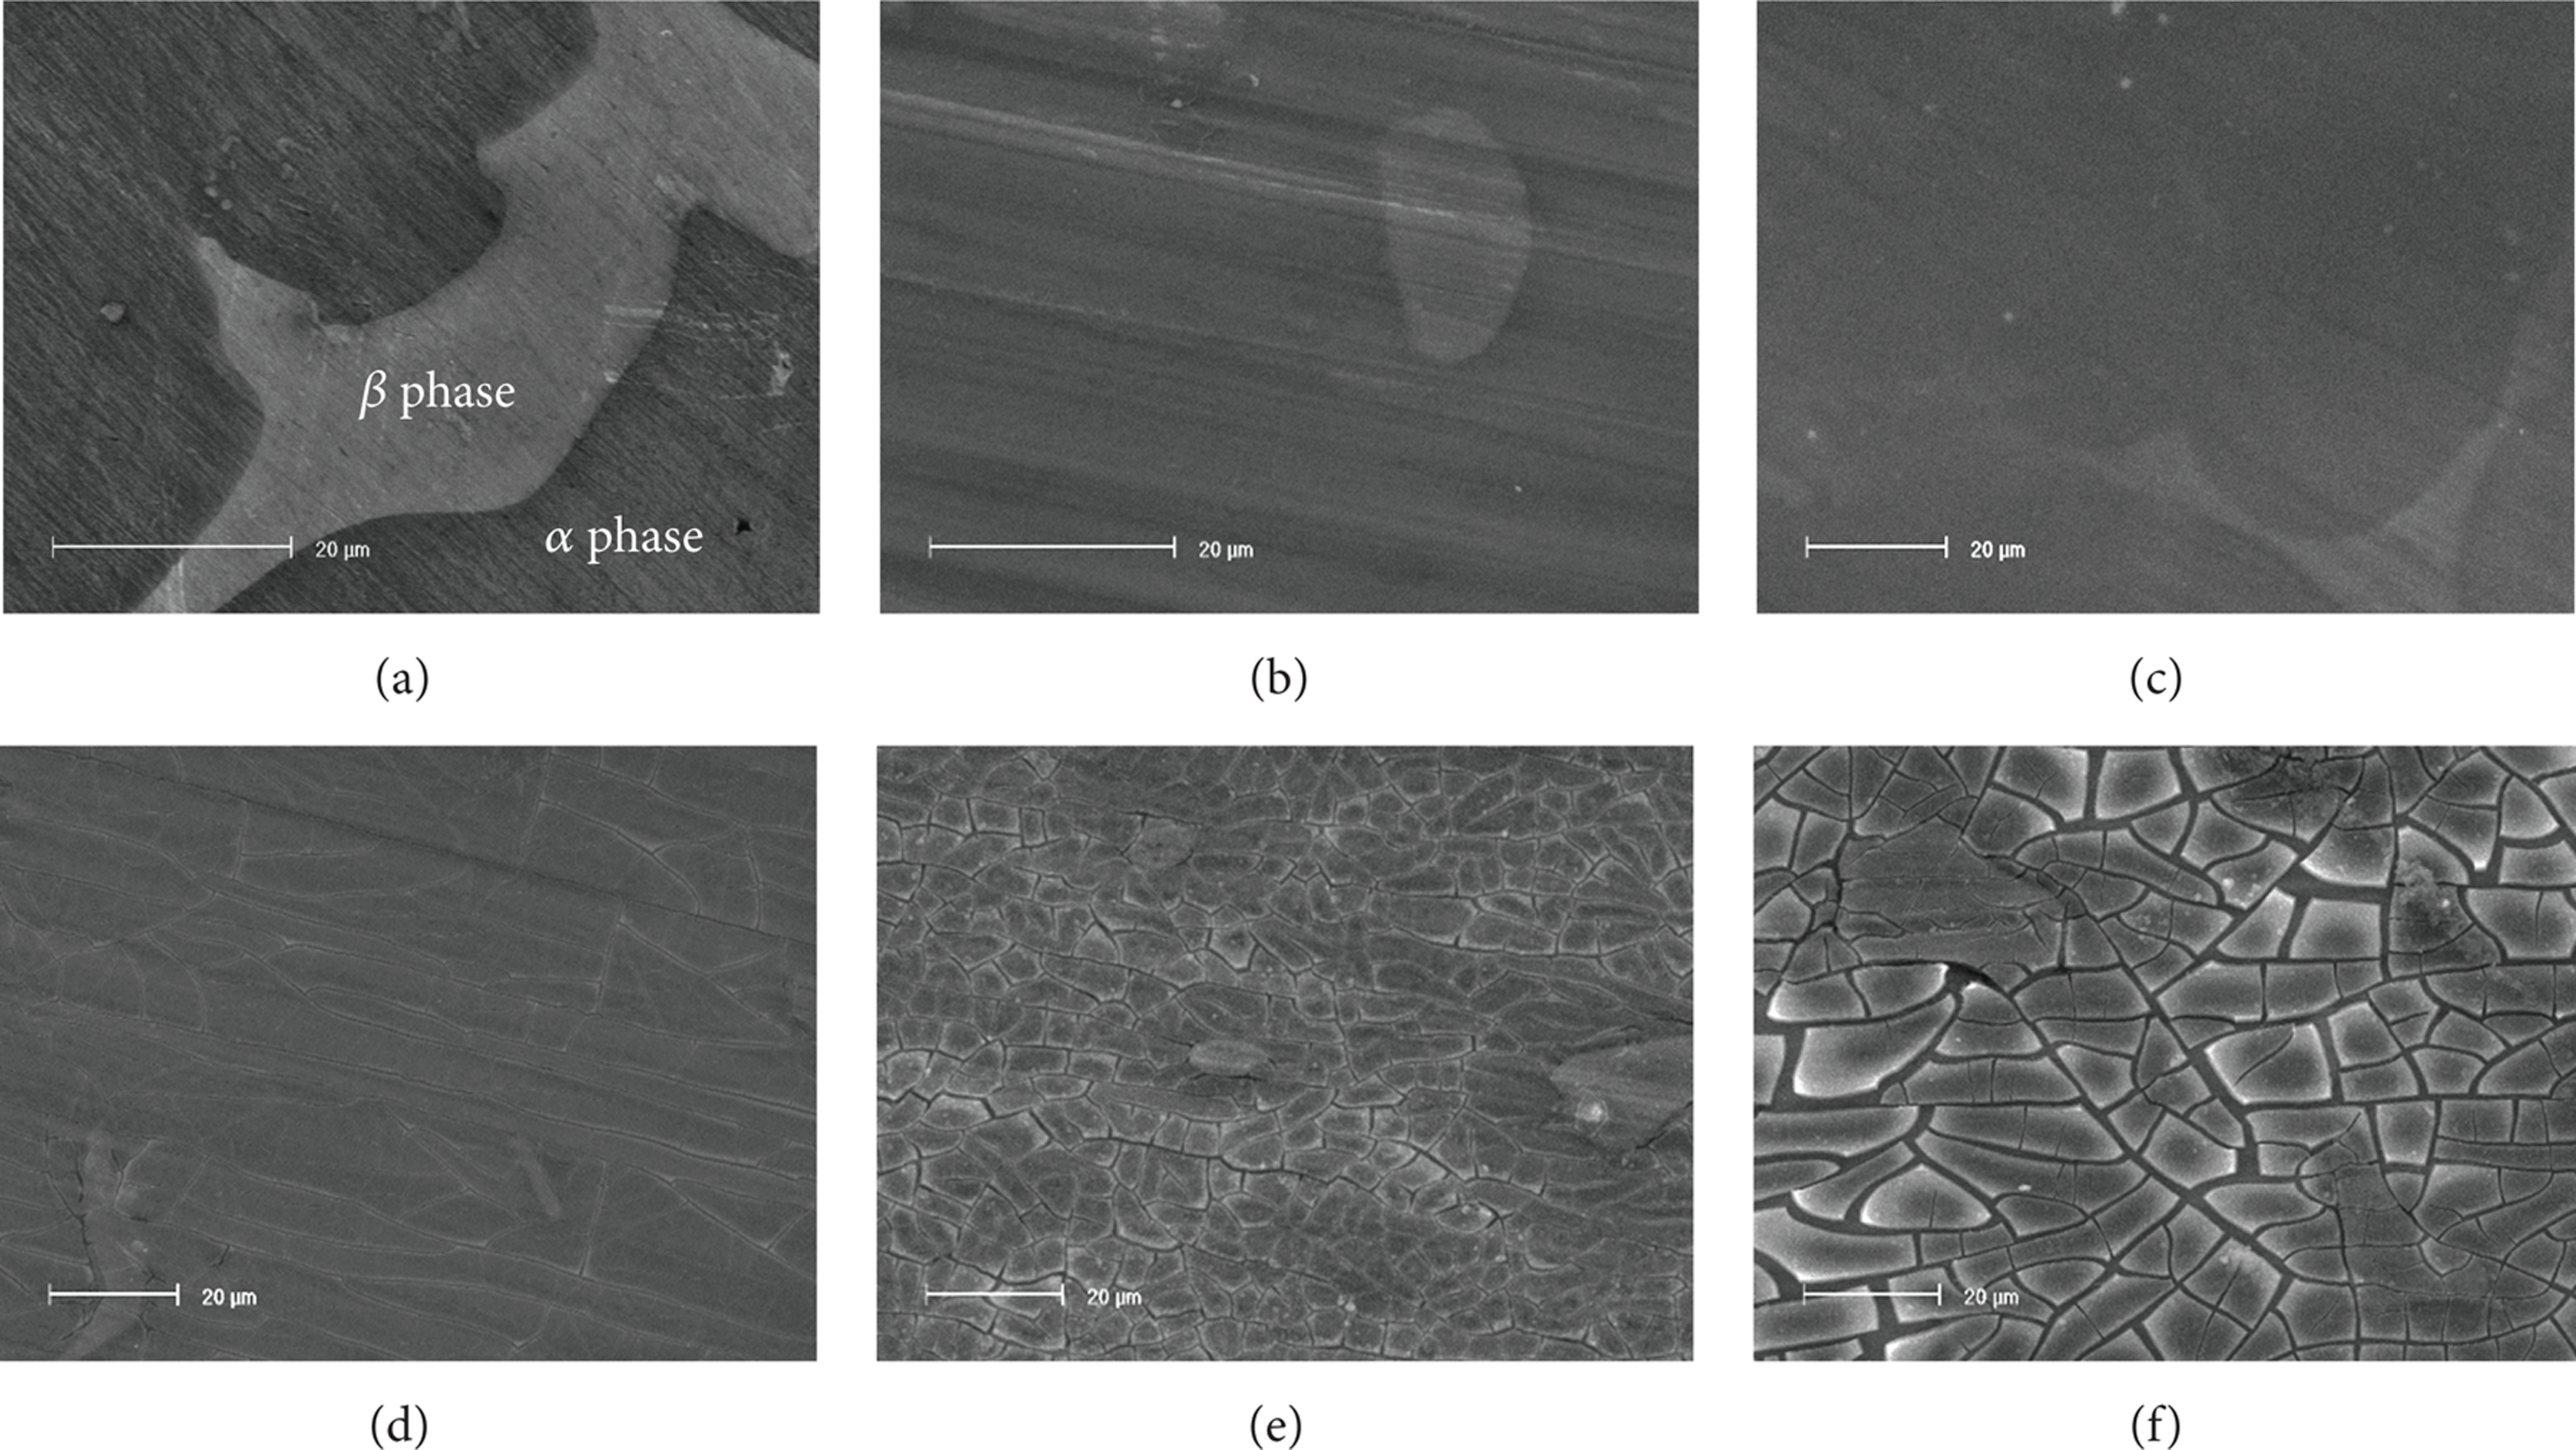
SEM pictures of conversion film at different formation times: (a) 0 min, (b) 5 min, (c) 15 min, (d) 1 h, (e) 3 h, and (f) 8 h.
Figure 3 shows the elements depth analysis results of film after 3 hours. The results indicate that the major elements of the film are C, O, Mg, Al, and P. According to the element analysis of AZ91D and phytic acid, the phytic acid conversion film on AZ91D is the product of the reaction between phytic acid and Mg, Al in AZ91D. From Figure 3, it can be seen that O content in surface is the most, up to 40%, and the second is Mg and then is Al and P. Meanwhile, the major element contents of film display grading changes with depth. Mg and Al increase along with depth, while C, O, and P decrease with the increase of depth. It can be concluded that the number of metal ion chelating phytic acid on magnesium alloy decreases with the increase of film formation time. When sputtering depth reaches 2400 nm, element contents have matched those of AZ91D magnesium alloy, which indicates that the depth of film for immersion 3 h is about 2400 nm.

Depth profile of elements in the phytic acid conversion coatings for immersion 3 h on AZ91D magnesium alloy.
Figure 4 shows the atomic percentages of film elements on AZ91D surface at different formation times. The P, C, and O come from phytic acid, whose contents roughly increase with time prolonging; Mg and Al come from magnesium alloy substrate, roughly decreasing with the increase of time.
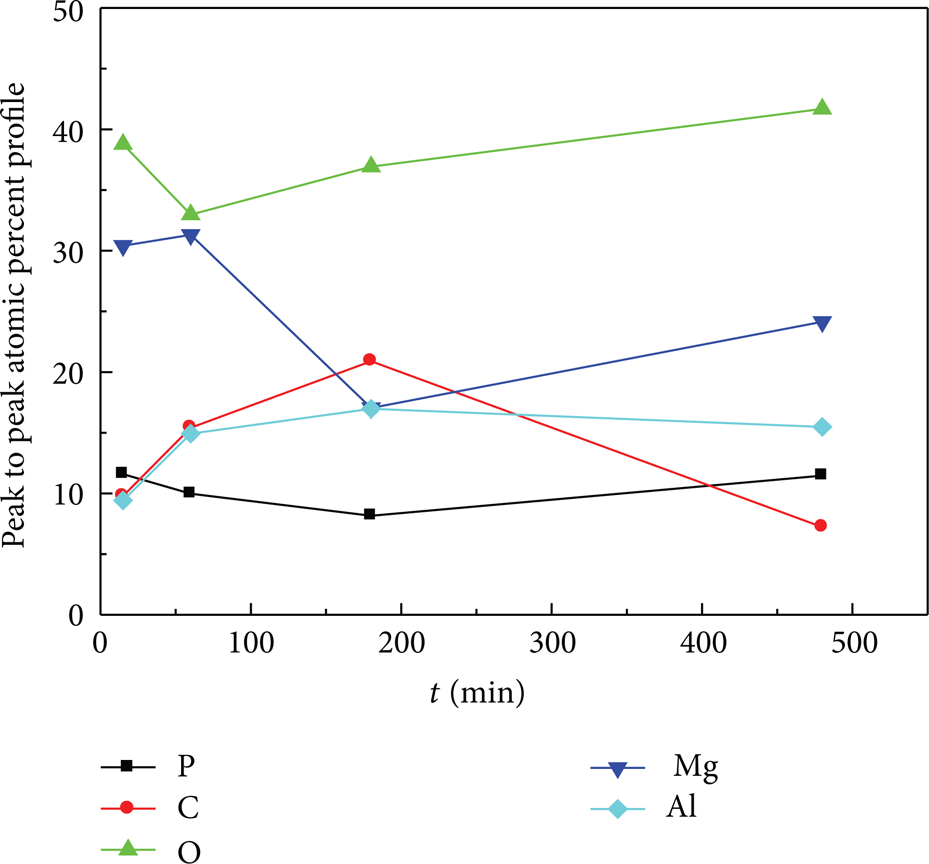
AES elements surface analysis of conversion film at different formation times.
Table 1 shows the results of surface roughness of conversion film at different formation times. With the prolonging of formation time, roughness of film first decreases and then increases. Initially, between 1 min and 30 min, film surface roughness remains steady with low value. This phenomenon matches the results achieved by scanning electron microscope in formation process. In the initial formation stage, the hydrogen evolution reaction happens on magnesium alloy surface by the action of aqueous solution, which leads to the dissolution of substrate and the increase of surface roughness. With the increase of formation time, covering area of film on substrate surface becomes larger and larger, the hydrogen evolution reaction reduces, and protuberances and pits caused by substrate dissolution are gradually filled. After substrate surface is totally covered by film, surface roughness remains in a stable range. About 1 hour later, with time prolonging, film thickness increases and begins to crack, and the surface quality slowly decreases and roughness increases again.
Roughness conversion film at different film formation times.

3.2. Corrosion Resistance of Conversion Coating
Figure 5 shows the dynamic potential polarization curves of film at different formation times. With the time prolonging, the corrosion resistance first increases and then decreases. At 15 min, the self-corrosion current density is the smallest. At other formation time, film displays passivation of different degrees. From 1 hour to 8 hours, both self-corrosion potential and self-corrosion current density increase along with time increasing. This indicates that the film thickness increases along with time, but crack reduces the resistance in corrosion medium; therefore, corrosion resistance declines when time increases.

Dynamic potential polarization curve of film at different formation times.
3.3. Mechanical Property and Residual Stress of Conversion Coating
Figure 6 shows the load-displacement curve at different formation times. From 1 s to 1 min, the film just begins to deposit, so the load curve is greatly influenced by grinded magnesium alloy substrate surface; the law of curve is not obvious. From 1 min to 15 min, in loading process, with same indentation depth, indentation load increases with the increase of formation time. When formation time prolongs to 30 min, indentation load decreases.
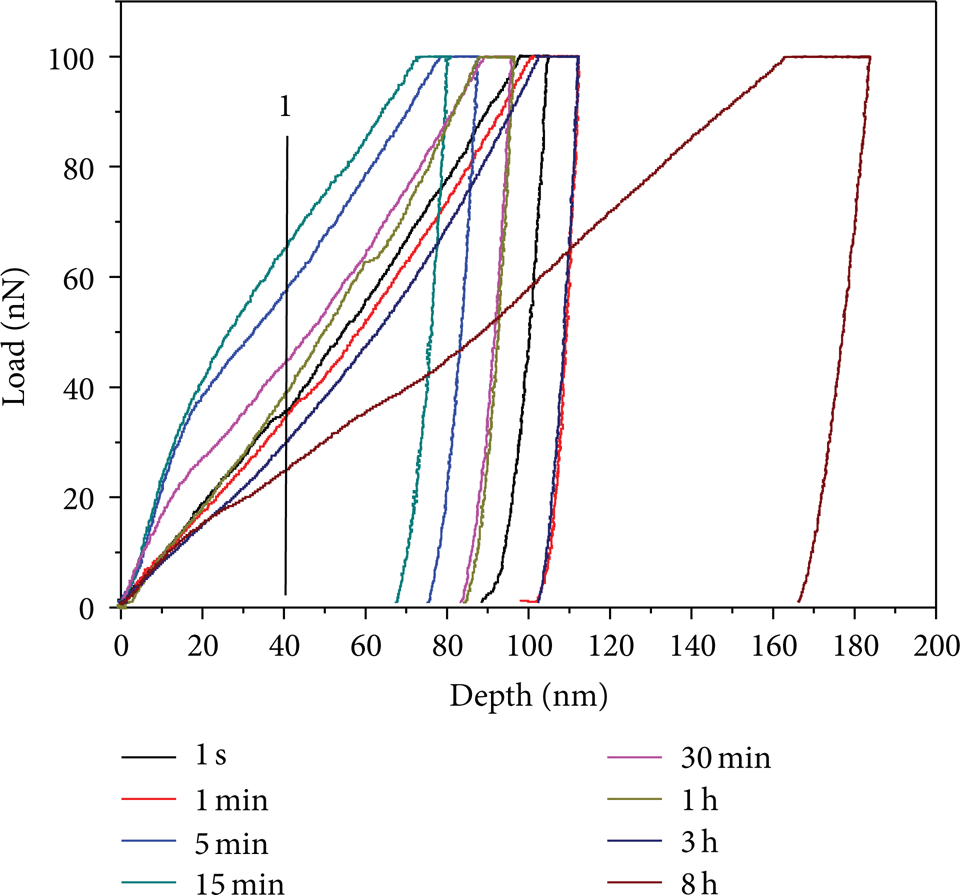
Load-displacement curves of conversion film at different film formation times.
Figure 7 shows the nanomechanical performance analysis results of film at different formation times. Hardness and modulus elasticity are the average of three measurements. With the increase of formation time, modulus elasticity and hardness present similar variation trend. At initial state (1 s–1 min), thickness is small, and mechanical performance is greatly influenced by substrate surface, so modulus elasticity and hardness display downtrend. With the increase of thickness, influence of substrate becomes smaller and smaller; at the time of 15 min, film displays the optimum mechanical performance. When time prolongs to more than 30 min, mechanical performance presents a slow downtrend. Along with the increase of time, lowering speed increases. Combined with morphology analysis results, the reasons for this phenomenon are that with the increase of formation time, thickness increases, compositional difference between film and substrate gradually increases, and thus residual stress increases after film being dried. When stress becomes bigger than bond of film surface, cracks appear, and along with the increase of formation time, crack density and width increase, so mechanical performance of film gradually weakens.

Mechanical performance variation of film at different formation times: (a) hardness, (b) elastic modulus.
According to morphology and mechanical property in film formation process, this paper chooses the following formula put forward by Suresh and Giannakopoulos to calculate the value of residual stress [16]:

In the formula, H is material hardness and A0 and A are, respectively, indentation projection areas without and with residual stress. A and H can be acquired by analyzing the nanoindentation results. Figure 8 shows the indentation AFM profile of conversion film after 1 hour. Processing the original data at different formation times, the values of A are shown in Table 2 and the values of H are shown in Figure 7 (a).
Nanoindentation areas at different film formation times.

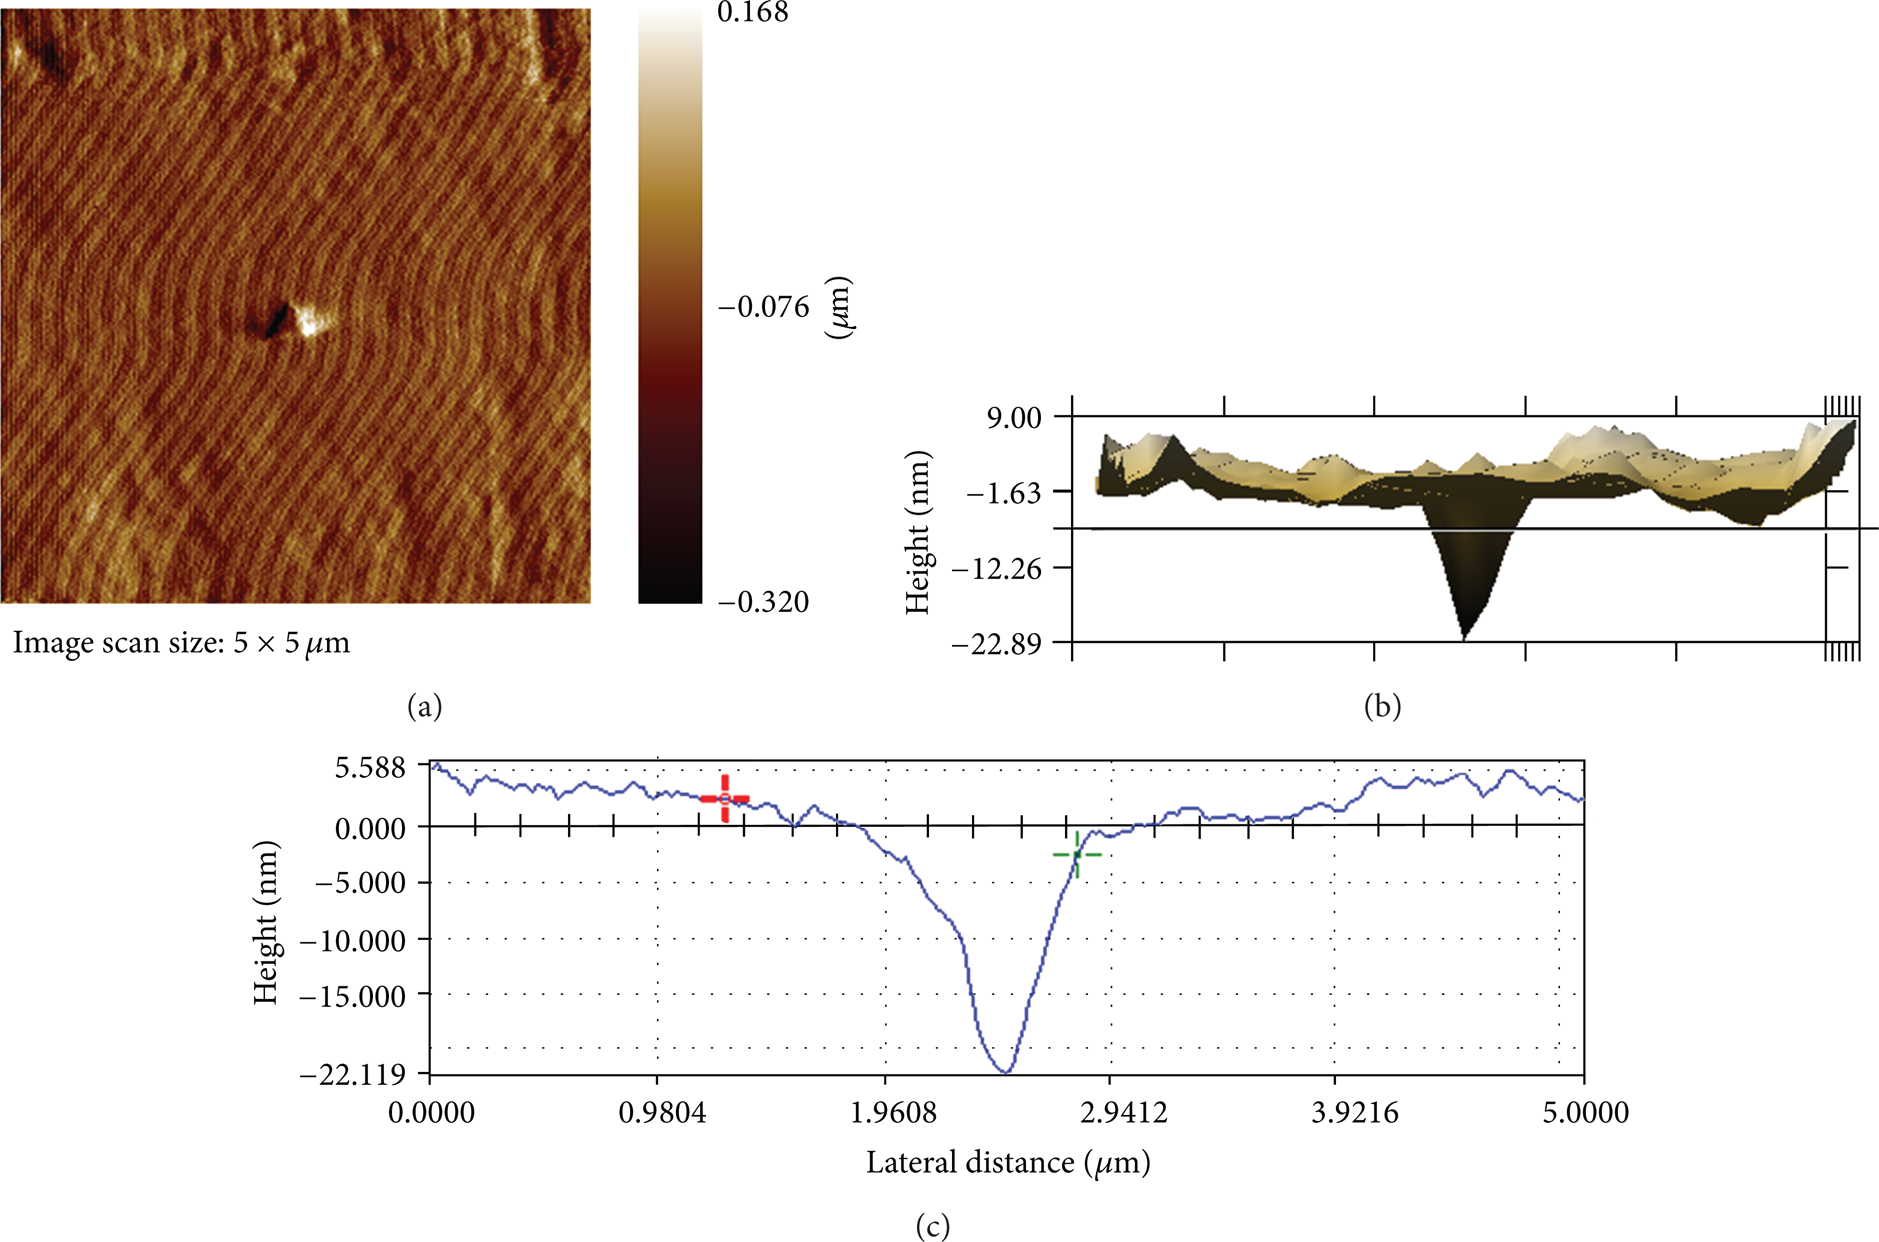
Indentation AFM profile of conversion film after 1 hour: (a) 2D, (b) 3D, and (c) cross-section.
Figure 9 shows the calculated values of residual stress. It can be seen that with the increase of film formation time, the residual tensive stress first increases and then decreases, and it can achieve the maximum about 15 min later. Combined with morphology analysis, it can be known that, before cracking, with the increase of thickness, residual stress also increases. When cracks gradually appear, residual stress is released and begins to decrease with the increase of crack width and density.
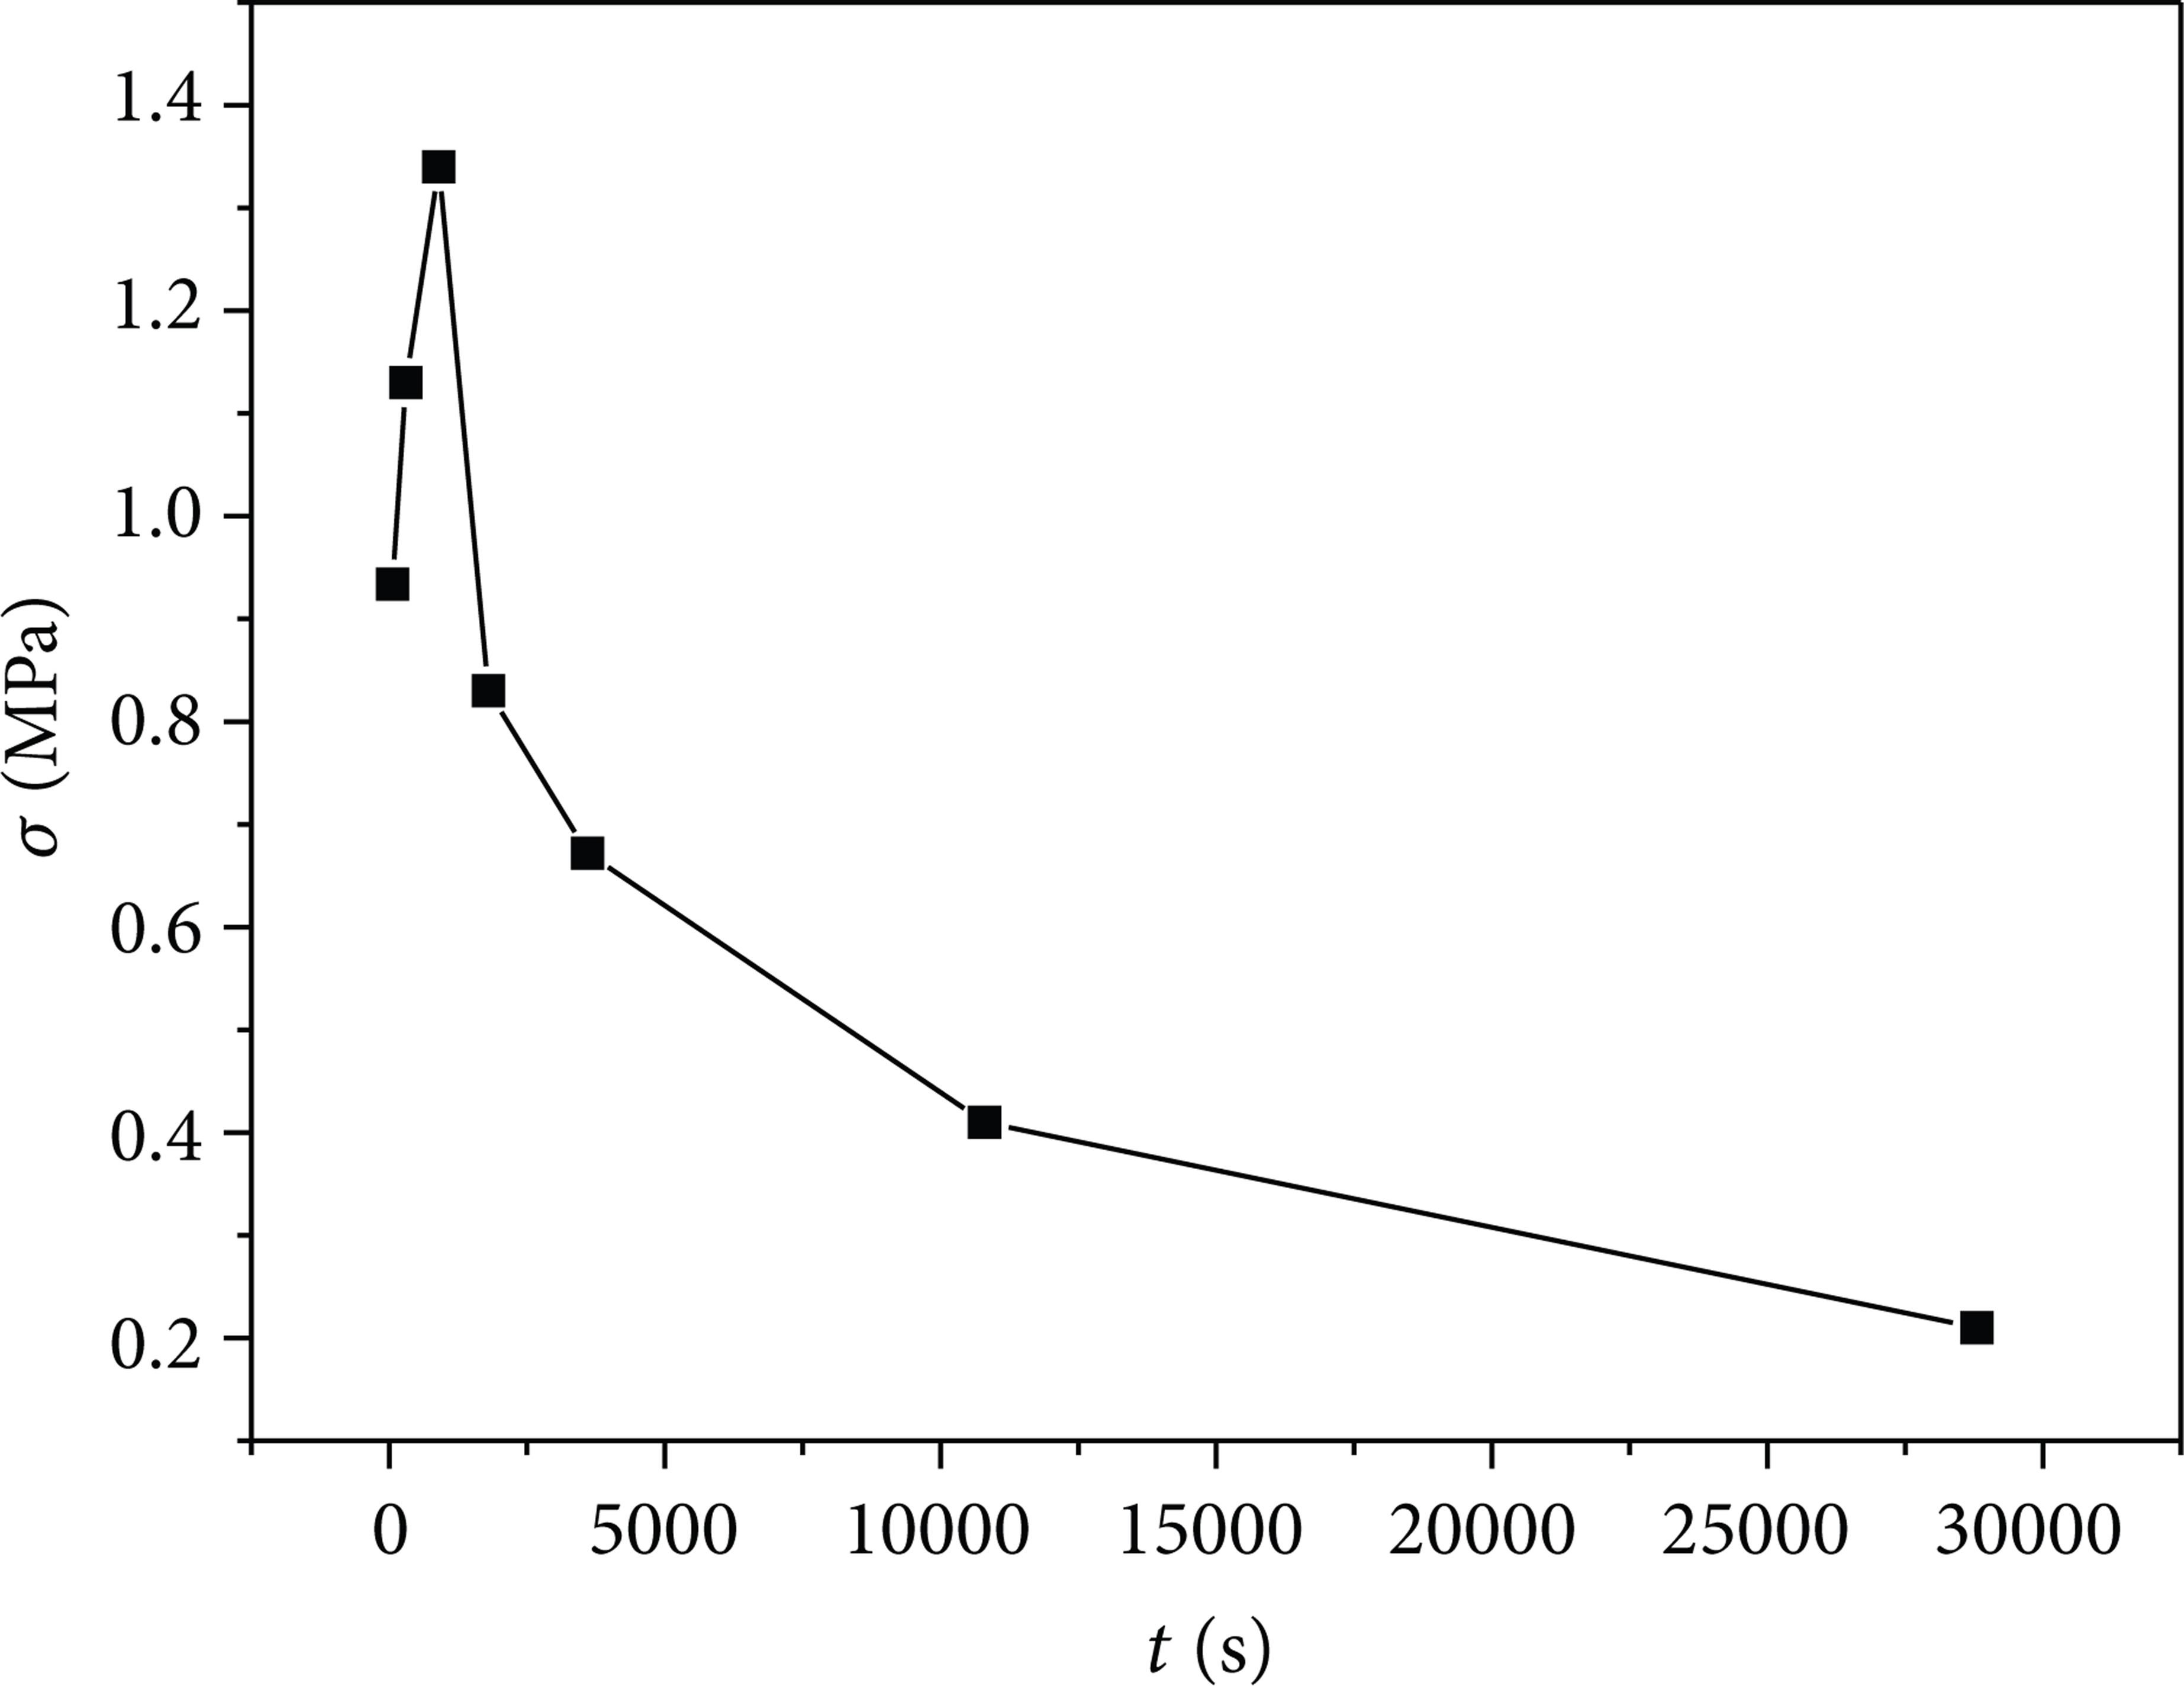
Residual stress variation of conversion film at different formation times.
4. Conclusions
The initial formation process of conversion films is mainly the dissolution process of magnesium alloy substrate and the chelate reaction process of phytic acid and magnesium alloy. With the increase of film formation time, conversion films on magnesium alloy gradually become dense, roughness reduces, and substrate gradually decreases. The residual stress leads to gradual cracking in film surface, and the residual stress is released, the surface roughness increases, and mechanical property decreases. In film formation process, the corrosion property of film also changes with the quality of film, first increases and then decreases. Therefore, the determination of residual stress and cracking time is the key factor to optimize preparation techniques and control film quality.
Footnotes
Acknowledgments
This work is financially supported by National Basic Research Program of China (973 Program) (no. 2011CB013404), National Natural Science Foundation of China (nos. 51275105 and 51375106), Fundamental Research Funds for the Central Universities (no. HEUCF20130910003), and Foundation of Heilongjiang (nos. QC2010108 and E201026).