
Abstract
Transportation safety is one of the most important applications of vehicular ad hoc networks which is based on IEEE 802.11p. When a vehicle is in an emergency situation, a safety-related message is transmitted to the neighboring vehicles and infrastructures. Vehicles and infrastructures exchange periodic messages on vehicle position, traffic information, and so forth to provide various services. When the traffic load is very high, the emergency message cannot be delivered immediately. To overcome this situation, a priority-based transmission scheme is considered to guarantee the transmission of the emergency message. In this paper, the performance of vehicular communication networks is analyzed in two perspectives. Firstly, an analytical Markov chain model for vehicle-to-vehicle (V2V) ad hoc communication networks is proposed for broadcasting messages with priority based on the IEEE 802.11p wireless access for vehicular environments (WAVE) standard. Secondly, an analytic queuing model for vehicular communication networks is proposed to evaluate the network performance to deal with safety and nonsafety messages.
1. Introduction
In the intelligent transportation systems (ITS), wireless communication technology is one of the most important means for communicating between the fast moving vehicles to guarantee traffic safety. ITS can support several services for traffic safety [1, 2]. Emergency message transmission and vehicle information collection services are fundamental elements for providing traffic safety-related services. Some emergency messages are disseminated to announce emergency situations, such as traffic accidents and abnormal conditions of a vehicle, to the neighboring vehicles and other infrastructure. These messages are essential for preventing and dealing with traffic accidents promptly.
To activate traffic safety services, each vehicle needs to transmit its location and speed periodically in real time. In addition to this, emergency messages must reach the following vehicles in a certain area. These messages might occur rarely because they are event driven in incident situations. These event-driven messages can be delivered directly to neighboring vehicles or indirectly through the installed infrastructure. Figure 1 shows the reference network model for the vehicular communication.

Reference network model for vehicular communication.
In ITS, safety and nonsafety applications are provided at the same time. In order to provide a nonsafety application such as road traffic information, an on-board unit (OBU) installed in a vehicle transmits the vehicle's driving status. The information is collected by a roadside unit (RSU) and the RSU transmits it to the traffic control center periodically. A vehicle broadcasts its position information in the form of wave short message (WSM) in the IEEE 802.11p wireless access for vehicular environments (WAVE) standard [3–5].
A variety of researches on the performance of IEEE 802.11 has been studied. There are Markov chain models for saturated and nonsaturated traffic situations [6–9]. Enhanced distributed channel access (EDCA) models are proposed in [10, 11] with a priority scheme. There are also various kinds of queuing models [12, 13]. However, the research on the modeling of WAVE communication systems is rare especially for vehicle-to-vehicle (V2V) networks combined with infrastructures. For an accurate performance analysis of the IEEE 802.11p WAVE standard, we need to model V2V networks combined with infrastructures that exchange safety and nonsafety messages with different priorities.
The nonsafety-related services will be provided at normal times. So, the data traffic between the vehicles and infrastructure will also increase proportionally with the number of vehicles in the network. In this situation, the safety-related emergency messages cannot be delivered immediately due to high traffic. To avoid this situation, we need to prioritize according to the message content. When we assign a high priority to safety-related messages, the reception rate of the safety-related messages can be improved. However, the rate will decrease as the number of vehicles increases, since the amount of nonsafety-related messages increases. Therefore, we need to evaluate the communication performance of vehicular networks in terms of the number of vehicles and the amount of nonsafety-related traffic when the safety- and nonsafety-related messages coexist.
This paper proposes a Markov chain model and a queuing model to analyze the network performance of vehicular communication systems dealing with safety and nonsafety messages with priority. The proposed models are useful for analyzing the performance of the vehicular communication network to provide priority services.
This paper is structured as follows. Section 2 describes the modeling of V2V communication networks to provide priority services. Section 3 describes the modeling of infra-cooperative transmission to provide priority services. The performances of V2V and infra-cooperative transmission are evaluated in Section 4 through computer simulations. Finally, Section 5 concludes the paper.
2. Modeling of Vehicle-to-Vehicle Communication
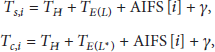
Ad hoc networks are usually demanded for the V2V communication with highly dynamic topologies and a stringent delay requirement [14]. A vehicle broadcasts its position information in IEEE 802.11p WAVE messages [2]. The medium access control (MAC) protocol for vehicular ad hoc networks is the carrier sense multiple access with collision avoidance (CSMA/CA) with the binary exponential backoff algorithm. And the EDCA specified in IEEE 802.11e is used to support the MAC transmission priority because applications have priority levels depending on the message. The prioritization of transmission in EDCA is implemented by the arbitration interframe spacing (AIFS), which can be considered as an extension of the backoff procedure [14].
In this paper, the priorities of the broadcasting messages are considered. For the sake of simplicity, the channel switching was not considered between the control and service channels. Assume that any queue in any station always has frames ready to send. Let
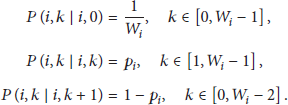

Markov chain state transition diagram of the broadcast messages with priority.
From (2), we have

Transmission occurs when the backoff counter value is zero. Let


The normalized system throughput,

3. Modeling of Infrastructure-to-Infrastructure Communications
An RSU transfers safety and nonsafety messages to the traffic management center after receiving messages from OBUs in neighboring vehicles. In this section, the network performance is analyzed and examined when the delivered messages have different priorities. This section considers a scenario that the originator generates an emergency message. The RSU connected to the originator gathers information from OBUs installed in neighboring vehicles periodically. The RSU receives an emergency message from the originator and then informs it to the traffic management center and other neighboring RSUs so that all the vehicles in a certain area can understand the situation. Only two RSUs were considered for analytical simplicity. The analysis can be extended to multiple RSUs in the same manner.
In Figure 1, A, B, and C show the V2V transmission of safety messages, the vehicle-to-infrastructure (V2I) transmission of safety and nonsafety messages, and the infrastructure-to-infrastructure (I2I) transmission of safety messages generated at the neighboring RSUs, respectively. In Figure 1, D and E denote the infrastructure-to-control center (I2C) transmission of nonsafety and safety messages and the V2I transmission of safety and nonsafety messages, respectively. RSU 1 receives periodic vehicle information and the emergency events from the OBUs. RSU 2 then transfers the messages to the traffic management center or neighboring RSUs. Emergency events are transmitted before the transmission of nonsafety messages due to the higher priority. RSU 2 also receives periodic vehicle information and emergency events from the neighboring OBUs. RSU 2 broadcasts the emergency messages transmitted from RSU 1 as well as the events received from the neighboring OBUs. In RSU 2, safety messages are given the highest priority [15–17].
Consider the network performance of the infrastructure cooperative transmission using I2I communications in hybrid communication architectures. The network model for vehicles and RSUs is shown in Figure 1. An environment with two RSUs can be represented by the queuing network model, as shown in Figure 3.

Queuing network model of the environments of the two RSUs.
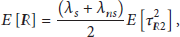
RSU 1 models the first RSU with the arrival rate of emergency events,

The queue at the relay RSU shows the traffic for safety messages using infrastructure cooperative communication.

Consider the network performance of the infrastructure cooperative transmission using the I2I communications in hybrid communication architectures. An environment with two RSUs can be represented by the queuing network model, as shown in Figure 3.
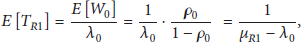
The mean waiting time of the highest priority message is denoted by
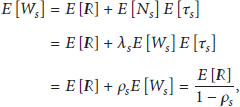
The RSU transmits a nonsafety message after the residual service time and assigned time for safety messages. Therefore, the mean waiting time in the queue for nonsafety messages,


The mean delay times for the safety messages and nonsafety messages are expressed as

4. Performance Evaluation
In this section, we verify the results obtained in Sections 2 and 3 through computer simulations. In addition, the performances of IEEE 802.11p WAVE standard are evaluated in V2V and I2I communication conditions.
4.1. V2V Communications
We assume that every vehicle sends its location information to neighboring vehicles and RSUs in every 100 ms. Vehicles are exchanging multimedia and nonsafety messages between neighboring vehicles or RSUs. We focus on the saturation performance of V2V communication in this section. To validate the proposed analytical model, we compare the analytical results with simulation results by the implementation of IEEE 802.11p WAVE standard using ns-2 simulator. For simulations, four types of traffic priority classes were considered without loss of generality. All the parameters used in the analytical model and in the computer simulation are the same as defined in IEEE 802.11p and shown in Table 1.
Parameters for IEEE 802.11p.

The safety messages were assumed to use priority class 0 and the nonsafety messages use priority class 1, class 2, and class 3. Priority classes 0–3 have the following parameters:
Figures 4 and 5 show the normalized throughput and end-to-end delay, respectively, for four priority classes 0 to 3. Figure 4 compares numerical throughputs of the analytical model with simulations. The packet collision will not happen when there is only one vehicle. However, the channel will be in an idle state during the random backoff. When the number of vehicles is more than two, the throughput will be increased since the possibility to occupy the channel by a vehicle will also be increased while others in random backoff conditions. However, the throughput will be reduced when the number of vehicles is over a threshold due to the increased packet collision probability. Figure 5 compares the end-to-end delay of the analytical model with simulations. As the number of vehicles increases, the end-to-end delay is over 100 ms for the nonsafety messages with lower priority. On the other hand, the delay is less than 30 ms for the safety messages of higher priority regardless of the number of vehicles. The proposed model corresponds relatively well with the outcome of the simulations.
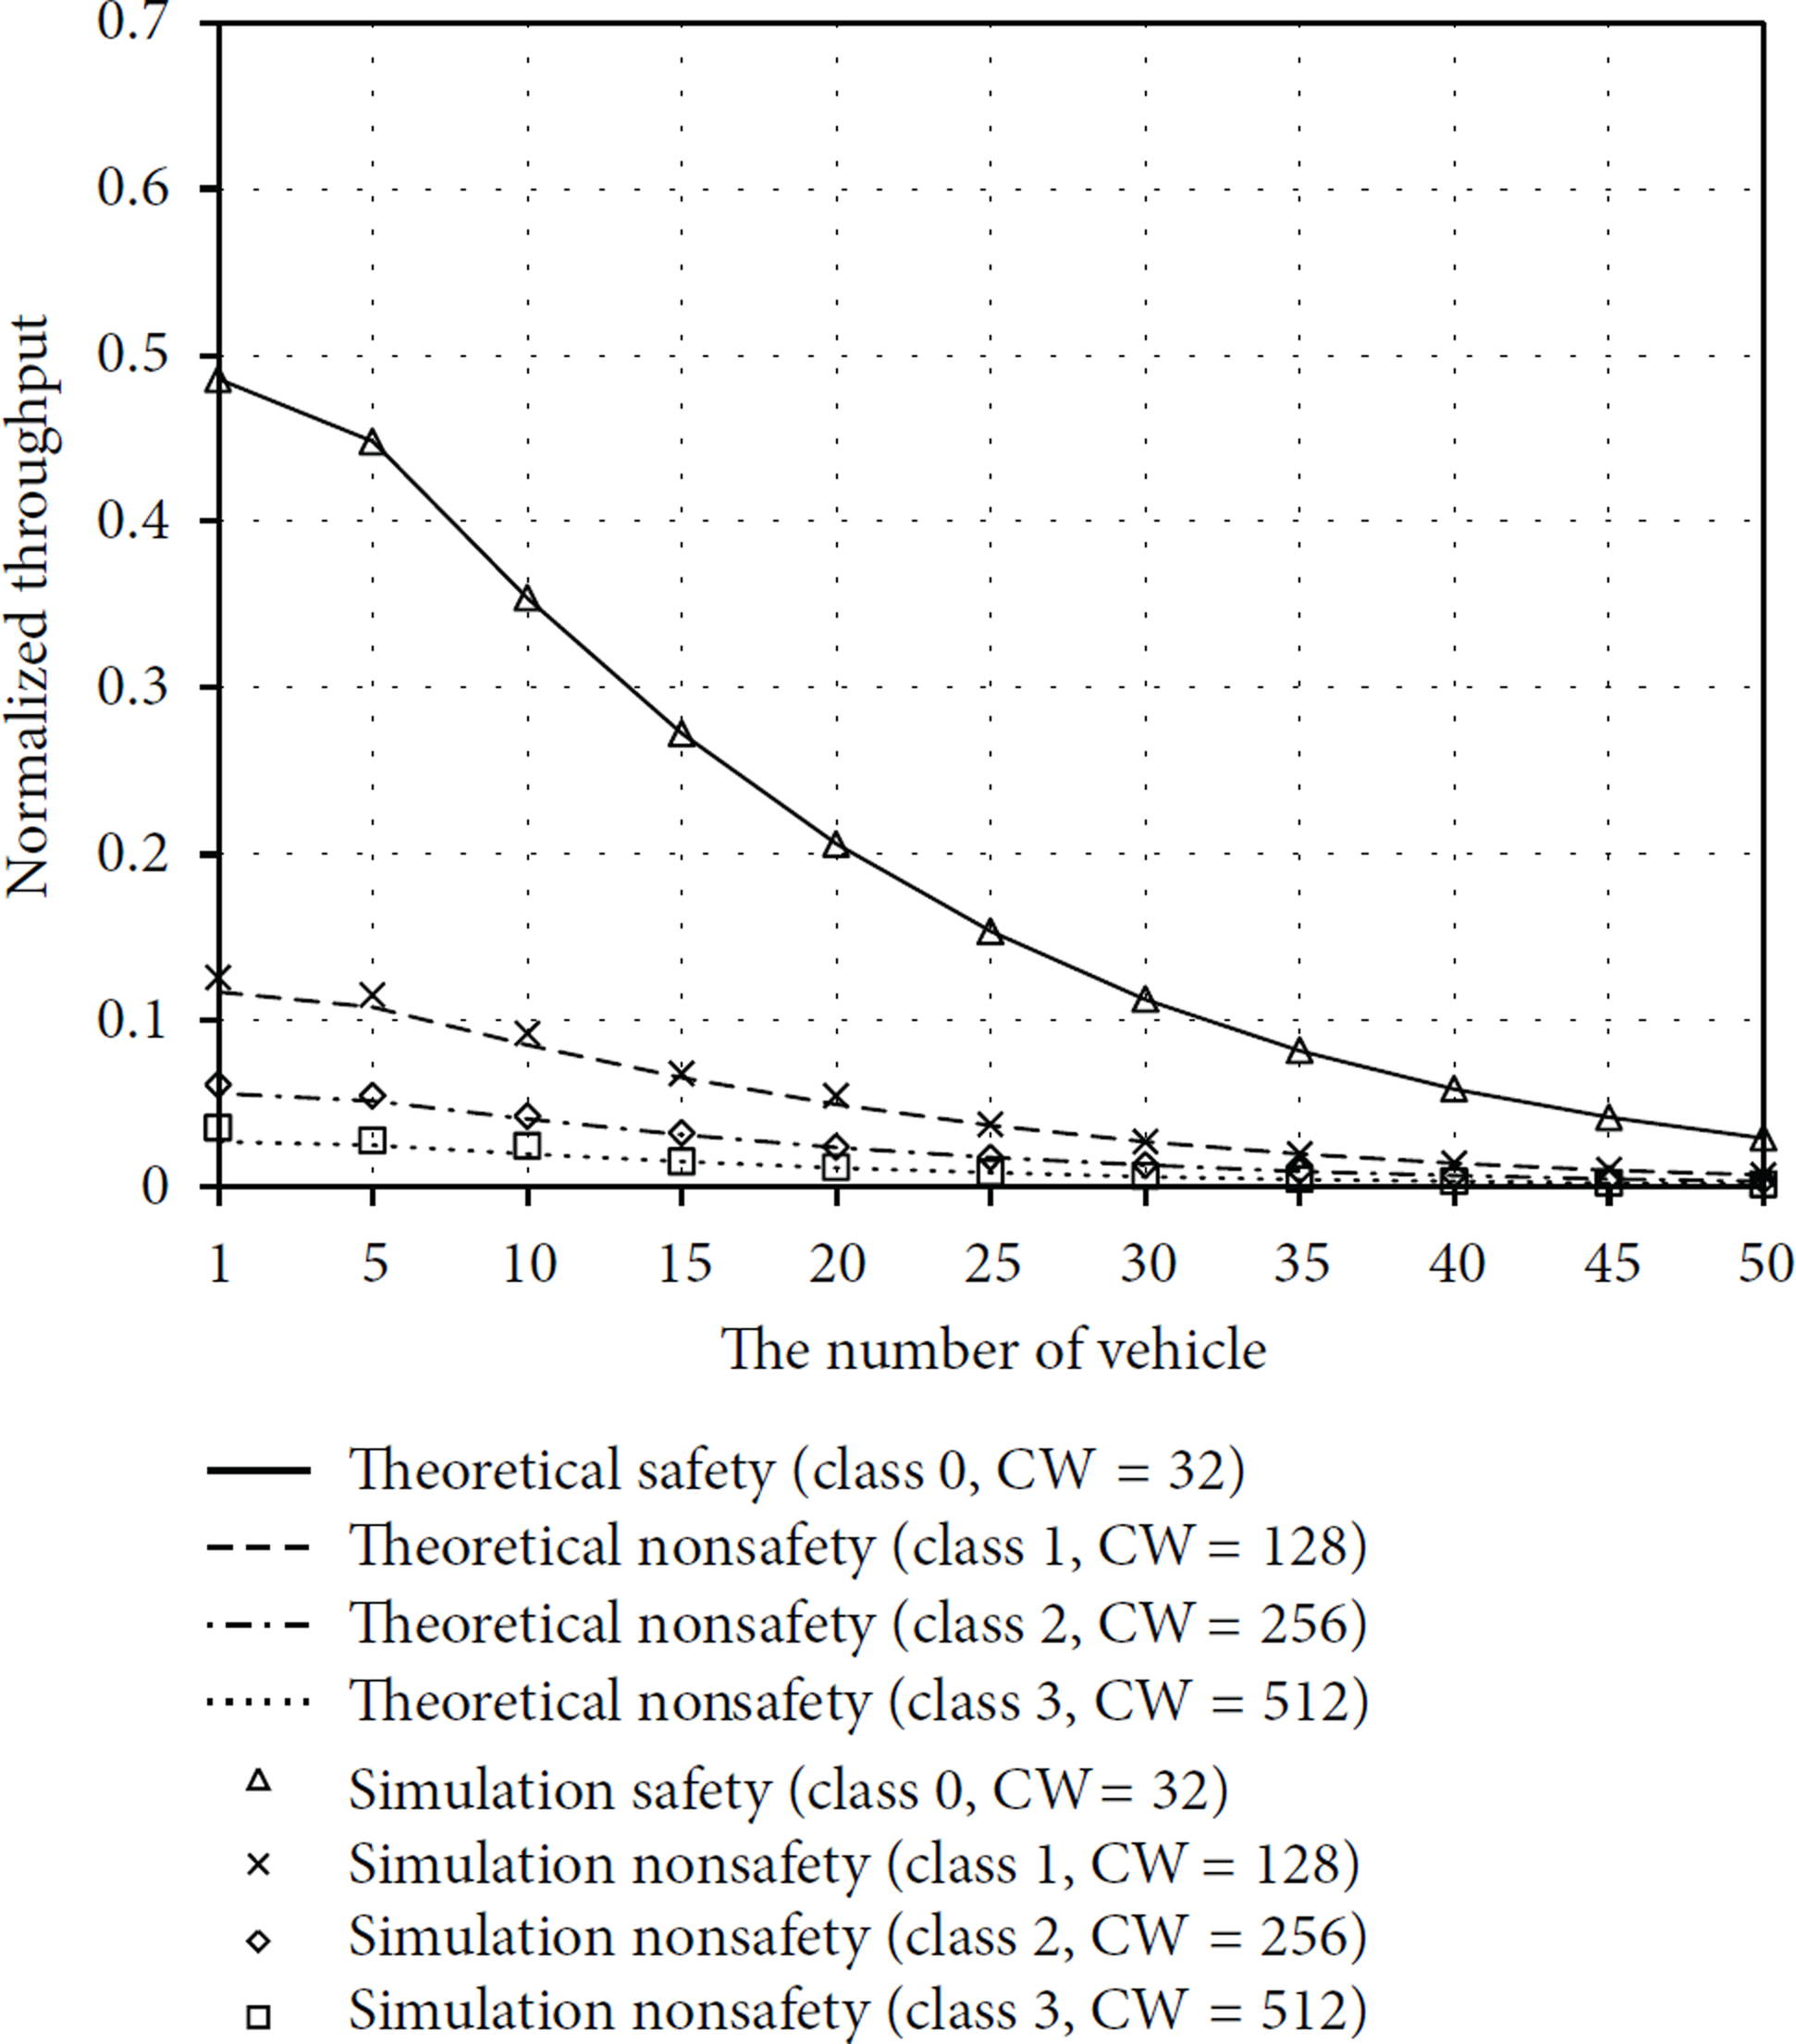
Normalized throughput.
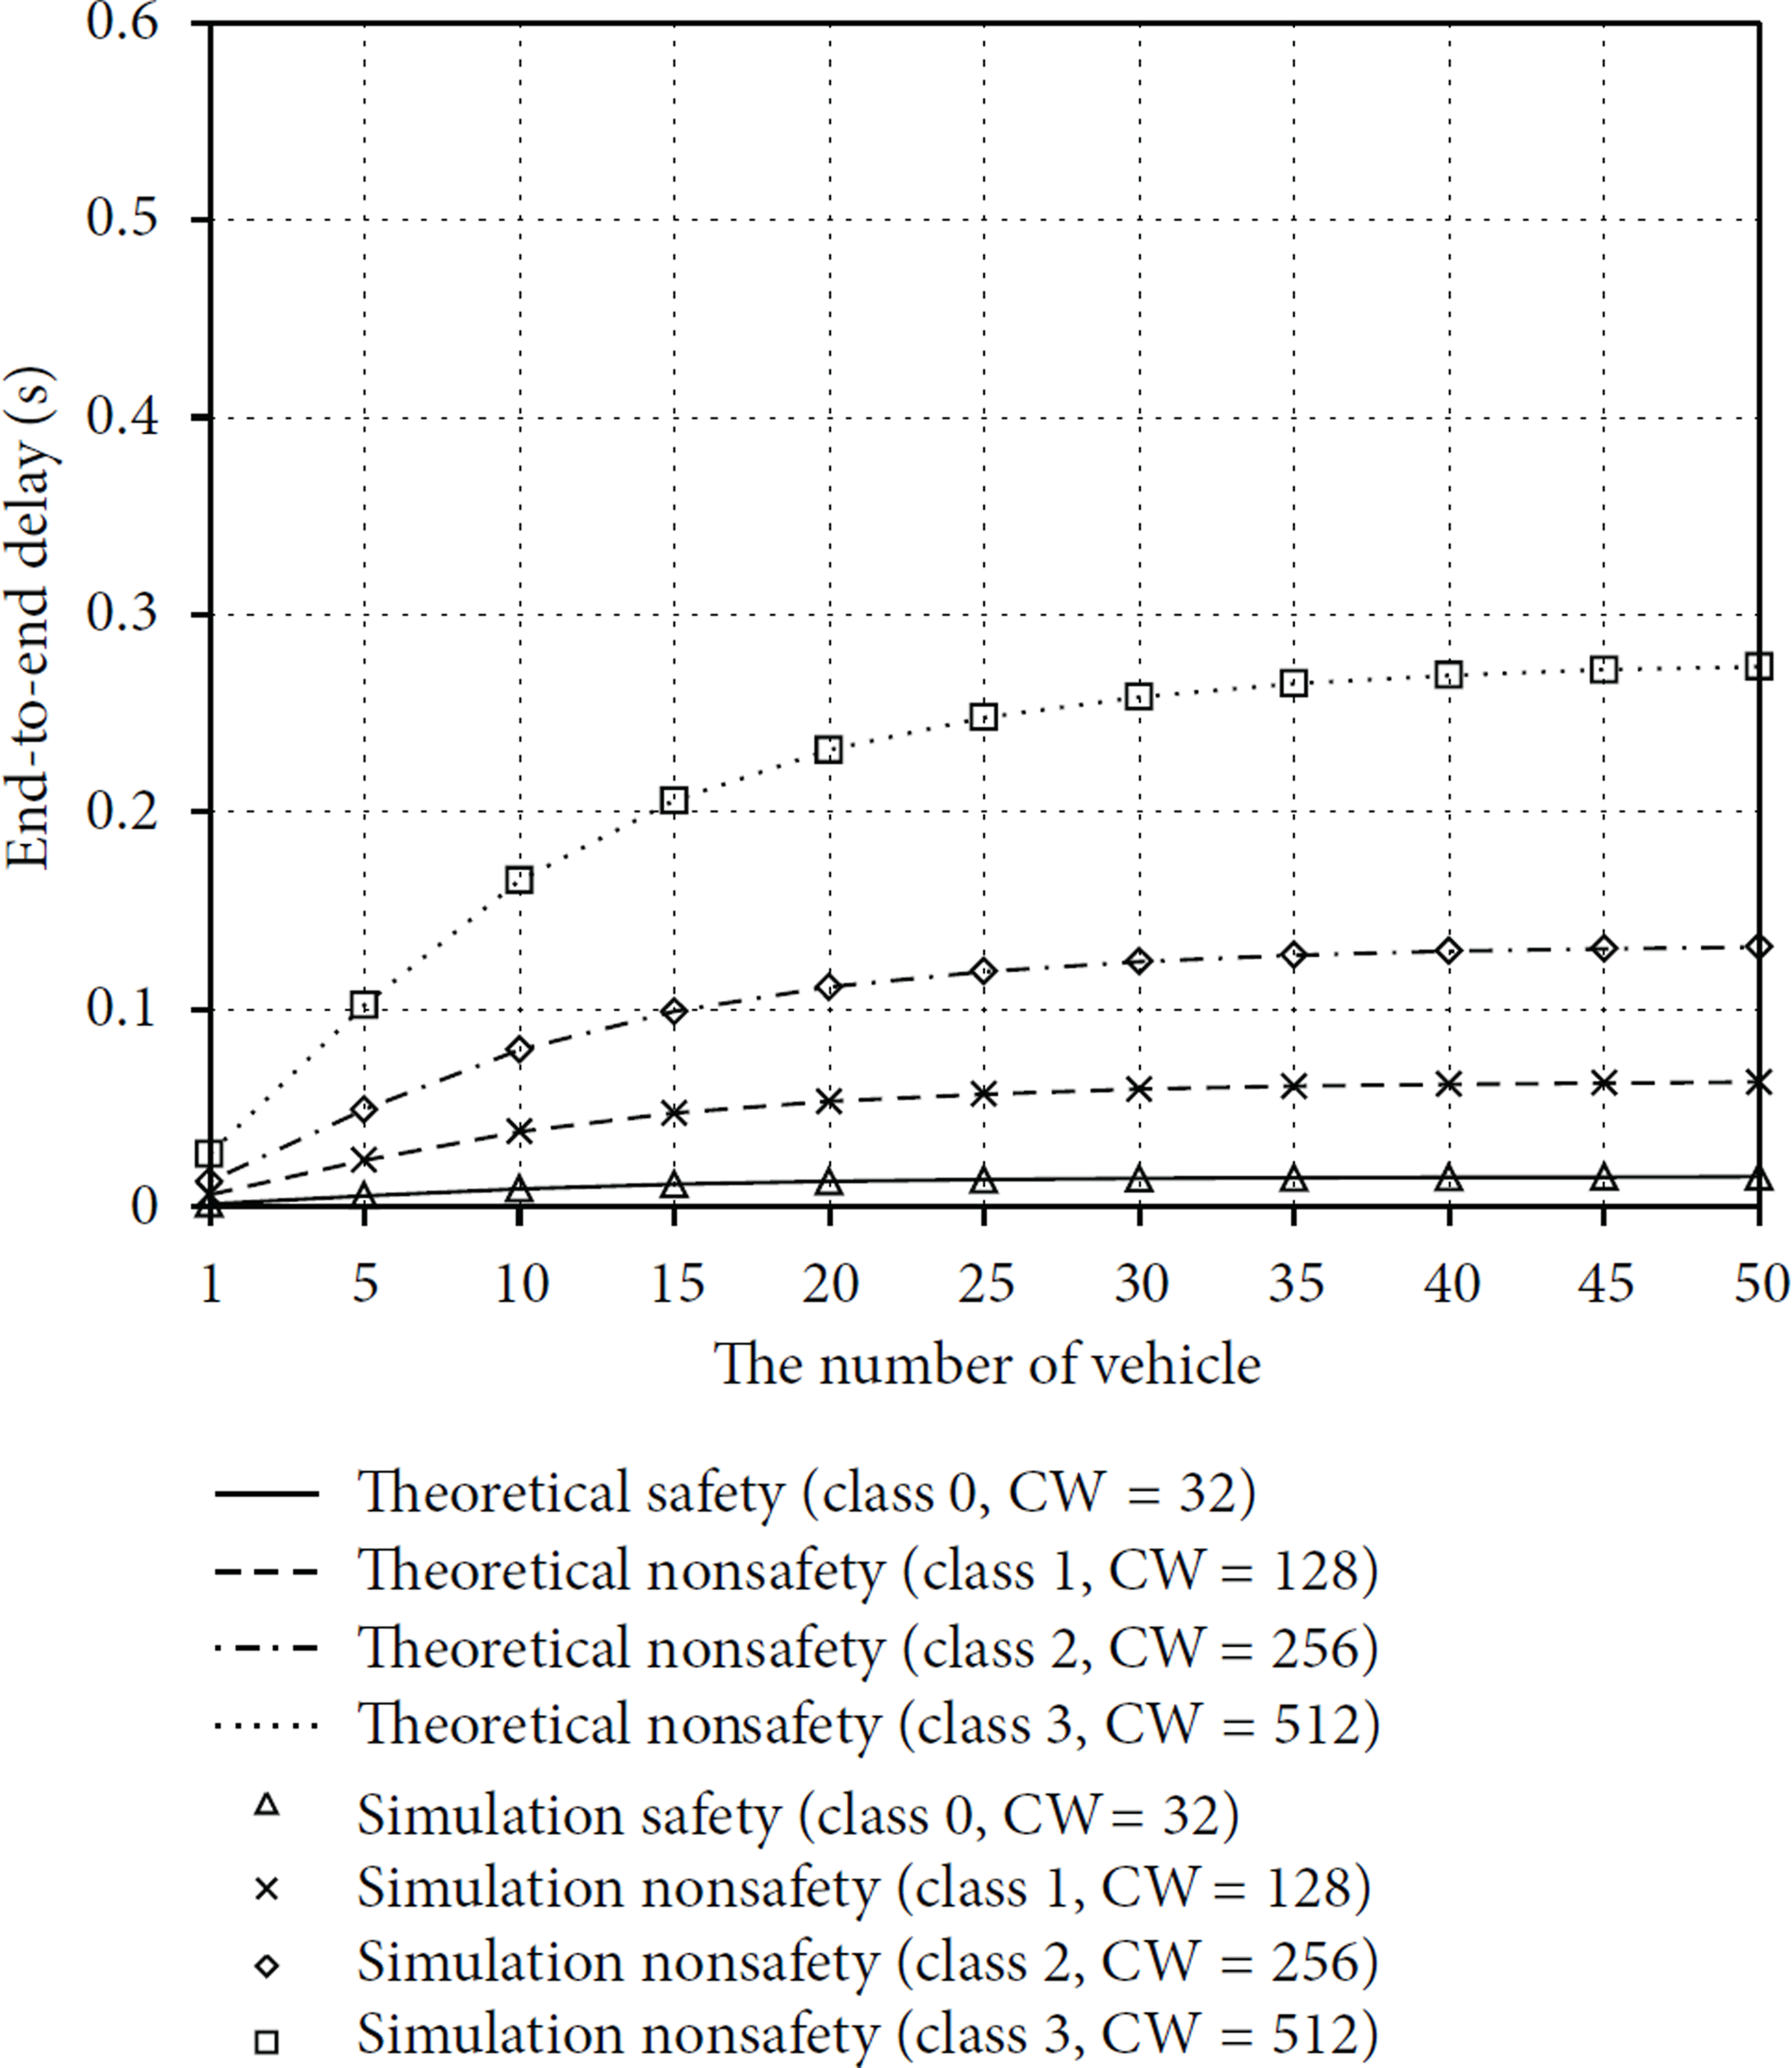
End-to-end delay.
The packet delivery ratio is defined as the ratio of the number of packets successfully received by the RSU to the number of packets transmitted by OBUs. Figures 6(a) and 6(b) show the packet delivery ratio for priority class 0 and priority class 2, respectively. We use the solid lines to refer to theoretical results using 32 and 64 for the safety message contention windows in Figures 6(a) and 6(b), respectively. And we use the dashed lines to refer to theoretical results. We can see that the analytical results perfectly match the simulation results. Increasing the window size of nonsafety vehicles helps the improvement of the packet delivery ratio due to a decrease in the overall channel load. The packet delivery ratio of vehicles to transmit the safety and nonsafety messages is almost the same.

Packet delivery ratio with different contention window size.
4.2. I2I Communications
The simulation was performed to validate the analytic models for channel utilization and queuing delay. The network topology is the same as the reference network model for the infrastructure cooperative transmission, as shown in Figure 1. We consider the I2I communications with the IEEE 802.11g standard. Considering the coverage, the interval between infrastructures and the data rate are assumed as 500 m and 27 Mbps, respectively. Each generation rate of messages from a vehicle is assumed to be a Poisson traffic source with some priority level, and the message size (including overhead) is distributed exponentially. The parameters used for the simulation are listed in Table 2. In this simulation, two types of priority class traffic were considered.
Simulation parameters for the queuing network model.

Figures 7(a) and 7(b) show the channel utilization and end-to-end delay in the RSU 1. In this simulation, we consider two types of priority classes. The channel utilization of the high priority traffic increases linearly because it is not affected by the transmission of lower priority traffic. We can see that the end-to-end delay sharply increases when the traffic load is highly offered. The channel utilization is decreased to zero for the nonsafety messages of lower priority as the traffic is beyond an allowed level. In this case, the channel is given to the safety messages of higher priority.

Network performance in the RSU 1 (
Figures 8 and 9 show the channel utilization and end-to-end delay in the RSU 2 with two priorities, respectively. Figure 8 shows the communication performance of the RSU 2 when the safety messages are sent from RSU 1 with

Network performance in the RSU 2 (

Network performance in the RSU 2 (
Figure 10 shows the mean queue length on the RSU 2. In this simulation, two types of priority classes were considered. The mean queue length decreases when the service rate of RSU 2 increases. These figures suggest that the proposed analytical model is quite accurate.
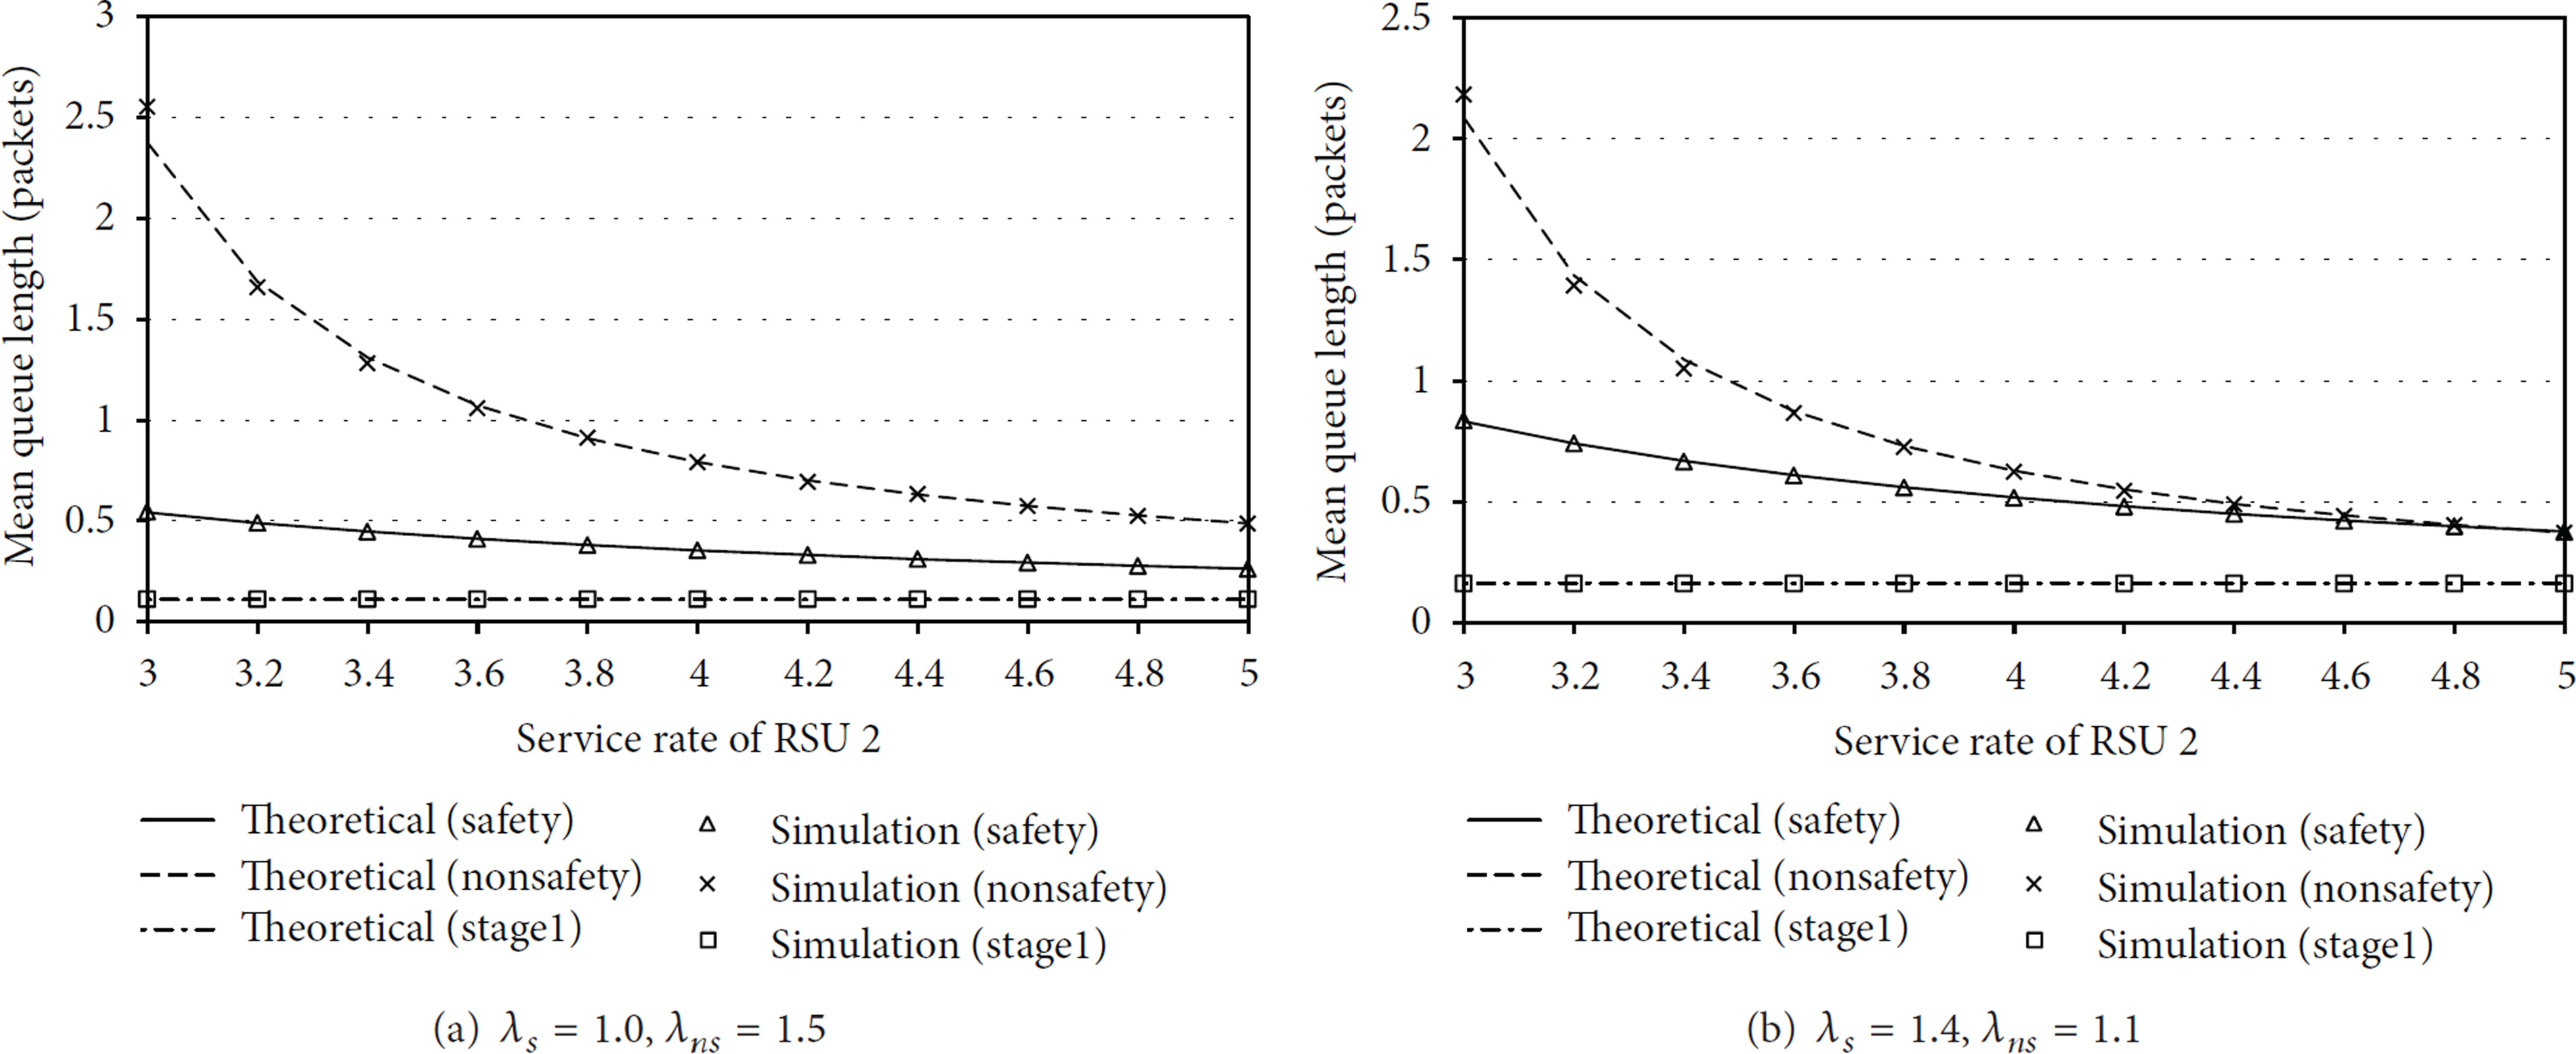
Mean queue length in the RSU 2 (
5. Conclusion
This paper proposed two analytical models for vehicular communication network to process safety and nonsafety messages simultaneously. A Markov chain model was proposed to evaluate the communication performance of V2V. Another queuing model was proposed to evaluate the network performance in infra-cooperative communication networks. From these analyses, the throughput, channel utilization, and end-to-end delay were evaluated. The analytical models matched precisely the computer simulation. Therefore, these models can be used to estimate the performance of vehicular communication networks to provide priority services.
Footnotes
Acknowledgments
This research was supported by the Ministry of Science, ICT & Future Planning (MSIP), Korea, under the Convergence Information Technology Research Center (CITRC) support program (NIPA-2013-H0401-13-1005) supervised by the National IT Industry Promotion Agency (NIPA). This paper is the extended version of the paper presented at the Fifth International Conference on Ubiquitous and Future Networks (ICUFN).