
Abstract
Massive events can be produced today because of the rapid development of the Internet of Things (IoT). Complex event processing, which can be used to extract high-level patterns from raw data, has become an essential part of the IoT middleware. Prediction analytics is an important technology in supporting proactive complex event processing. In this paper, we propose the use of dynamic Bayesian model averaging to develop a high-accuracy prediction analytic method for large-scale IoT application. This method, which is based on a new multilayered adaptive dynamic Bayesian network model, uses Gaussian mixture models and expectation-maximization inference for basic Bayesian prediction. Bayesian model averaging is implemented by using Markov chain Monte Carlo approximation, and a novel dynamic Bayesian model averaging method is proposed based on event context clustering. Simulation experiments show that the proposed prediction analytic method has better accuracy compared to traditional methods. Moreover, the proposed method exhibits acceptable performance when implemented in large-scale IoT applications.
1. Introduction
The Internet of Things (IoT) is a novel paradigm that aims to bridge the gap between the physical world and its representation in the digital world. IoT is expected to become an integrated part of the Internet in the future. IoT is defined as a dynamic global network infrastructure with self-configuring capabilities based on standard and interoperable communication protocols. Bandwidth and storage are no longer considered restricting factors in IoT applications because of the rapid development of novel information and communication technologies. The main issue is how to process the massive events produced by IoT applications, such as the possibility of processing incomplete data streams and historical data from various data sources.
In a large-scale IoT application, the system must process events that arrive from various sources. Such sources include sensors, which constitute the wireless sensor networks, radio-frequency identification (RFID) readers, global positioning systems (GPS), and social media. The events that are directly generated by RFID readers or sensors are primitive events. The semantic information inside primitive events is quite limited. Thus, only simple information can be obtained from primitive events. In real-life applications, people give more attention to higher-level information, such as business logic and rules. For example, each reading operation of an RFID reader at a garage generates a primitive event. However, the user is actually concerned with a complex event such as “the car leaves the garage.” Numerous primitive events have to be combined according to certain rules to obtain such complex event. An IoT application system converts business logic into complex events and then detects business logic on the basis of the detected complex events. Complex event processing (CEP) [1] is used to process huge primitive events to obtain valuable information. As an example, in logistics industry, CEP is used to track the goods and trigger some actions when an exception is found.
CEP in active databases has been studied extensively and has recently become a popular research area because of the rapid development of IoT. Most CEP methods assume that the data are deterministic. However, events are imprecise in several real-time IoT applications because of a number of factors, such as limitation of measuring accuracy, signal disturbance, or privacy protection. The uncertainty is usually treated as probabilities. Therefore, the event processing engine must be capable of supporting probability.
In certain IoT applications, actions can be executed to change the state of the system. Most of these event processing methods are reactive, which indicates that the action is triggered by the state change of the system. A proactive event processing system has the ability to mitigate or eliminate undesired future events or to identify and take advantage of future opportunities by applying prediction and automated decision-making technologies [2]. For example, in a transportation IoT, we can predict a number of congestion states and then perform a number of actions to avoid the congestion states. Figure 1 shows a proactive event processing system in the IoT. The most important part of proactive event processing is predictive analytics (PA), which analyzes historical data to generate predictions regarding a future event.

Proactive event processing in IoT.
PA applies several statistical and data mining techniques, such as clustering, classification, and regression. The Bayesian network (BN) [3] and its variations, such as dynamic Bayesian network (DBN) [4] and adaptive Bayesian network (ABN) [5], are extensively used in PA. Bayesian model averaging (BMA) [6] technology, which can average a great number of different competing models to help account for the uncertainty inherent in the model selection process, is also used in PA. When processing massive events in large-scale IoT applications, the performance of PA with BN and BMA is restricted by the challenges posed by big data. In 2012, “Big data” was recognized as one of the three leading edge technology trends that a CEO cannot overlook [7]. Big data can be characterized by volume, velocity, variety, and veracity (“data in doubt”). IoT is one of the most important areas in which big data must be processed. However, most of the existing PA algorithms cannot directly process the big data from IoT. Furthermore, IoT applications, particularly proactive event processing systems, require high-performance PA because such applications have to perform an action at an exact time. To date, few papers have reported on how to integrate CEP and PA to support proactive event-driven systems.
In this paper, we propose a predictive analytics method based on Bayesian model averaging (PABMA). This method can support proactive event processing in large-scale IoT applications. DBN can be created by employing probabilistic CEP. Consequently, basic predictive analytic method is proposed. A model comparison method for BMA is proposed to address the model uncertainty issue. A novel context clustering-based data partitioning and model selecting method is also proposed. The remainder of this paper is organized as follows. In Section 2, we provide a general review of related works on CEP, PA, and BMA technologies. In Section 3, we describe the event context model of our work. The PABMA method is described in detail in Section 4. In Section 5, we present the experiments we conducted to test PABMA. Finally, the discussion and conclusion are presented in Section 6.
2. Related Work
2.1. Complex Event Processing
CEP detects complex events on the basis of a set/sequence of occurrences of single events by continuously monitoring the event stream and then reacting to detected situations. Etzion and Niblett defined the basic concept and architecture of CEP [8] in their book. Event processing agent (EPA) is a component that applies logic on a set of input events to generate a set of complex events as output. Event processing network (EPN) is a network of a collection of EPAs, event producers, and event consumers linked by channels. The network is used to describe the event processing flow execution. Luckman first introduced EPN in the field of modeling [1]. The main idea of complex event detection consists of four steps: (1) primitive events are extracted from large volume data; (2) event correlation or event aggregation is detected to create a business event with event operators according to specific rules; (3) primitive or composite events are processed to extract their time, causal, hierarchical, and other semantic relationships; and (4) response is sent to the actionable business information because of the guaranteed delivery of events to the subscribers.
The CEP engine must process streams of events with timestamps. Thus, numerous event pattern recognition methods are based on sequential variants of probabilistic graphical models, such as hidden Markov models [9], DBNs [4], and conditional random fields [10]. Methods for detecting complex events in probabilistic event streams based on nondeterministic finite automaton (NFA) have been recently proposed. Xu et al. proposed a data structure called chain instance queues to detect complex events that satisfy query requirements with single scanning probabilistic stream [11]. Conditional probability indexing tree is defined to store conditional probabilities of BN to improve its performance. Kawashima et al. proposed an optimized method for calculating the probability of outputs of compound events and for obtaining the value of confidence of the complex pattern given by the user against uncertain raw input data stream generated by distrustful network devices [12]. The present work is based on CEP and probabilistic CEP.
Proactive applications have been continuously developed in recent years. A number of examples include proactive security systems [13], proactive routing in mobile ad-hoc wireless networks [14], and proactive service level agreement negotiation in service-oriented systems [15]. Engel et al. proposed a proactive event-driven computing framework based on CEP, PA, and Markov decision processes [2, 16]. Engel at al. extended the event processing agent model to include two more types of agents, namely, predictive agents, which may derive future uncertain events based on prediction models, and proactive agents, which compute the best proactive action that should be performed. Proactive CEP requires the prediction of future events or states; such prediction is the main focus of this paper.
2.2. Predictive Analytics with Bayesian Networks
For PA methods based on complex event data, certain attributes of the monitored system can be predicted according to previously monitored events. Such prediction process can be divided into four steps: (1) collect and preprocess raw data; (2) transform preprocessed data into a form that can be easily handled by the (selected) machine learning method; (3) use the transformed data to create the learning model (training); and (4) use the previously created learning model to report predictions to the user. Thus, future events can be predicted by using the recent data on the basis of the learning model trained for previously monitored events.
Bayesian methods are becoming increasingly popular as frameworks for model selection and forecasting tools. Castillo et al. used BN, which considers the random character of the level of the total mean flow and the variability of origin-destination pair flows [17]. Pascale and Nicoli proposed an adaptive BN in which the network topology changes according to the nonstationary characteristics of traffic [18]. In this study, two major stationary areas were recognized as principal phases of traffic flows. Sun et al. modeled traffic flows within adjacent road links in a transportation network as a BN. The joint probability distribution between the cause nodes and the effect node in a constructed BN is described as a Gaussian mixture model (GMM) [19]. Hofleitner et al. used DBN and introduced a model based on hydrodynamic traffic theory to study the density of vehicles on arterial road segments and to illustrate the distribution of delay within a road segment [20]. In contrast to our work, these methods use single BN models and do not consider the massive data from IoT applications.
2.3. Bayesian Model Averaging for Predictive Analytics
Standard data analysts ignore the uncertainty in model selection, resulting in overconfident inferences and decisions that are riskier than they actually seem. The uncertainty inherent in the model selection process is often neglected by traditional statistical analyses. BMA is a technique designed to help account for this uncertainty. By averaging over several different competing models, BMA incorporates the model uncertainty into the conclusions regarding parameters and prediction. The traditional method for BMA is the mixture of experts model [21] proposed by Jacobs et al. In this model, the predictive distribution of various submodels is composed with weight to obtain the predictive distribution of the composed model. The main issue is how to compare and select the models to determine the coefficient of the mixture of expert models.
Model comparison and selection have been recently proposed. Zhou et al. constructed posterior probabilistic properties and model parameters on the basis of sequential Monte Carlo sampling and used these properties to compare different models [22]. With regard to the appropriateness of different genic models to different biological systems, Milias-Argeitis et al. compared and selected Bayesian genic models according to numerous methods, such as annealed importance sampling and approximate Bayesian computation [23]. Karabatsos and Walker proposed a mixed multinomial logit model and presented a Markov chain Monte Carlo (MCMC) algorithm to sample and estimate the posterior distribution of the model parameters [24]. Tawara et al. investigated the effect of the differences of the optimization methods for the multiscale GMM. MCMC-based method was compared with variational Bayesian method in a speaker clustering experiment [25]. Compared with our work, these methods were not optimized for big data from IoT.
3. Event and Context Model for IoT
We present an example of a transporting system based on the IoT to illustrate the event model and the function of the system. The system can obtain information, such as ID, location, and speed, from vehicles by using RFID, radar, GPS, and camera. Other information such as temperature and brightness can be obtained through a wireless sensor network. Through the use of complex events, the system can predict a number of future states (e.g., the congestion state of roads) and then perform actions to support proactive event processing.
Definition 1 (probabilistic primitive event).
A primitive event in a stream indicates an atomic occurrence of interest in time. A probabilistic primitive event is represented by
In the transporting system example, each read operation of the devices generates a primitive event. Sometimes, the primitive event is not certain; for example, two RFID readers may find the same object at the same time. The primitive event may also be uncertain when a car accident is detected through a camera. A probability value is used to represent such uncertainty.
Definition 2 (probabilistic complex event).
A complex event is a combination of primitive events or complex events according to certain rules. A probabilistic complex event is represented by
Definition 3 (event type).
The event type is a specification for a set of event objects that have the same semantic intent and the same structure. Every event object is considered an instance of an event type. An event type can represent either primitive events derived from a producer or complex events produced by an event processing agent.
The main complex event patterns in our work include ALL, ANY, COUNT, and SEQ. In this paper, the COUNT event can be used to represent the number of objects in a specified area during a specified time span. The SEQ event can be used to represent the moving path of an object. The detailed meanings of the patterns can be found in [8]. Such patterns can be employed to create hierarchical complex patterns.
Definition 4 (event context).
An event context is a specification of conditions which groups event instances so that these instances can be processed in a related manner. The event context assigns each event instance to one or more context partitions.
The context types in our work include “event interval,” “fixed location,” and “event distance.” The detailed definitions of these contexts can be found in [8]. As an example, assume context C1 means “within 2 km from the motel M1,” context C2 means “within 10 km from accident A1,” and context C3 means “traffic status of highway is traffic slow” (Traffic in a certain highway has several status values: traffic flowing, traffic slow, and traffic stationary). In this example, C1 is an entity distance context, C2 is an event distance context, and C3 is a state-oriented context. The context representation in our work is based on the fuzzy ontology framework of [16] and optimized for event processing.
Definition 5 (fuzzy ontology).
A fuzzy ontology O in a particular domain Δ is
Definition 6 (fuzzy concept).
A fuzzy concept C is defined as
Definition 7 (concept subsumption).
For two fuzzy concepts
Definition 8 (fuzzy role).
A fuzzy role R is a fuzzy set of binary relations between two objects in the domain. The fuzzy role is interpreted as a set of pairs of objects from the domain denoted by
Definition 9 (fuzzy role subsumption).
For two fuzzy roles
Definition 10 (fuzzy property).
A fuzzy property P is defined as
Concept C is the restriction on the range of the role R in property P. This restriction requires that all objects in the range of R should be a member of the concept C. P is interpreted as a fuzzy set of pairs of fuzzy role and fuzzy object such as
Definition 11 (fuzzy property subsumption).
For two fuzzy property
Definition 12 (fuzzy property with linguistic variable).
A fuzzy property can be represented by
For example, “red car” is a fuzzy concept that subsumes another fuzzy concept, that is, “car.” “Bob extremely likes a sports car” is a relation of a fuzzy role, and the degree of strength of this relation is very high (extremely). The fuzzy property “drive.speed” can be set to
Definition 13 (fuzzy context).
A fuzzy context (FC) is defined as a triple

Definition 14 (fuzzy event context).
A fuzzy event context (FEC) is defined as
The context may change during a complex event. The change in context according to time in a complex event can be modeled by using Definition 12. A part of the traffic domain fuzzy ontology is shown in Figure 2. The concept subsumption is implemented using Definitions 7 and 9. Fuzzy properties with linguistic variables are implemented based on Definitions 10, 11, and 12. The event context can be created and reasoned on the basis of this ontology.

A simplified traffic domain fuzzy ontology.
The fuzzy ontology is represented according to Fuzzy OWL 2 (http://gaia.isti.cnr.it/~straccia/software/FuzzyOWL/), and the ontology reasoning component is created based on Fuzzy DL (http://www.straccia.info/software/fuzzyDL/fuzzyDL.html).
4. Predictive Analytic by Using Bayesian Model Averaging
In this section, we first introduce how to implement PA with single Bayesian model. Then, a Bayesian model averaging method is proposed for multiple Bayesian models. Finally, to address the model selection problem, a dynamic model selection method based on data partitioning is proposed.
4.1. Basic Predictive Analytic Method
A multilayered adaptive dynamic Bayesian network (mADBN) model for predictive analytics is designed, as shown in Figure 3. The model contains a state plane and a set of location planes. Each plane is an ADBN with two dimensions: time and space. Bayesian networks are directed acyclic graphs whose nodes represent random variables and edges represent the conditional dependences among them. In the state plane, the nodes denote the states in different time instants or spatial locations, whereas edges denote the probabilistic relations of the states. The term “dynamic” in mADBN indicates that we are modeling a dynamic system. Figure 3 shows that the state

The mADBN model.
The structure of the state plane can be created by analyzing the object location planes. Conditional probability table (CPT) is used to save and sort the conditional probability that an object proceeds to the next place. CPT is learned from massive historical data using Bayesian formula. First, we select nodes before time t that can affect the state of node
If

The conditional probability

The joint distribution

4.2. Bayesian Model Averaging
For a set of H models, the model ensemble posterior distribution of a quantity Q (e.g., the future model predictions using new input data) given the data D can be expressed as follows:

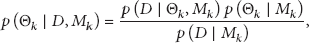
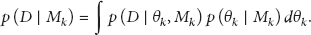
The posterior probability of each model can be calculated as follows:


Thus, the main issue is calculating the integration in (7). According to Gelfand and Dey [28], the model evidence
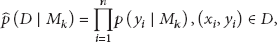

If the model is relatively complex, (11) is difficult to calculate directly. Therefore, MCMC method is used for approximate calculation. We can obtain a series of independent samples

The primary goal in using MCMC method is to find independent series of samples. We use a Markov chain
4.3. Dynamic Model Selection Based on Data Partitioning
Event data, even from the same event type, can be appropriate for different models when the system is in different states. We have proved this by experimentations. In our work, different states of the system can be represented by event context. We partition the event data into classes by using a context-based clustering method and then use the method presented in Section 4.2 to determine the appropriate model averaging for each class. When predicting the state for time t, we partition the data in time
First, we use fuzzy c-means (FCM) method to cluster the historical data. Through iteration process, FCM attempts to determine the cluster center that can minimize the following target function:


In this study, the samples are complex events. Thus, we calculate the sample distance (or similarity) on the basis of the context of the events. As previously described in Section 3, the fuzzy ontology that we used to represent the event context is of hierarchical structure. The similarity between two nodes is defined based on the distance between them in the hierarchical structure.

Here,


Finally, the similarity between

A sample can belong to numerous classes because of the use of fuzzy clustering method. The following librarian criteria are used to adjust the samples that belong to multiple classes.
Librarian Criterion 1 (compactness). Copies of the same book might be placed in different shelves, allowing for multiple classifications. However, the selected classification must minimize the need for multiple copies to reduce costs.
Librarian Criterion 2 (even dimensionality). Books should be evenly distributed in various shelves.
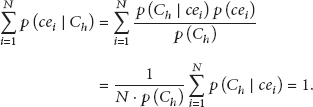
To evaluate compactness, we first calculate the probability that an event context


According to the compactness criterion and the meaning of entropy in information theory, the closer
To evaluate the even dimensionality, according to Bayesian theory, we have

Then, we obtain

Finally, we define the normalized entropy of

We can calculate the average of all
By clustering massive historical data with different granularity, we can compare the model quality of different classes of data and attempt to find the appropriate data partition and corresponding model averaging. When new events are generated, the events are classified into existing classes by using a similar method.
5. Experimental Evaluations
In this section, we report our experimental study on PABMA. A traffic simulation system is developed based on SUMO [29]. In this system, the mobility trace of cars is supported by using an OpenStreetMap [30] road map of a part of Beijing. A great number of “induction loops,” which can detect cars that pass by, are placed on the roads. Virtual RFID or GPS readers are simulated by external applications that use the TraCI interface of SUMO to obtain the induction loop variables. Each induction loop covers a region. The closer a car is to the center of the region, the higher the probability that the event is detected. We select 55 junctions from the map and place 50,000 vehicles into the map. A series of rules is defined to simulate a real-life traffic system. Each vehicle has a home location and an office location. A vehicle
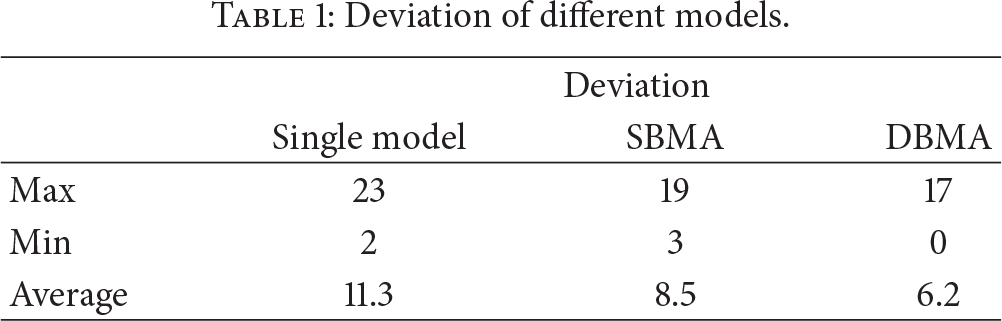
First, we run the simulation several times to obtain the historical data of the vehicle paths. In the first experiment, the accuracy of the PA methods is evaluated, and the result for a typical node is shown in Figure 4 and Table 1. “Single,” “SBMA,” and “DBMA” denote the single Bayesian model (described in Section 4.1), the static BMA model (described in Section 4.2), and the dynamic BMA model (described in Section 4.3). Results show that through model averaging, SBMA exhibits better accuracy than the single BMA model does. DBMA has better accuracy than SBMA because an appropriate model averaging is created for different contexts.
Deviation of different models.
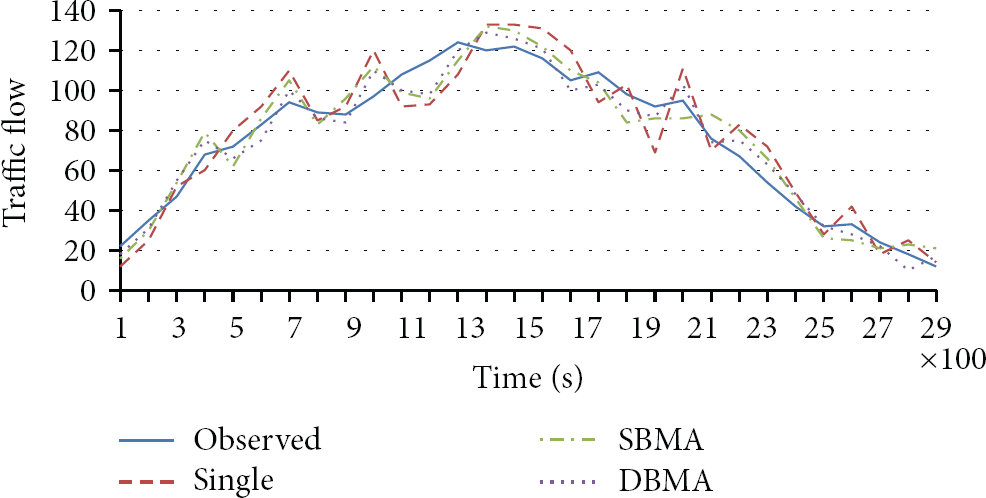
PA accuracy of a typical node.
In the succeeding experiment, the accuracy of SBMA and DBMA with different clustering granularity is evaluated, and the results are shown in Figure 5. Figure 5 shows that the maximum and average deviation decrease when the cluster number increases. However, when the cluster number increases to a certain number (10 in this experiment), the deviation no longer decreases. The reason is that, in certain extent, the increase of cluster number can make the models and clusters match better. The accuracy of the models with the sample data size is also evaluated, and the results are shown in Figure 6. The average deviation decreases when the sample data size increases. However, the decline ceases when the sample data size reaches a certain value (approximately 800 M in this experiment). The DMBA model decreases rapidly compared with the other models, suggesting that the DMBA model requires more training data to obtain better accuracy.

Accuracy for different clustering granularity with DBMA model. The training data size is 800 M, and the model number is 8.

Accuracy for different sample data size. The model number is 8, and the cluster number in DBMA is 10.
In the succeeding experiment, the performance of SBMA and DBMA with different model numbers is evaluated, and the results are shown in Figure 7. Figure 7 shows that the running time of both models increases linearly when the number of models increases. The performance of DBMA is lower than that of SBMA because DBMA has to evaluate models for different contexts. The performance of the three models with different training data sizes is also evaluated, and the results are shown in Figure 8. The running time for all models increases when the training data size increases. However, the running time of SBMA and DBMA increases more rapidly because the calculation becomes more complex. Although DBMA exhibits better accuracy than traditional methods, DBMA also exhibits the worst performance.

Performance for different model numbers. The training data size is 800 M, and the cluster number in DBMA is 10.
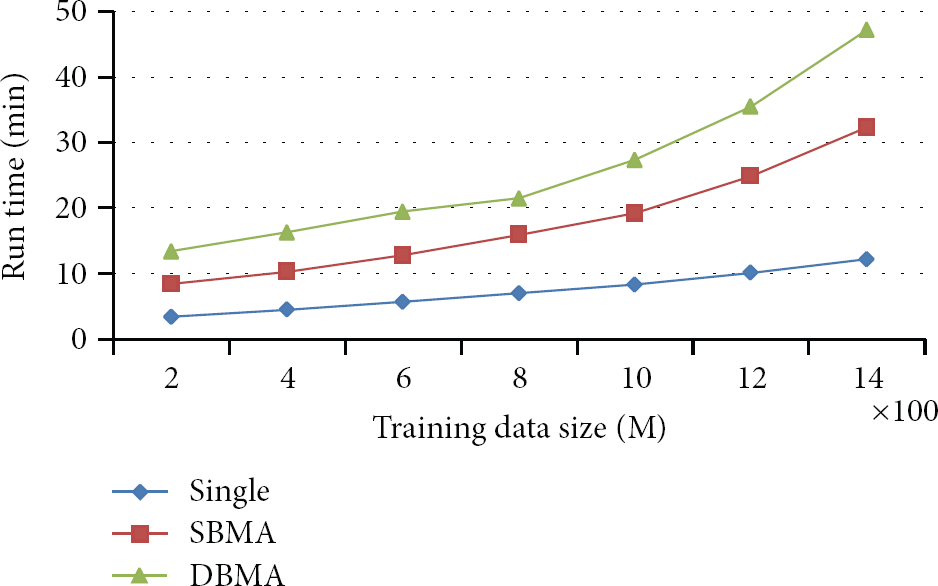
Performance for different training data size. The model number is 8, and the cluster number in DBMA is 10.
All of these experiments show that PABMA outperforms traditional methods for prediction accuracy. However, PMBA requires more training data and running time. This method trains composed Bayesian models according to different event contexts, thereby improving its accuracy. By using GMM with EM inference and MCMC in BMA, the complex calculation problem is resolved. The parallel method is also used in multicontext and multimodel training to improve performance. The performance is acceptable for normal PA applications.
6. Discussion and Conclusion
In this paper, we propose the use of DBMA to develop a high-accuracy PA method for large-scale IoT applications. Based on a multilayered ADBN model, this method uses GMM and EM inference for basic Bayesian prediction. BMA is implemented by using MCMC. DBMA is supported based on context clustering. The experimental evaluations show that this method has better accuracy compared with traditional methods. Moreover, this method exhibits acceptable performance when implemented in large-scale IoT applications.
The performance of PABMA still requires improvement. The current parallel method works only when learning the structure of models and training models for different contexts. EM inference and BMA process are not parallelized yet. In the future, we plan to develop MapReduce algorithms to support massive historical data and complex training process.
Footnotes
Acknowledgments
This project was supported in part by the National Key Technology R&D Program of China (2012BAD35B07 and 2013BAD15B02) and the Hunan Provincial Natural Science Foundation (13JJ3046).