
Abstract
The hinge moment characteristics for ONERA-M6 wing with aileron configuration have been investigated numerically based on the different gaps and deflecting angles. The results show that the effects on the wing made by the deflecting aileron are notable. Comparing with the nonaileron case, the chordwise pressure coefficient distribution for the wing with aileron has shown the totally different trends. The small gap can force the air flow through and form the extremely strong spraying flow. It can directly destroy the previously formed leading edge vortex (LEV). Due to the presence of the positive deflecting angle, the trailing edge vortex (TEV) will begin to generate at the trailing edge of the aileron. The induced secondary LEV will be mixed with the developing TEVs and form the stronger TEVs at the downstream position. Comparing with the subsonic flow, the curve for the supersonic flow has shown a good linear. The corresponding hinge moments are also extremely sensitive to the changing angle of attack, and the slope of curves is also bigger than that of the subsonic flow. The bigger gap and deflecting angle can result in the curve of hinge moment bending upward at high angle of attack. The corresponding pressure cloud and streamlines have also been obtained computationally and analyzed in detail.
1. Introduction
Control surface deflection is one of the most important and difficult issues of the aerodynamic characteristics for the aircraft. For safety and steady flight, these aircraft always rely on active control surfaces, which mainly include leading edge flaps, leading edge vortex (LEV) flaps, trailing edge flaps, and ailerons and trailing edge flaps. However, there are many aerodynamic problems such as shock wave/boundary layer interaction, Reynolds number effects, turbulent boundary layer separation, transition effects on each control surface, and the interaction between the boundary layer and the wakes [1–3].
To better understand the flow physics of control surface aerodynamics, many researchers have conducted the experiments and computations to further investigate these issues. Tamayama et al. [4] used two-dimensional CFD method to investigate the influences of shock wave motion upon aileron hinge moment. The results showed that the imaginary component of the unsteady aileron hinge moment will reach the maximum and positive value when the shock wave oscillates around the midchord on the aileron. The aileron length does not strongly affect the shock wave motions on the aileron if the scale of the shock wave motions is normalized with the aileron length. Soinne [5] had also described the state of designing aerodynamically balanced ailerons with a practical application to commuter aircraft. A modern design method is presented based on the application of CFD computations to determine the aileron aerodynamic data combined with flight mechanical simulations to study the impact on airplane rolling maneuvers and aileron dynamics. The corresponding results have shown that the variation of the tab slot gap size had only a negligible effect on aileron efficiency and hinge moment. The variation of the aileron slot within the allowable production tolerances caused noticeable variations in aileron efficiency and hinge moment. And the increase of the aileron slot gap size steepened the net hinge moment curve and thus increased the wheel forces. Pedreiro et al. [6] had conducted the experiment to investigate the effectiveness of ailerons in the high angle of attack regime in the presence of forebody tangential blowing. The results showed that increasing aileron size beyond a certain limit produces only marginal increase in the capability of generating roll moment. Cross coupling effects on pitch and yaw moments mainly stem from the aileron defection and the combined effects of aileron defection and blowing.
Our present studies mainly focused on the hinge moment characteristics for the ONERA-M6 wing with aileron configuration at subsonic and supersonic flow, respectively. The parameters for the geometry include the different gaps (d) between the main wing and aileron and the different deflecting angles (δ a ). Section 2 will describe the computational approach including the flow configurations. Results will be presented and discussed in Section 3.
2. Flow Configurations and Computational Method
2.1. Hinge Moment Generated by the Deflecting Aileron
The mechanism of the hinge moment (M h ) generated by the deflecting aileron has been shown in Figure 1, which can be written as [7]

where S r is the reference area of the aileron and bA · r represents the mean aerodynamic chord length of the aileron.

The mechanism of the hinge moment.
From the above equation, we can conclude that the size of the hinge moment of the aileron can be mainly determined by the type and shape of the aileron, Mach number (Ma), angle of the attack (α), shaft position (h), and deflection angle (δ a ). Therefore, with the increase of the aerodynamic geometry and flight velocity, the corresponding hinge moment can be enlarged greatly. It will need much more operating force to complete the deflecting motion of the aileron. Currently, the most reliable method is to conduct the corresponding wind tunnel tests and flight experiments. However, these practices are always accompanied with a lot of inevitable problems such as more consumed time and cost efficiency. The computational fluid dynamics (CFD) approach can play a big role in effectively developing the control surfaces and the high lift systems.
2.2. Wind Tunnel Test for the ONERA-M6 Wing and Simulation Setup
As shown in Figure 2, ONERA-M6 wing was tested in a wind tunnel at transonic Mach number (Ma = 0.8395). The Reynolds number was about 11.72 million based on the mean aerodynamic chord. The wind tunnel tests are documented by Schmitt and Charpin [8, 9] in the AGARD Report AR-138 published in 1979.

The physical installation in the wind tunnel and measurement sections.
As shown in Figure 3, currently, the CFD simulation uses the pressure far field condition. The ONERA-M6 wing is a swept, semispan wing with no twist. It uses a symmetric airfoil using the ONERA D section. Table 1 lists these flow conditions. These correspond to a Reynolds number of 11.72 million based on the mean aerodynamic chord of 0.646 meters.
Flow condition and grid dimensions.

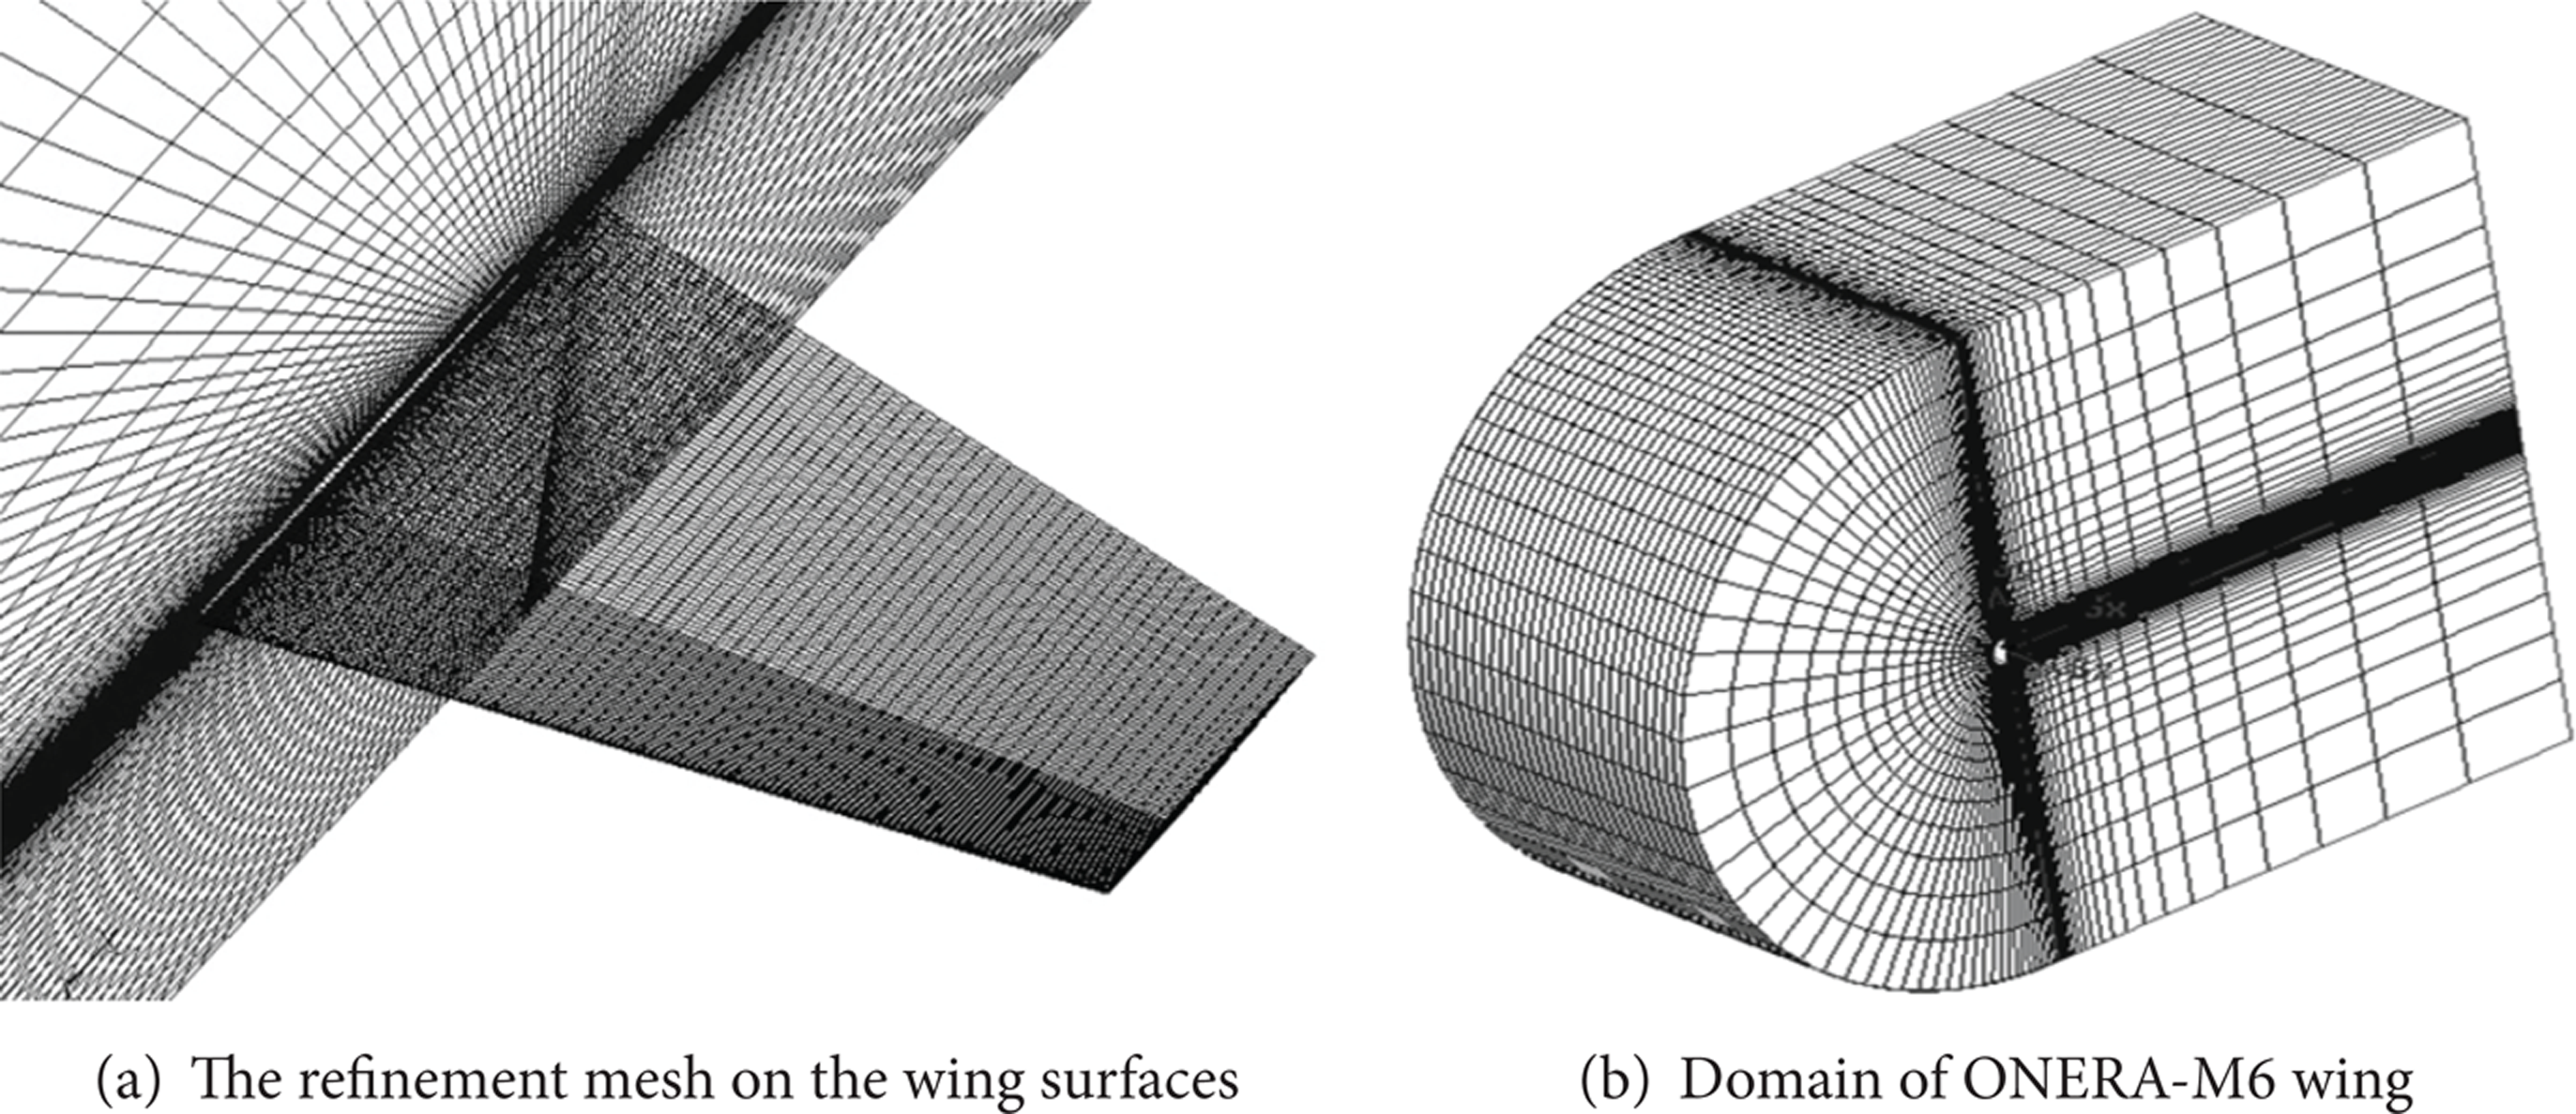
The computation domain and mesh on the surfaces.
The initial flow conditions are the freestream flow values as presented in Table 1. The static temperature was selected to be 460 degrees Rankine, which with the Mach and Reynolds number yielded a static pressure of 45.829 psi.
2.3. ONERA-M6 Wing with Aileron and Simulation Setup
As shown in Figure 4, the ONERA-M6 type of wing has been adopted to further investigate the hinge moment generated by the deflecting aileron. The aileron however can be formed by directly cutting the main wing. The gap between the aileron and main wing is set as d = 1.0%c, 1.8%c, 2.4%c, and 5.0%c. The chord length of aileron c a is set as 28%c. The Mach number will be chosen as M = 0.35, 0.6, and 1.12. The deflecting angles of aileron (δ a ) will be adopted as −5~20°.
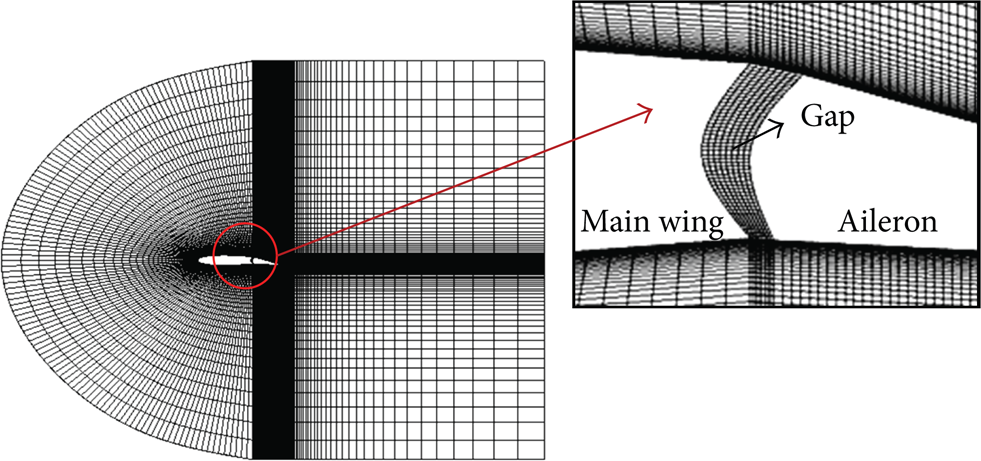
The sliced mesh surface for the wing with the aileron.
When modeling the whole 3D calculation domain of the wing with aileron, the results will be significantly affected by the quality of the mesh. As shown in Figures 5(a) and 5(b), the whole computational domain will be mainly divided into three subdomains, which will be meshed with structural grids [10–13], (1) inner domain (inner main wing part), (2) middle domain (middle main wing part equipped with an aileron), and (3) outer domain (outer main wing part). Each subdomain will be combined with interface technology, generating the whole 3D calculation domain for the wing with aileron.

The scheme and the grid point distribution for the whole 3D model. (a) The inner (outer) domain part. (b) The middle domain part.
For the middle domain, the radial length of the computational domain is 30 times that of the cross section of the wing span. The computational domain is divided into nine subregions, with fine grids concentrating on the regions close to the main wing, aileron, and the small gap. In the numerical simulation, the finest grid has minimum spacing at the gap y = 3.0E − 05c, where c is the chord length of the wing. The average
3. Results and Discussion
3.1. Comparison of the Simulation and Experimental Results
As shown in Figures 6 and 7, the pressure cloud and λ shock wave on the wing surfaces have been shown, and the chord orientation pressure coefficient curves in six spanwise locations (20%, 44%, 65%, 80%, 90%, and 95%) show a good agreement with the wind tunnel test data; the comparisons are good overall, proving the CFD accuracy.
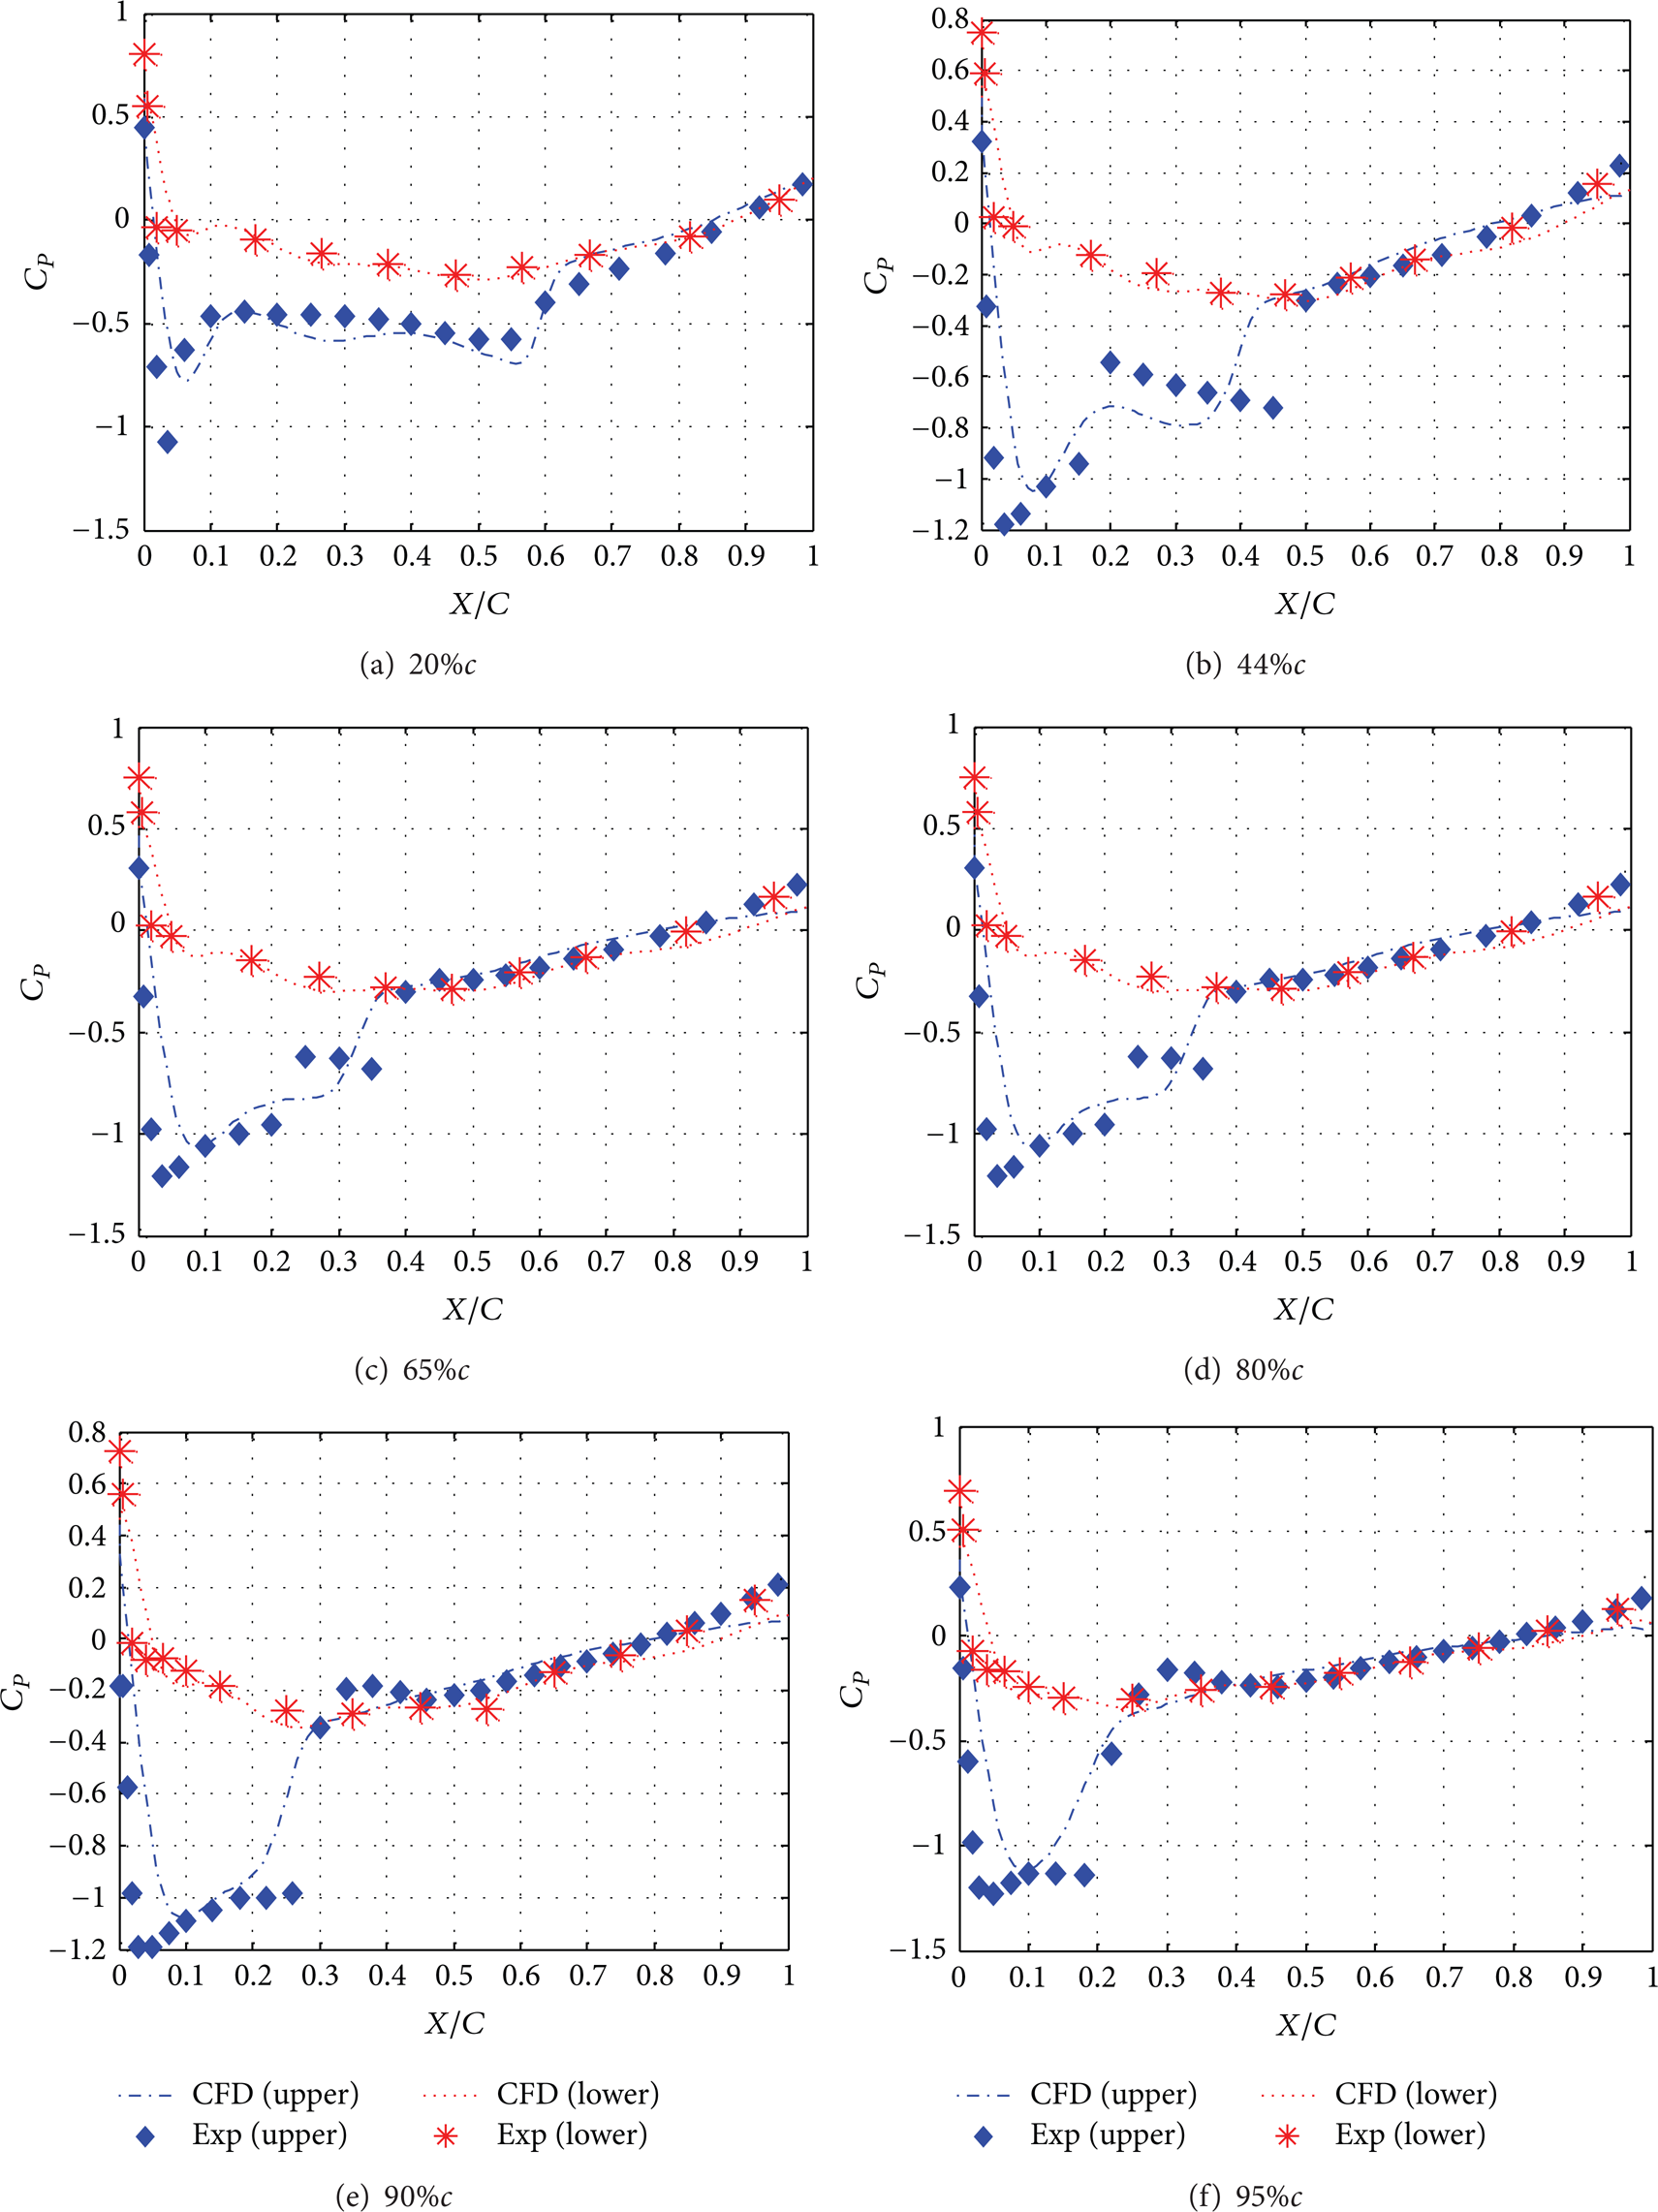
Chord orientation pressure coefficients compared with wind tunnel test data.

Pressure contours on the symmetry plane and surface of the ONERA M6 wing.
3.2. Grid Sensitivity Test
As shown in Figure 8, we have chosen six different grid sizes (A × B × C, y), A: nodes on the perimeter edges of the outer computational domain; B: nodes in the axial direction, and C: nodes in the radial direction and y: the minimum grid spacing at the small gap. c is the chord length of the wing. They are 201 × 201 × 201, 3e − 5c; 401 × 201 × 101, 3e − 5c; 201 × 101 × 401, 2e − 5c; 201 × 101 × 201, 5e − 5c; 401 × 201 × 401, 0.5e − 5c; and 201 × 401 × 201, 3e − 5c, respectively. From Figure 3, we can see that the six grid sizes studied do not deviated from each other within 1.5%. As a result, we adopt the 201 × 401 × 201, 3e − 5c grid for the subsequent computation.

The grid sensitivity test for the wing with aileron (d = 2.4%c and δ a = 5°).
3.3. Hinge Moment Characteristics
3.3.1. Effects of the Different Deflecting Angles
As shown in Figure 9(a), for the δ a = – 5° case, the airflow will generate a positive downward deflecting torque on the aileron at α ≤ 5°. As the angle of attack increases, the projected area perpendicular to the flow direction will be reduced gradually, so the corresponding hinge moment will be reduced at the same time.

Comparison of the hinge moments for different deflecting angles.
However, as shown in Figure 9(b), when α > 5°, the hinge moment will switch to the negative values. As the angle of attack increases, both the effective angle of attack and aileron projected area will be increased gradually. So, the corresponding hinge moment has shown the absolute increase numerically in the negative value. Except this, for the δ a = 0°, 5°, 10°, and 20° cases, all the corresponding hinge moments have shown the same trend. However, we should not ignore a special phenomenon. As shown in Figures 9(a) and 9(b), the hinge moments are not always increasing monotonously with the angle of attack increase; the curves have began to bend upward at the high angle of attack (α > 12°).
Figure 10 has shown the chordwise pressure coefficient distribution on the upper and lower surface of the wing with different deflecting angles (d = 2.4%c and M = 0.6). As shown in Figure 10(a), for the nonaileron case, the chordwise pressure coefficient distribution has shown the same trend as the conventional airfoil theory [14–16]; that is, the higher pressure region is on the lower surface of the wing and the lower pressure region is on the upper surface of wing. However, for the wing with aileron case, different deflecting angles have shown the different pressure distributions comparing with the nonaileron case. For the smaller deflecting angles (δ a ≤ ± 5°), due to the fact that there is a gap (d) between the main wing and aileron, this can directly affect the airflow pattern on the aileron surfaces and suffering the lift loss. However, if the deflecting angle and angle of attack are relatively smaller, when the air flow over the wing, boundary separation layer, has not completely detached, the trailing edge vortices have also not been generated, so the corresponding pressure coefficients are only showing a minor changes in values.

The pressure distributions on the upper and lower surfaces of the whole wing (α = 20°, d = 2.4%c, and M = 0.6).
However, once the deflecting angle reaches big enough value (δ a > 10°), as shown in Figure 10(d), the top (low pressure region) and down (high pressure region) curves began to move up and down, respectively. It can make the pressure difference between the upper and lower surface of the aileron become larger and larger with the increase of the deflecting angle. The corresponding lift and hinge moments will be increased simultaneously.
Figure 11 has shown the flow patterns of the wing (at 65%c section) with different deflecting angles at α = 20°. The flow pattern near the surface of the wing can directly affect the generation of the lift. A strong and concentrated vortex generated above the surface of the wing can induce negative pressure, which in turn can provide substantial vortex lift enhancement. The advantages may disappear if the corresponding vortex is not formed in time or broken down prematurely. From the above figures, we can see that the whole flow field is subjected to the fully separated flow condition at α = 20°; a stronger and concentrated vortex is generated above the surface of the main wing. The vortex induces negative pressure on the upper surface of the main wing, which can provide substantial vortex lift. These contributions can account for a very large proportion of the total lift force and the corresponding lift curves will always show a nonlinear trend.
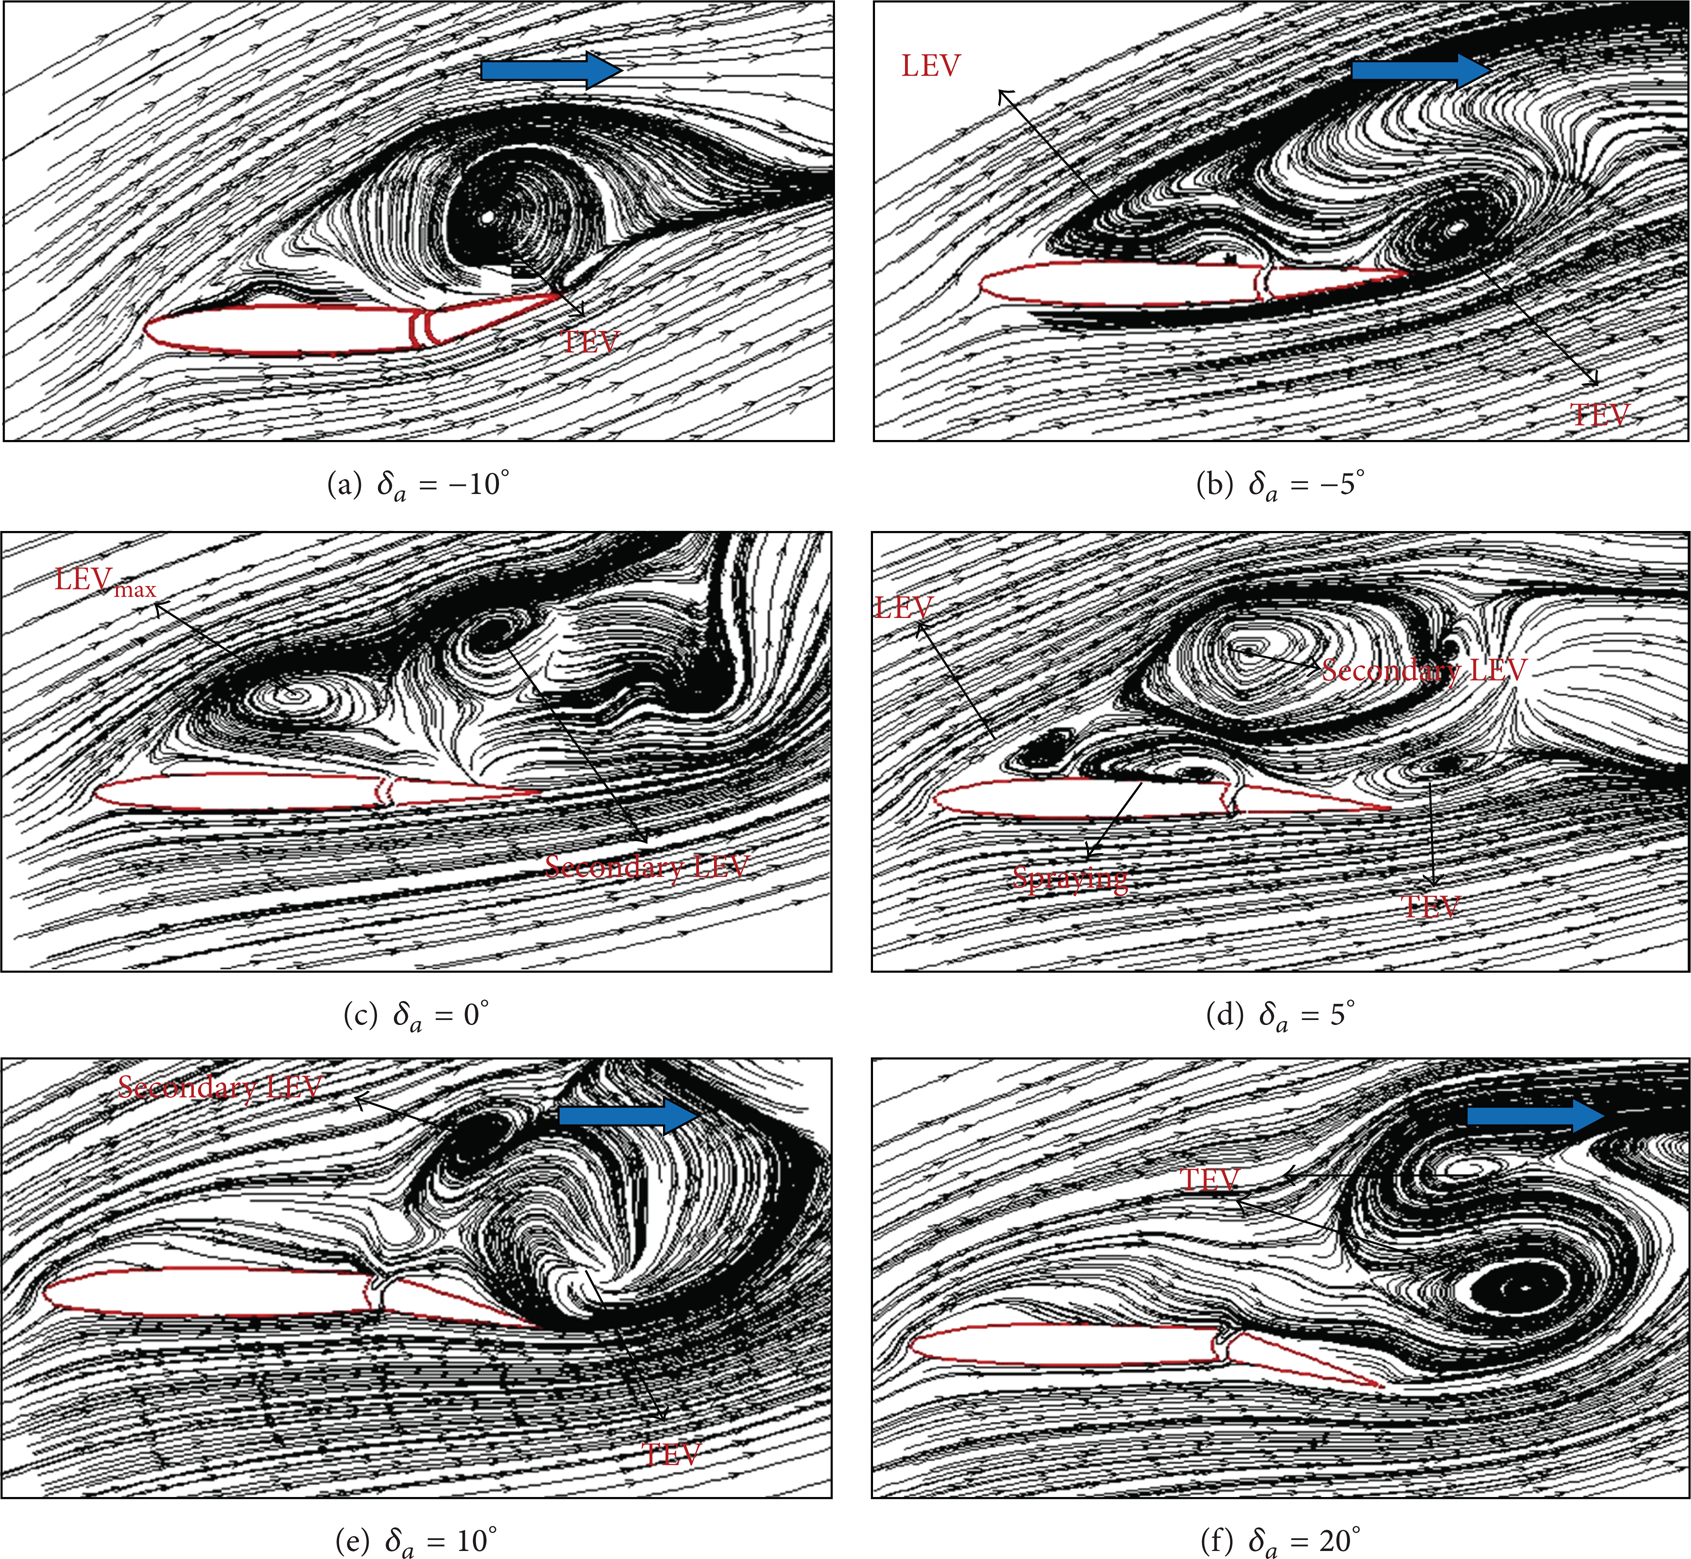
Streamlines of the 65%c section of the wing for different deflecting angles (α = 20°, d = 2.4%c, and M = 0.6).
As shown in Figure 11(a), for the δ a = – 10°, the obvious tailing edge vortex (TEV) has been generated on the upper surface of the aileron, but there is no leading edge vortex (LEV) generated on the upper surface of the main wing. As the aileron deflects downward, the obvious leading edge vortex has been generated, and the trailing edge vortex however starts to move backward gradually (shown in Figure 11(b)). When the aileron has no deflecting angle (δ a = 0°) as shown in Figure 11(c), the leading edge vortex can reach the maximum level (LEV max ), which can induce the secondary vortex (LEV2) on the downstream upper surface of the main wing. However, the TEV has totally disappeared in this case.
As shown in Figure 11(d), when the aileron has a certain positive deflecting angle (δ a = 5°), the aileron has formed the “obstacle” and block off the airflow go through the gap. As a result, the air will be forced to flow through the small gap and form the extremely strong spraying flow. It can directly destroy the previously formed LEV. The bigger δ a is, the stronger the destroy ability will become. So, the previously formed LEV will totally vanish at the bigger deflecting angles (shown in Figures 11(e) and 11(f)). But due to the presence of the positive deflecting angle, the TEV will begin to generate at the trailing edge of the aileron. The induced secondary leading vortex will be mixed with the developing TEVs and form the stronger TEVs at the downstream position.
3.3.2. Effects of the Different Mach Numbers
As shown in Figure 12, for the supersonic flow case, the hinge moment generated by the aileron is obviously bigger than that of the subsonic flow case. Due to the fact that the Reynolds number is relatively lower in the subsonic flow and that the corresponding flow velocity is also slower, the flow pattern can be greatly affected by the other various viscosity factors and become more complex. Therefore, the curves for the subsonic flow are showing serious nonlinear (

Comparison of the hinge moment for different Mach numbers.
3.3.3. Effects of the Different Gaps between the Main Wing and Aileron
For δ a = 0° case shown in Figure 13(a), at smaller angle of attack (α < 5°), as the gap (d) increases, the corresponding hinge moments are showing almost unchanged until α > 10°. And the corresponding absolute values are not always monotonically increasing with the increase of the angle of attack. Firstly, in the smaller gap region (d < 2.4%c), as the gap increases, the corresponding hinge moments (absolute values) are increasing with the increase of the angle of attack. However, when the gap reaches the maximum value (d = 5%c), the hinge moment curve has begun to bend upward; that is, the hinge moment is decreasing with the further increase of angle of attack.

Comparison of the hinge moments for different deflecting angles and gaps.
It is mainly due to the fact that the airflow on the upper surface of wing can be accelerated due to the presence of the smaller gap (d < 2.4%c) shown in Figure 14(a). This effect can directly weaken the pressure distribution on the upper surface of the wing. So, the corresponding pressure difference between the upper and lower surface of the wing has been greatly increased, making the hinge moment have a certain increase.
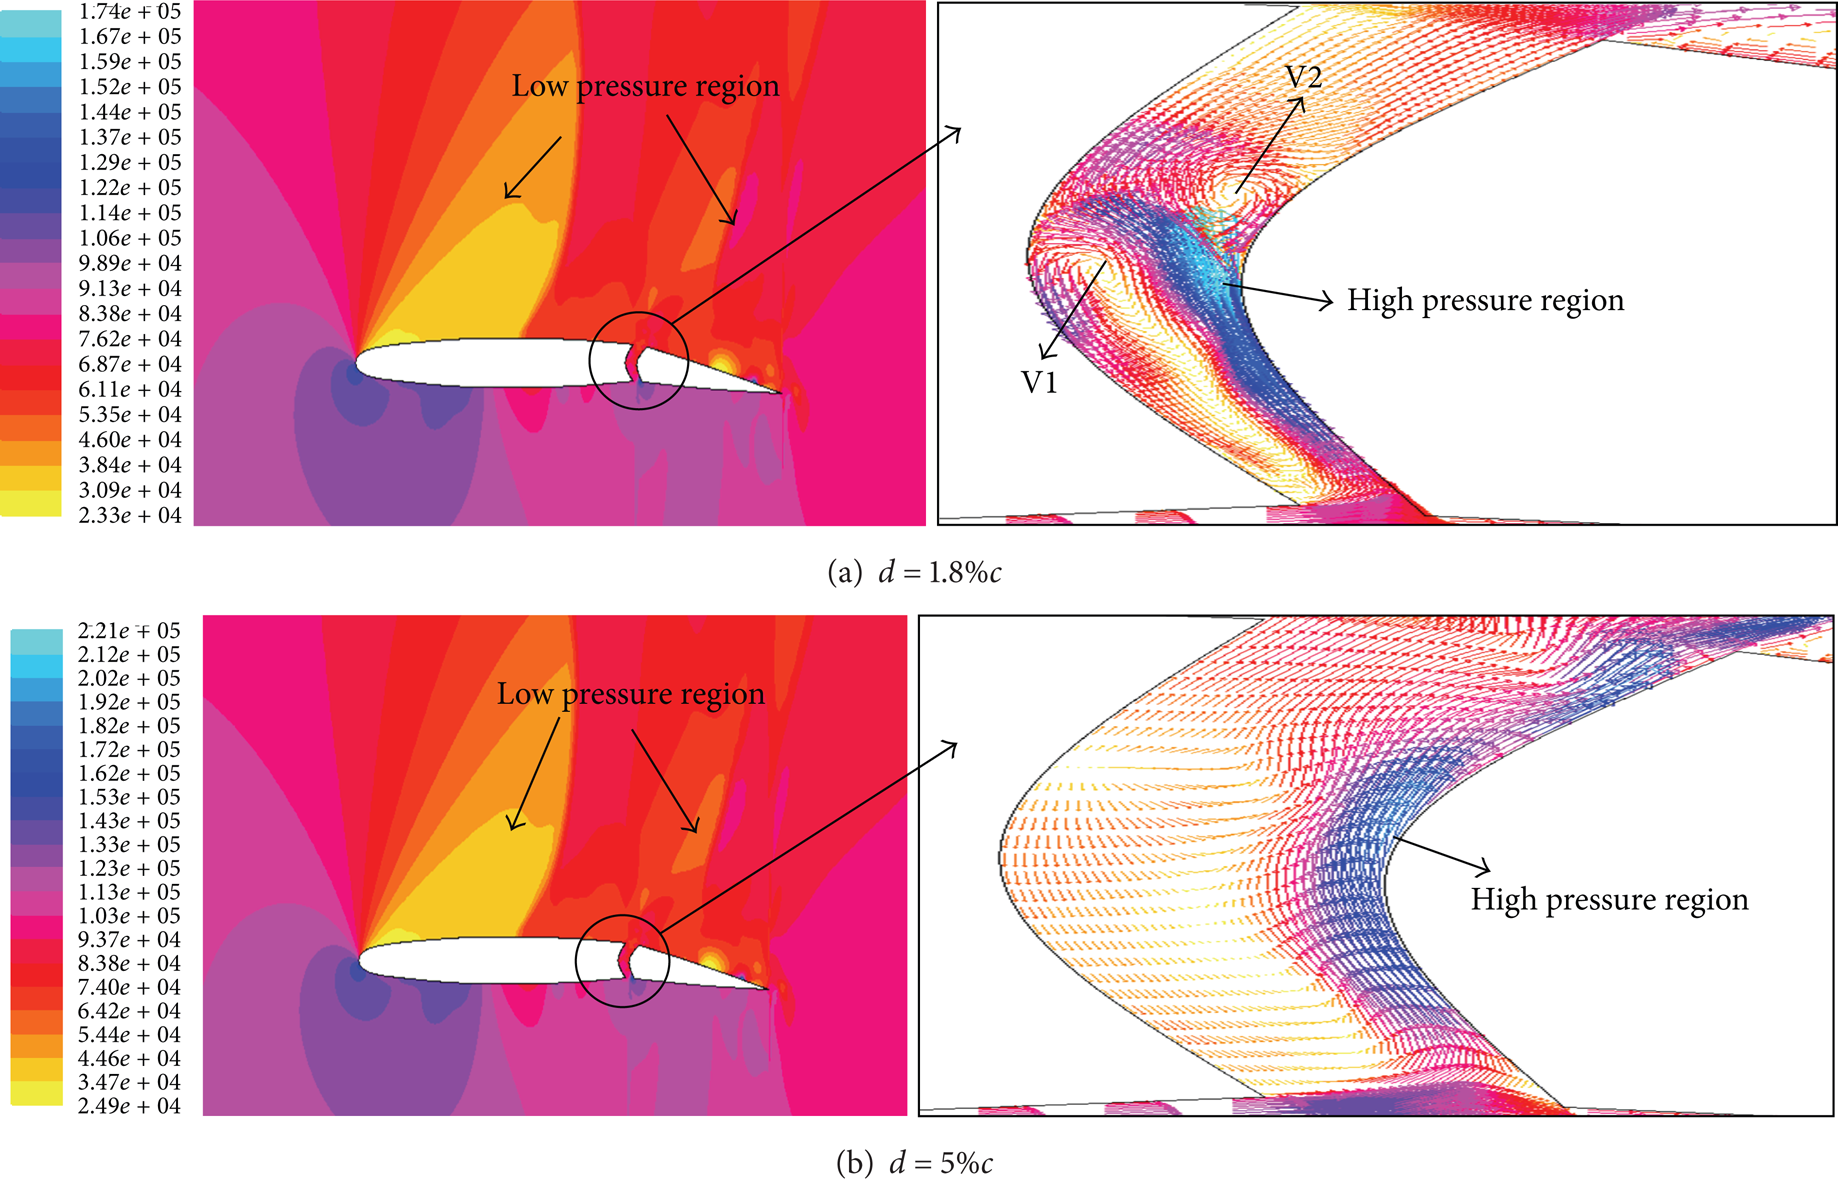
Contour of the pressure cloud and velocity vector for different gaps.
However, in the bigger gap region (d = 5%c) shown in Figure 14(b), the air flowing though the gap will not be greatly affected by the gap. The corresponding flow velocity has little change, but it can greatly affect the convolution effect and weaken the vortex intensity on the upper surface of the wing. So, the corresponding pressure difference between the upper and lower surface of the wing has been greatly reduced and the hinge moment therefore begins to decrease at this time.
As shown in Figure 14(b), at the bigger deflecting angle (δ a = 10°), the corresponding hinge moment curves have also shown the same “bending upward” phenomenon as in Figure 9(a) (d = 5%c, δ a = 0°). This can be explained from Figures 11(e) and 11(f). As the deflecting angle increases, the vortices generated on the upper surface of the wing are moving gradually backward. In particular at δ a = 20°, the well-formed vortices have been generated at the trailing edge of the wing. The corresponding vortex core is also moving backward, which can greatly weaken the airflow velocity on the upper surface of the wing and make the pressure difference decrease. So, the corresponding hinge moments are decreasing at the bigger deflecting angle.
4. Conclusions
(1) Comparing with the nonaileron case, the chordwise pressure coefficient distribution for the wing with aileron has shown the different trends from the conventional airfoil theory (i.e., the higher pressure region is on the lower surface of the wing and the lower pressure region is on the upper surface of wing). For the smaller deflecting angles (δ a ≤ ± 5°), the corresponding pressure coefficients are only showing minor changes in values. Once the deflecting angle reaches big enough value (δ a > 10°), the top (low-pressure region) and down (high-pressure region) curves began to move up and down, respectively. It can make the pressure difference between the upper and lower surface of the aileron become larger with the increase of the deflecting angle. The corresponding lift and hinge moments will be increased simultaneously.
(2) The flow pattern near the surface of the wing can directly affect the generation of the lift. A strong and concentrated vortex generated above the surface of the wing can induce negative pressure, which in turn can provide substantial vortex lift enhancement. The advantages may disappear if the corresponding vortex is not formed in time or broken down prematurely.
(3) Due to the presence of the gap, the air will be forced to flow through the small gap and form the extremely strong spraying flow. It can directly destroy the previously formed leading edge vortex (LEV). The bigger δ a is, the stronger the destroy ability will become. So, the LEVs cannot be found at the bigger deflecting angles. Due to the presence of the positive deflecting angle, the TEV will begin to generate at the trailing edge of the aileron. The induced secondary LEV will be mixed with the developing TEVs and form the stronger TEVs at the downstream position.
(4) Due to the fact that the Reynolds number is relatively lower in the subsonic flow and the flow pattern can be greatly affected by the other various viscosity factors and become more complex, so the corresponding curve for the subsonic flow is showing serious nonlinear. While for the supersonic flow, the curve has shown a good linear. The corresponding hinge moments are also extremely sensitive to the changing angle of attack, and the slope of curves is also bigger than that of the subsonic flow.
(5) The hinge moments (absolute value) are not always monotonically increasing with the increase of the angle of attack. In the smaller gap region (d < 2.4%c), as the gap increases, the corresponding hinge moments (absolute values) are increasing with the increase of the angle of attack. However, when the gap reaches the maximum value (d = 5%c), the hinge moment curve has begun to bend upward; that is, the hinge moment is decreasing with the further increase of angle of attack. As the deflecting angle increases, the vortices generated on the upper surface of the wing are moving gradually backward. The corresponding vortex core is also moving backward, which can greatly weaken the airflow velocity on the upper surface of the wing and make the pressure difference reduced. So, the corresponding hinge moments are decreasing at the bigger deflecting angle and the corresponding curves are also showing the same “bending upward” phenomenon.
Footnotes
Acknowledgments
Deepest gratitude goes first and foremost to Professor Yu and Professor Chien for their constant guidance. Financial support from the Nanyang Technological University is gratefully acknowledged. The authors also would like to thank the reviewers for their helpful suggestions.