
Abstract
A multitype wireless sensor network (WSN) for structural health monitoring is developed for the National Stadium in China (generally known as “Bird's Nest”). The stadium is a super large-scale building built for the 2008 Beijing Olympic Games and can house more than 90,000 occupants. The structure is very rigid and weighs more than 40,000 tons in total. Considering the structural features and on-site environment, the system takes multitype sensors as measurement components including stress, displacement, acceleration, wind, and temperature. The monitoring module design consists of four functions: sensing, processing, wireless communication, and energy management. The communication between each sensor node is realized by using an adjustable and artificial-control chain-type network. A total of 290 sensors were installed on the structure, and the data collection work has been carried out for more than one year. This paper mainly focuses on the system development and project application, while the data analysis work is briefly discussed as well. It can be concluded that the customized WSN is robust and durable, which well satisfies the requirement of plenty multitype sensors working in a large-area distribution. The data analysis results reveal that the super large-scale structure is very sensitive to the temperature effect.
1. Introduction
Large-span spatial structures are widely used in large public buildings such as gym, stadium, airport, railway station, and exhibition hall. This type of structures in China has generated a great deal of interest and has entered a new era of fast development. One of the characteristics of large-span spatial structures is being of steel construction and the material is homogeneous throughout. As a result, the structural design mainly focuses on its structural topology [1].
The National Stadium of China, generally known as “Bird's Nest,” was built for the 2008 Beijing Olympic Games. It is a super large-scale building that has been considered as the symbol of large-span spatial structures in China, as shown in Figure 1. The building on plan view is in the shape of an ellipse with a diameter of 332 meters on north-south direction and 297 meters on east-west direction. The entire structure is composed of 24 main trusses and each truss consists of 2-layer square-section steel tubes. The average size of the tube section is 1 m in side length and 40 mm in wall thickness; therefore, the entire structure is very rigid which weighs more than 40,000 tons, as shown in Figure 2.

Photograph of “Bird's Nest.” (a) The entire structure of “Bird's Nest.” (b) Partial view of “Bird's Nest.”

Structural view of “Bird's Nest.”
It is such a large-scale public building that can house more than 90,000 occupants, and the safety of the structure is a major concern for owners and structural engineers. Once structural incidents and accidents occur, both the economy and human life loss can be inconceivable. An effective way to avoid such mishap is to develop structural health monitoring (SHM) systems for continually monitoring and assessing the health of the structure. As a matter of fact, health assessment procedures have been developed and applied in civil infrastructures for years especially in the bridge engineering. A lot of research work on sensor technology, optimal sensor placement strategies, damage detection, and health evaluation have been carried out and many engineering applications have been reported [2–10]. By contrast, health assessment work for large-span spatial structures has not started until recent years [11, 12]. One of the main reasons is that traditional SHM systems are not so suitable for this type of structures. In traditional systems, wires and connections are commonly used for data transmission and power supply, which may not be a big problem in application of line-shape structures such as bridges and dams. For large-area-scale structures, however, time and expense will be largely consumed in wires installation. The cost will increase drastically as the number of sensors increases. Additionally, the complex layout of the wires along with its reliability and aging issues makes such application problematic.
Recent breakthrough in sensor development, wireless communication, and application of high-energy battery has made wireless SHM systems in reality as an efficient and economical solution for the health detection of large-span spatial structures. As early as in 1996, the wireless sensing technology was firstly attempted in a SHM system for civil engineering [13–16]. Since then, a lot of research work was carried out on various types of wireless sensor development. A remarkable achievement is the design of a wireless sensor node using an 8-bit microchip and taking the accelerometer as the sensor component. It has been verified in the lab and made a foundation for future application in engineering [17]. With the development of the age, the wireless sensor technology becomes more advanced, and the function of SHM system turns more customized [18–20]. In recent years, more and more models of wireless sensors are presented by other researchers for different applications, for example, wireless acceleration sensors, wireless strain sensors, and so on [21–23]. For bridge health assessment, more importance is attached to the development of wireless acceleration sensors [24, 25]. However, for monitoring static building structures, wireless strain sensors are equally or even more important. Among them, the wireless vibrating wire sensor (VWS) is worth mentioning. It has been applied to long-term stress monitoring because of its stable and durable properties [26]. As far as power supply of wireless sensor is concerned, high-energy battery still plays the key role nowadays, and solar energy seems to be another good choice because of its renewable capability [27].
Real-world application of wireless sensor system in civil engineering often falls behind the research work. A relatively early report around the world is the environment and behavior monitoring for a bridge in 1997 [7]. Another typical case in recent years is the monitoring of Golden Gate Bridge. There are totally 64 nodes distributed over the main span and the tower of the bridge [28]. By far, the largest wireless sensor network for the infrastructure monitoring purposes is the network on Jindo Bridge. To be specific, a total of 669 sensing channels with 113 sensor nodes have been deployed [29–32]. In China, a typical case is the health monitoring system developed for Jinmen Bridge, on which 64 wireless acceleration sensors have been installed [10]. Apart from that, a benchmark for tall buildings in recent years is the SHM system designed for Guangzhou Tower, which integrated large amount and various types of sensors and the wireless sensor technology [33, 34]. For large-span spatial structures, the Shenzhen Civilization Center and the Chinese National Aquatic Center (generally known as “Water Cube”) may be the two early cases reported as the application of SHM system. There are some wireless sensors involved in monitoring those two buildings while the fiber sensors are still the main monitoring instruments [11, 35]. Above all, the engineering applications of wireless sensors are still relatively simple, the type of sensors is commonly unitary, the amount of sensors is not very large, and the communication between sensor nodes does not actually require a large-scale complicated network yet.
In the case of a real large-area-scale structure as “Bird's Nest,” the effective application of a wireless sensor network (WSN) involves such factors as the type of sensors used, the configuration and topology of the monitored structure, and the nature of the instrumentation network. There is no doubt that a customized multitype wireless sensor network for the structure of “Bird's Nest” is an urgent demand. In recent years, a great deal of research work has been performed on the WSN development. Most of the work focused on the multichannel conflict and time delay problem, which is the key to the synchronization and efficiency of WSN [36–39]. On the other hand, there is rarely any report for a real-world application of WSN with large amount and type of sensors distributed in a super large-area-scale structure. For that kind of application, more importance should be attached to the stability, durability, and flexibility of WSN.
In this paper, a multitype wireless sensor network is developed aiming for monitoring structural and environmental parameters of the “Bird's Nest.” The system takes multitype sensors as measurement components including stress, displacement, acceleration, wind, and temperature. The communication between each node is realized by using an adjustable and artificial control chain-type network, and the collected data is transferred via a specified path from the sensor node to the server on site. This paper mainly focuses on the WSN development and engineering application. It is organized as follows. Section 2 presents the research of the hardware design, particularly vibrating wire sensors. Section 3 focuses on the development and application of the network on the “Bird's Nest.” Section 4 briefly discusses the monitoring data during one year. Finally, a summary of the work is given in Section 5.
2. Hardware Design
Considering the structural features of “Bird's Nest” and its on-site environment, a multitype wireless sensor network for structural and environmental parameters monitoring is developed. The system takes multitype sensors as measurement components including stress, displacement, acceleration, and wind and temperature sensors, and has in total 290 sensors distributed in the entire building.
2.1. Layout of Wireless Sensor System
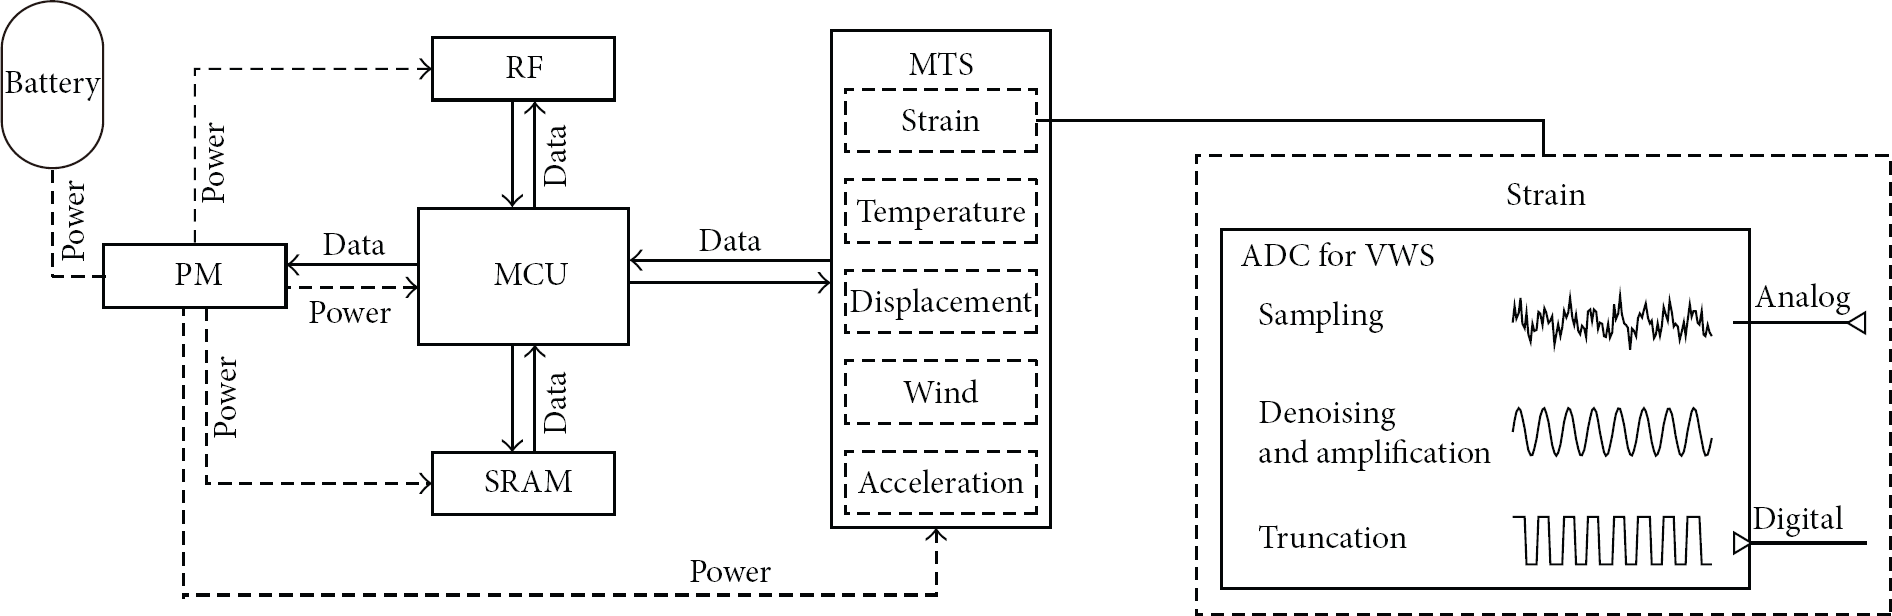
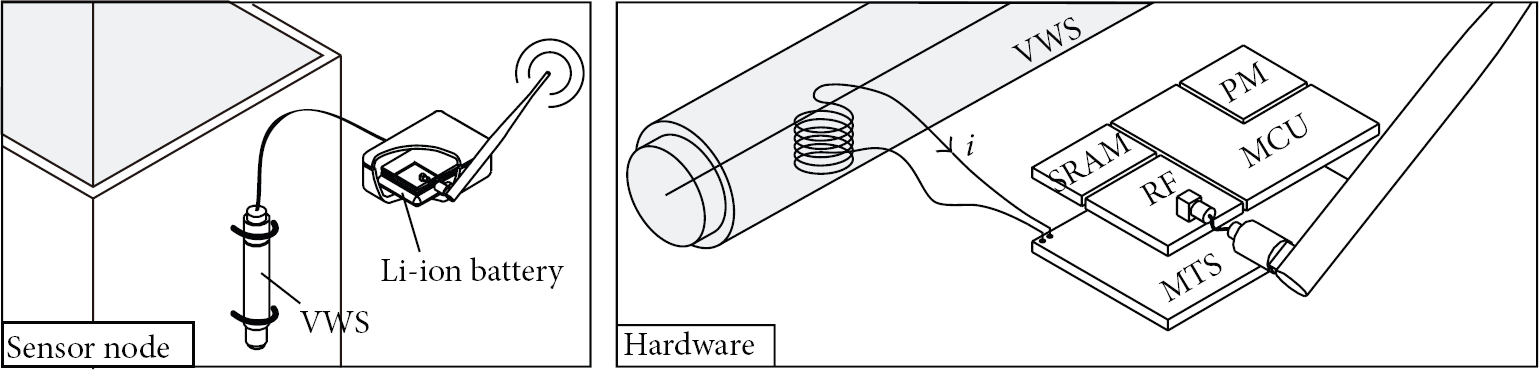
The key principles behind the hardware design of wireless sensors for SHM applications are functional modularity, energy efficiency, measurement accuracy, configuration flexibility, and network extensibility. The functional design of the hardware usually consists of four aspects: data acquisition, digital wireless communication, embedded microprocessing, and power management [15–17]. The realization of all four functions is based on several modules, namely, the power management (PM), radio frequency (RF), microcontrol unit (MCU), static RAM (SRAM), and multitype sensing (MTS) modules. Using low-voltage and low-power microchips and integrating proper energy management strategy, the battery-powered wireless sensor units can be operated for extended lifespan. By using various sensors, amplifier circuits and ADCs, different parameters and different levels of measurement range can be switched within several boards. By using an independent RF module, several different wireless network topologies and protocols can be implemented without affecting other circuit units and configurations. Figure 3 illustrates the architecture of the hardware design of the wireless sensor, the RF and MTS modules are actualized in two independent boards, and the other modules are integrated into another single board. The integrated wireless sensor unit using three printed circuit boards (PCB) is shown in Figure 4.
Hardware architecture of wireless sensor unit.

Picture of wireless sensor unit.
The function of the MTS module is to measure physical parameters in the network. Various types of sensors with different measurement circuits can be selected for different applications. There are totally four kinds of boards with five parameters sensing can be selected: a digital displacement measurement board, a high-accuracy digital acceleration measurement board, a digital wind speed and direction measurement board, and a vibrating wire sensor board with A/D converter. The temperature sensing module is integrated together with the VWS board. Various MTS modules will be discussed in detail in the following section.
The MCU module has a core of the microchip from Atmel's low-power AVR family. The AVR core combines a rich instruction set with 32 general-purpose working registers. The architecture is code efficient while achieving throughputs up to ten times faster than conventional CISC microcontrollers. By executing instructions in a single clock cycle, such MCU achieves throughputs approaching 1 MIPS per MHz, allowing the system designer to optimize power consumption versus processing speed. Another characteristic of the MCU is that several sleep modes (idle, ADC noise reduction, power-down, power-save, standby, or extended standby) can be used to reduce the total energy consumption.
The function of the PM module is to manage the power supply to other modules. With a low-dropout voltage regulator, TPS7333, the input power in a scope of low voltage like 3.7 V to 9.0 V can be regulated to a suitable output one like 3.5 V for the entire system.
The SRAM module is a temporary data storage that can save the monitoring data up to 4 k bytes. It will be automatically cleared every time before sampling. The static RAM also can be replaced with another memory card for different requirement.
The very last module is the RF module. As mentioned above, the RF module can be separated from the other modules physically and logically. Such feature enables the network topology and protocol to be separated from other modules and to be easily upgraded to other advanced communication techniques in the future without significantly changing other modules. The selection of the RF module depends on the needs and features of engineering application. For “Bird's Nest,” the measurement field environment is similar to a 70,000 square meters forest consisting of thousands of steel trees about 1 meter in diameter. It requires that the signal of RF module has the ability of being unaffected by these obstacles and covering a suitable large area. The current RF daughter board with plane dimension 18 mm × 20 mm uses the 2.4 GHz IEEE 802.15.4/ZigBee-ready RF Transceiver CC2420 from Chipcon Semiconductor. The microchip is designed for low-power and low-voltage wireless applications. It includes a digital direct sequence spread spectrum base-band modem providing a spreading gain of 9 dB and an effective data rate of 250 kbps. The transmission distance can easily reach 100 meters long in the field environment, which is required to be longer than the roof width.
2.2. Multitype Sensing Module
The MTS module includes several different types for different kinds of sensors: VWS module for stress and temperature measurement, acceleration module, wind module for wind speed and direction measurement, and displacement module, as shown in Figure 5. Basically all sensors are commercial products with digital signal output that can be obtained directly without ADC. The VWS is an exception, which needs a specified analog circuit for excitation and picking up the signal.

Multitype sensors for different measurements.
For unified network control, the frequency and time of sampling is usually predetermined according to different types of sensors. It also can be adjusted by users anytime for different requirement. Description for each type of MTS modules will be given one by one below in this section.
2.2.1. Stress and Temperature Measurement
The VWS is used as the measurement component for the MTS module development. The function of the module is to measure strain and temperature parameters. There are four channels in the sensor board, and the basic working principle of each channel is identical.
In recent years, the VWS is commonly used for long-term strain measurement because of its stable, durable, and antielectromagnetic properties. It is small, cheap, easily manufactured, and can be packaged in a suitable size. For steel structural health monitoring, the VWS is generally affixed to the surface of the measured component, which would not affect the quality of the structure itself.
As Figure 6 shows, major components of a VWS include a vibrating wire whose frequency changes in response to tension and compression and a plucking and pickup coil which excites the wire and measures its resonance frequencies. A certain kind of fixtures welded on the steel surface can transfer the tension and compression to VWS. A sensor node can take 4 VWSs and be fixed on the measured components.
VWS node hardware.
An analog signal of electric current i generated from VWS to the MTS module contains the information of wire vibration, which can be expressed as


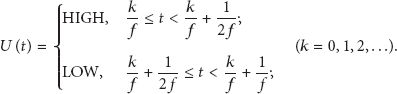
When signal U has been sent into MCU via the digital input capture pin, the value of f can be calculated, and the strain data is obtained accordingly.
For temperature measurement and compensation, a digital temperature chip is integrated in the VWS sensor. The chip DS18B20 produced by DALLAS company is selected, which has tiny size and is easily packaged. The measurement range is from −55°C to 125°C and the precision is 0.0625°C. It is simply digital signal output with 2 bytes and occupies only one pin of the MCU. All features of the chip greatly satisfy the requirement of multinodes and distant measurement for “Bird's Nest.”
2.2.2. Displacement Measurement
The basic working principle of the displacement measurement is that an inductance-sensitive element moves back and forth in an LC oscillator, which causes a change of signal output. To put in details, take a long and slim iron core as the inductance-sensitive element and integrate a solenoid coil in a steel pipe, the magnetic resistance and inductance of coil will be changed when the iron core moves back and forth in the pipe, and the output signal produced by a frequency modulation circuit will be changed accordingly. With proper architecture, material, and manufacture, the frequency of the signal could keep great linear relationship with the displacement value of the iron core in pipe; then the displacement measurement could become available accordingly.
The measurement part of the displacement sensor is a commercial product. Via an integrated ADC module, the output is also converted to a simply digital signal with 2 bytes.
For “Bird's Nest,” the vertical displacement at cornice location is probably the maximum and main concern. The direct measurement to the vertical displacement is not available because there are no adjacent static points taken as the reference. Thus, a device for vertical displacement measurement of the cornice is designed based on liquid communicating principle. The vertical displacement value could be obtained by measuring the change of liquid level in a special tube-shape container. As shown in Figure 7, the vertical displacement value is relative to a reference static point. The container is put in the measuring point and filled with appropriate amount of liquid. A box full of liquid is put in a reference static point like the top of the column, which is connected with a slim pipe to the container. When a displacement occurs in the measuring point, the liquid will flow in the pipe to keep the new balance of the liquid level. The height change of the liquid level in the container is equal to the vertical displacement. A displacement sensor is installed in the device, and the sensitive element iron core is fixed on the buoy which moves along with the liquid level in the container.

Working principle of displacement measurement device.
2.2.3. Wind Speed Measurement
The wind velocity and direction sensor is also commonly commercial. The wind velocity could be obtained by calculating the cycles of the wind cup in unit time, and the wind direction could be learned by the vane on the sensor. The digital output signal can be read directly by the MTS module, which consists of 2 bytes 16 bits for velocity and 2 bytes 16 bits for direction.
2.2.4. Acceleration Measurement
A three-axes digital output linear accelerometer (LIS3LV02DQ) is selected for measurement. It includes a sensing element and an IC interface that can take the information from the sensing element and provide the measured acceleration signals to the external world through an I2C/SPI serial interface. The LIS3LV02DQ has a user selectable full scale of ±2 g, ±6 g and it is capable of measuring acceleration over a bandwidth of 640 Hz for all axes. The device bandwidth may be selected according to the application requirements. For the application on “Bird's Nest,” the scale of ±2 g and the bandwidth of 50 Hz are selected, which can satisfy the requirement greatly.
2.3. Sampling Principle
To implement the artificial control chain-type network, a series of custom protocols are developed. The communication packet is set to a length of 64 bytes, including ID of the sensor node, the piconet number, the command type, as shown in Figure 8. The length of data array is defined with 52 bytes considering the requirements of all kinds of MTS modules.

Protocol and format of signal in sensor nodes.
For energy saving, each sensor node is in sleep mode at usual time and wakes up itself for one second at a specified cycle. So if a wakeup command is kept sending to a node, it will be woken up from the sleep mode entirely.
Considering the optimization of a command, the frequency and time for each sampling operation are normally predetermined to different types of sensors. For the application of “Bird's Nest,” the time and frequency of VWS are 30 seconds and 0.1 Hz, respectively. Similarly, time and frequency are 10 seconds and 50 Hz for acceleration sensor, 10 seconds and 10 Hz for wind speed sensor, and 5 seconds and 1 Hz for displacement sensor.
3. Wireless Sensor Network
For an appropriate WSN development, such factors as the structural feature and shape, the sensor nodes distribution, the objective of measurement, and the performance of the sensor nodes used should be considered for effectiveness.
The shape of “Bird's Nest” on plan view is literally an elliptical ring with the outer diameter of 332 meters on north-south direction and 297 meters on east-west, and the inner diameter is 183 meters and 127 meters, respectively, as shown in Figure 2. There are a total of 98 sensor nodes including 290 different types of sensors distributed in the entire structure mostly on several typical main trusses. The transmission distance of the RF module used is designed to reach about 150 meters, which means that each node can satisfy the requirement of covering the circle area from column to cornice. So a chain-type network topology is most suitable for this engineering application. Considering the requirement for synchronism is not of emphasis while the robustness is, the working mechanism of the network is most basically designed as adjustable and artificial control. In conclusion, the communication between each node is realized by using an adjustable chain-type network, and the collected data is transferred via several relay nodes from the sensor node to the server on site.
3.1. Distribution of Multitype Sensors
The entire steel structure of “Bird's Nest” is composed of 24 main trusses with large amounts of subtrusses connected to each other. Each main truss consists of two-layer square-section steel tubes, which can be divided into four types in detail: upper-layer tubes, lower-layer tubes, middle tubes, and column tubes. Considering the quantitative limitation of sensor nodes, several typical main trusses are selected for sensor placement. According to the structural mechanical behavior, the stress sensors are fixed mainly at the location of columns, corners, 1/4 span points, and 1/2 span points for all four types of tubes, as shown in Figure 9. The average size of the tube section is 1 m side length and 40 mm wall thickness. There are 2 or 4 VWSs fixed on the surface in each section, specifically 2 on upper-layer tubes and 4 on other tubes, which helps to learn the axial force and bending moment. Since the VWS sensor node is designed with 4 channels, one node for each section will satisfy the measuring requirement. The total amounts of sensors are 268 and the wireless nodes count 76 accordingly.

Structural components of a single main truss.
In total, there are 14 acceleration sensors distributed in the steel structure to test the response to the excitation of environment such as earthquake and audience noise. Altogether 4 wind velocity and direction sensors are placed at 4 cardinal points in four directions. And also there are 4 displacement sensor nodes fixed at the location of the cornice where the value of vertical displacement is probably the maximum.
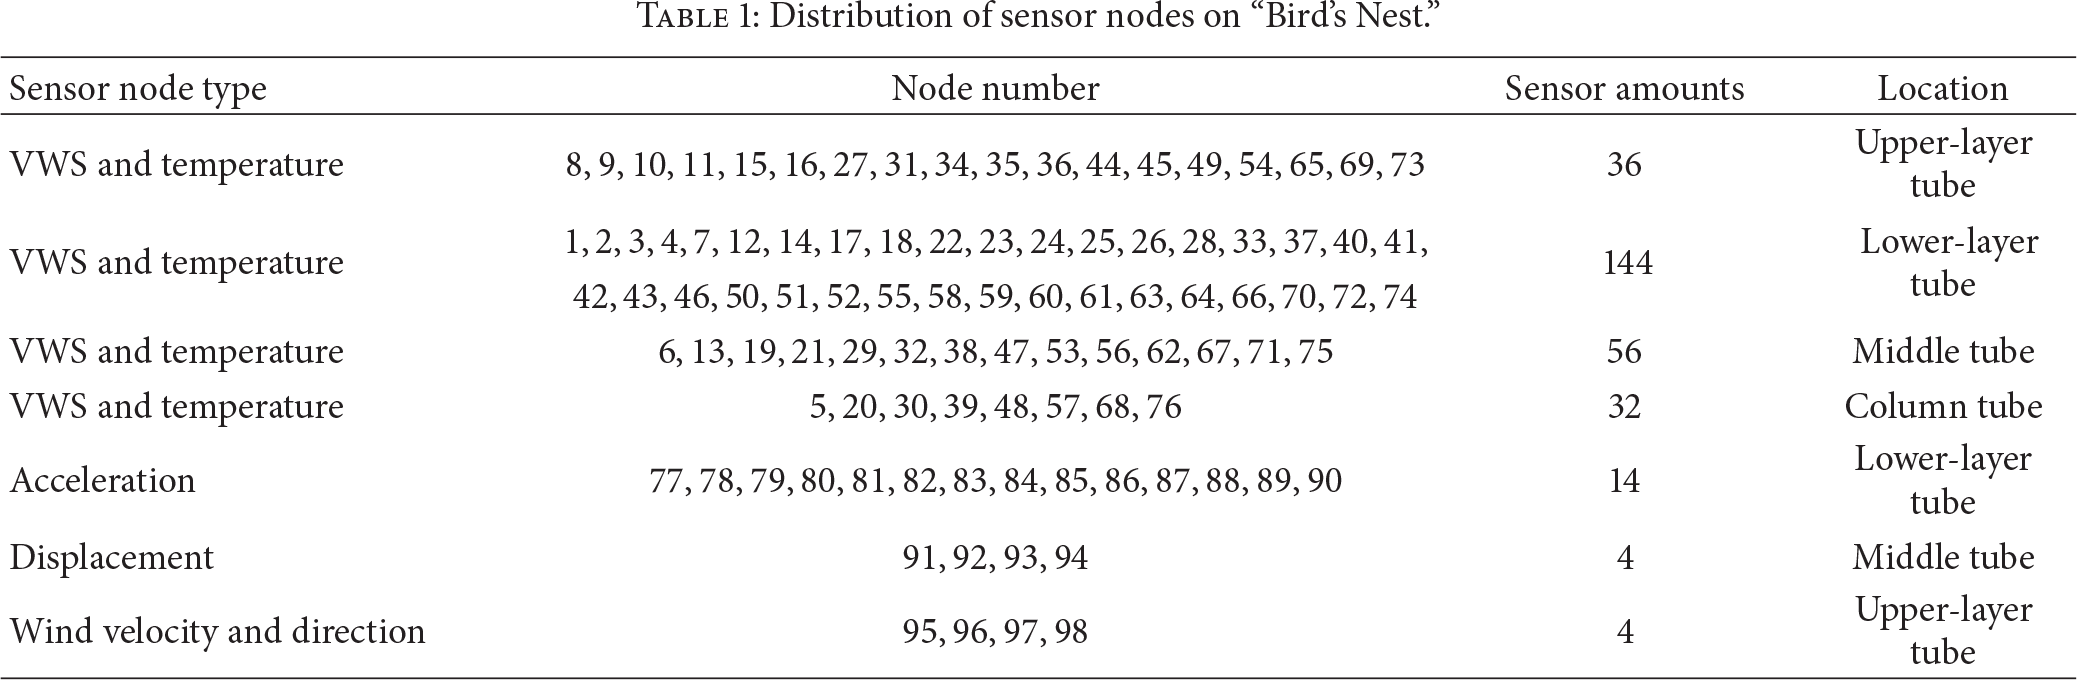
The layout of all sensor nodes distribution is shown in Figure 10 and Table 1. Some pictures of installation in field are shown in Figure 11.
Distribution of sensor nodes on “Bird's Nest.”

Layout of all sensor nodes distribution.

Pictures of sensor nodes installation: (a) VWS, (b) wind, (c) displacement, (d) relay nodes, (e) base station, and (f) acceleration.
3.2. Artificial-Control Network Design
The network design usually follows a basic principle that all sensor nodes scattered in the sensor field collect data and route data back to the sink node [40]. For “Bird's Nest,” the chief distinguishing features of the WSN are artificial-control and chain-type. As shown in Figure 12, the wireless sensor system consists of a sink node, several relay nodes, and a large amount of sensor nodes. The network topology is like a chain with each relay node acting as a chain unit connected one by one with each other. The entire chain-type network is separated into several star-type piconets by each relay node. In each piconet, the relay node acts as a parent node in charge of all sensor nodes as children. The piconet could be reorganized via dynamic address assignment. If some connections of sensor nodes to a relay node are weak while other connections are strong, a new route could be redefined by reassigning new addresses to the nodes, which means the relationship of the child node and the parent node will actually be changed. Therefore, the communication of the entire network will keep robust. The sink node is the root of the entire chain-type network and constitutes a base station with a field server together.
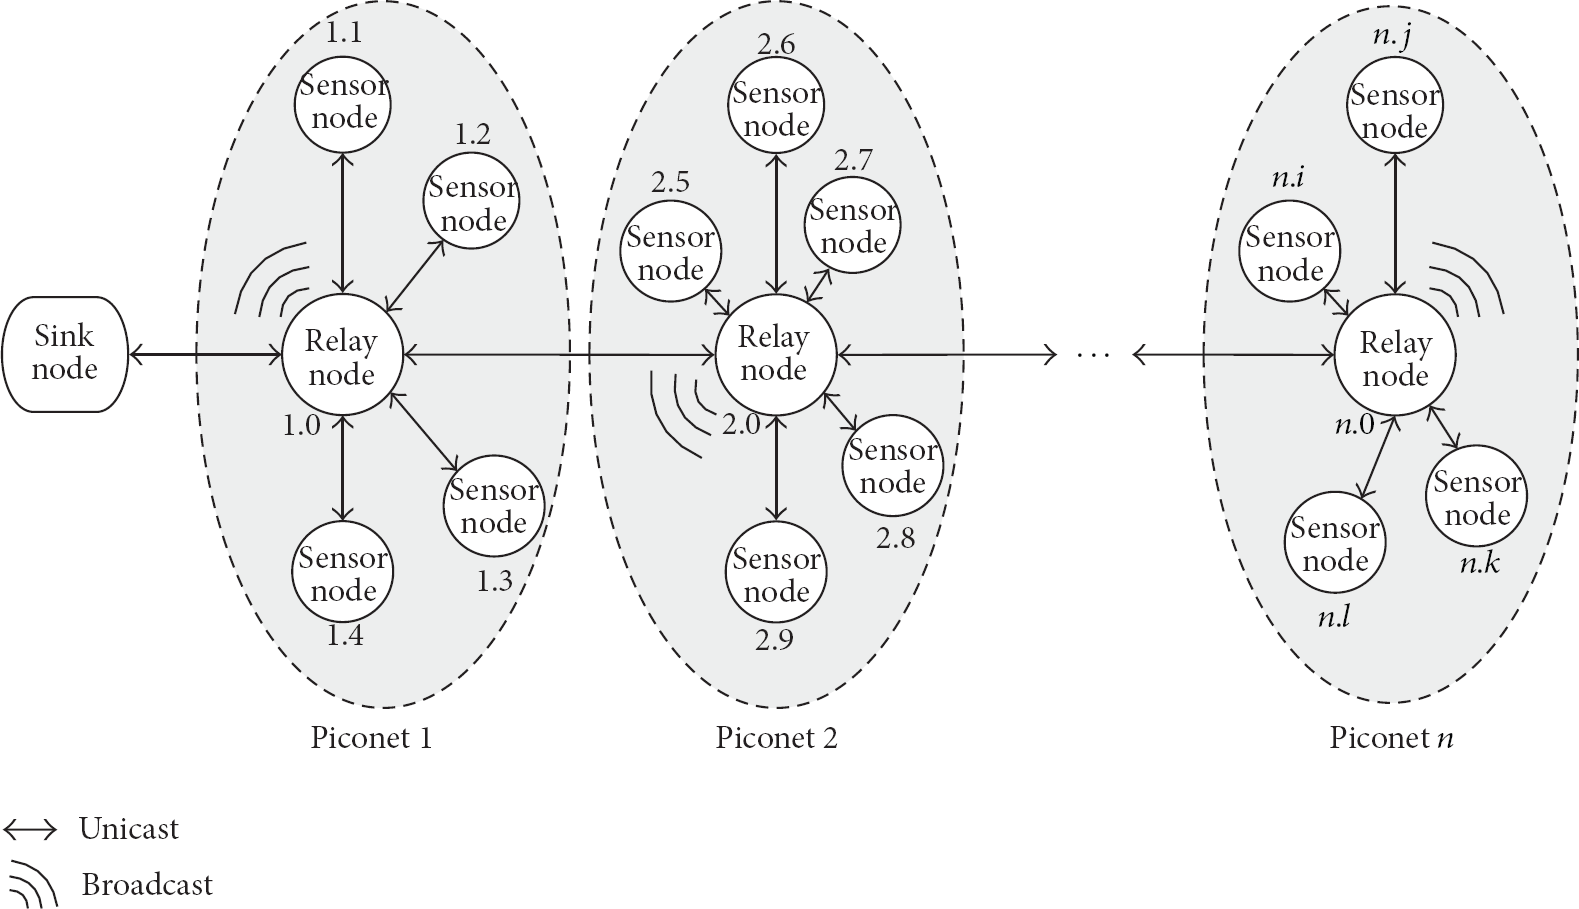
Topology of chain-type network.
For optimizing the operation of each sampling, there are two ways selected for command sending from node to node, namely, broadcast and unicast, as shown in Figure 12. When a command is sent out in the broadcast way, all nodes in the signal area could receive it and decide whether to execute it or not. While the unicast way is chosen, there should be a destination address, and the command will be executed only by the specified node. In general, the broadcast way is only chosen to make the relay nodes wake up sensor nodes and command them to start sampling. When all other commands such as calling back the data or resigning the address are sent, the unicast way will be selected.
The node address is marked as two numbers like *.* since the chain-type network is a two-layer one. The first number indicates the relay node of the piconet and the second number represents the sensor nodes. For example, the ID address for the 27th sensor node in the third relay node's piconet will be marked as 3.27. And the ID address for each relay node will be like *.0, as shown in Figure 12.
The communication could be realized via a specified route by assigning the addresses one by one. Considering that each node only communicates with specified nodes, the network efficiency can be improved greatly if the ID addresses of relative nodes are saved in each node. For example, the relay node will save the ID addresses of its previous relay node and the next one, and the sensor node will save the ID address of its parent node, namely, the relay node of the same piconet.
Apparently relay nodes play an important role in the chain-type network. The network paralysis may happen due to the failure of one relay node especially the one at the head. For the sake of a robust network, two approaches have been adopted. One is the backup of relay nodes, and the other is the switch of routing on reverse direction.
Backup of Relay Nodes. In order to improve reliability of the network, double relay nodes strategy is applied to service. One of the double relay nodes serves as the regular one, and the other acts as a backup which is normally in a long-term sleep mode, as shown in Figure 13(a). When the regular one is broken, the backup could be woken up and taken over by modifying the ID address, as shown in Figure 13(b). Consequently, the robustness of the network can be secured.
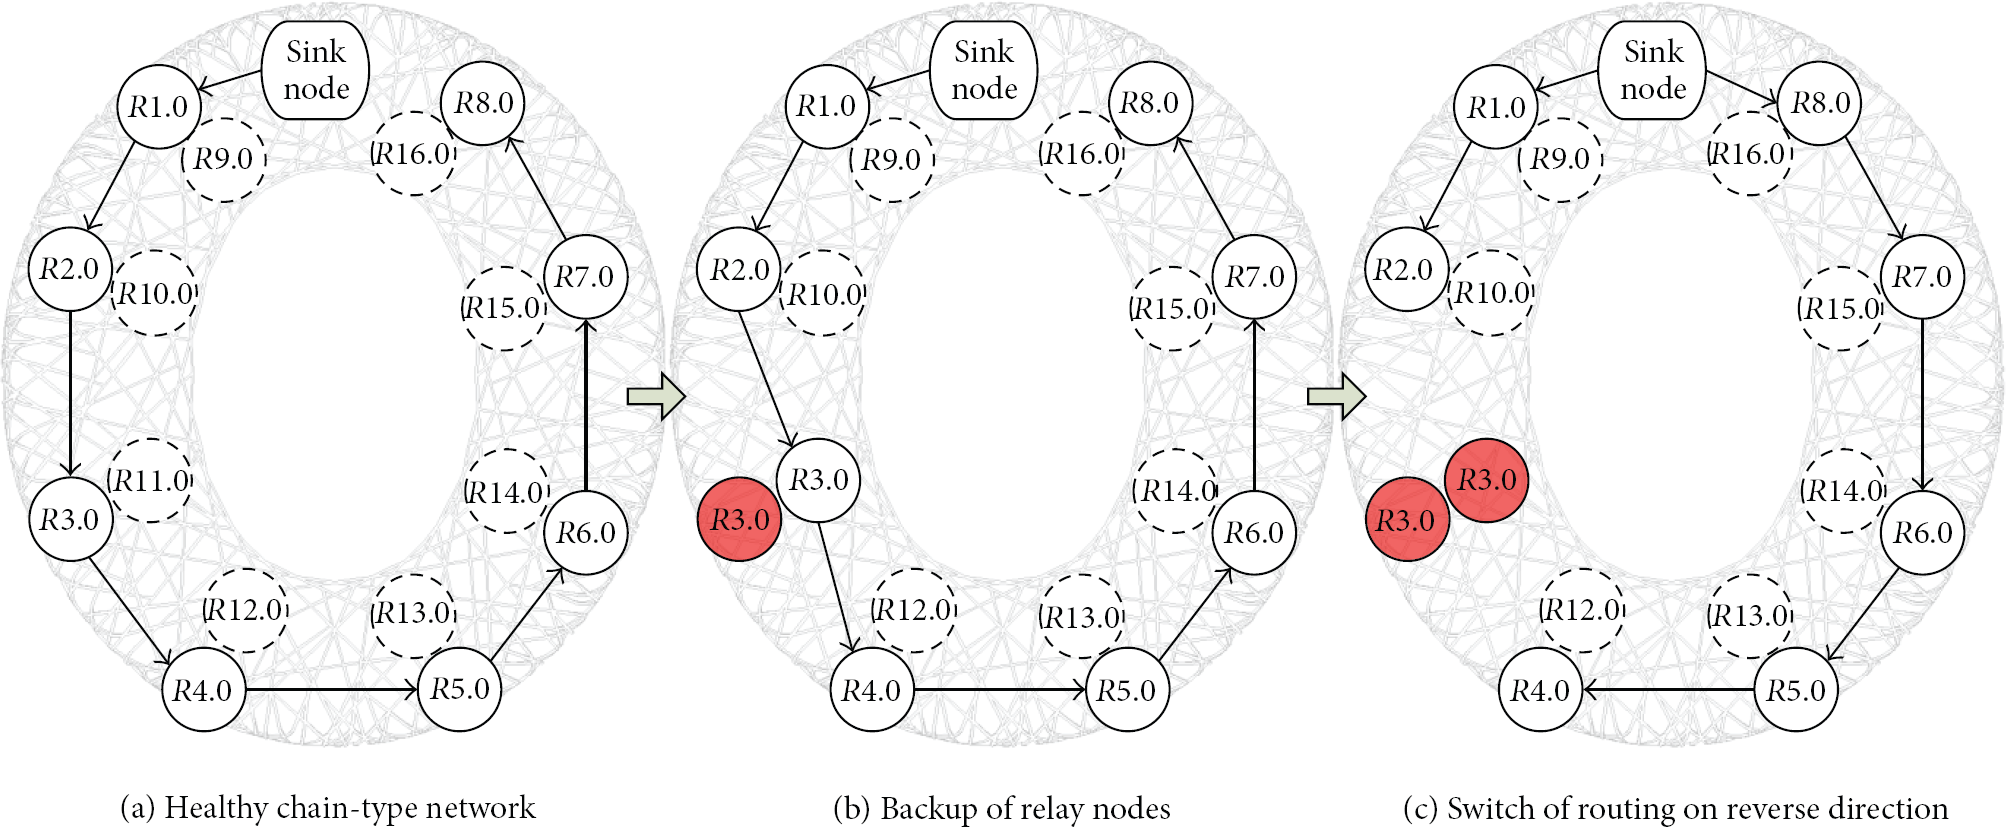
Robustness enhancement of the network.
Switch of Routing on Reverse Direction. In a chain-type network, if the last relay node is located in the signal scope of the sink node, the entire chain will form a ring. The routing order could be switched into a new one on the reverse direction. This approach is very suitable for stadium buildings such as “Bird's Nest” that has a ring shape on plan view.
Normally the chain-type network serves as regular way. When one of the relay nodes and its backup all have broken down, all relay nodes behind will switch their routing order and form another chain with the sink node, as shown in Figure 13(c). That means altogether two communication chains are set up to keep the system working except the piconet of the broken node. Therefore, the robustness of the network has been largely improved.
3.3. Application
In the case of “Bird's Nest,” the structure has been divided into eight areas on plan view for eight piconets of the network. A relay node and a backup have been placed adjacently at the center of each area. As the root of the entire chain-type network, the sink node is in the middle of area 1 and area 8 on plan view. The field server device, a low-power industrial personal computer (IPC), receives data from the sink node. They constitute a base station together and can be controlled in various internet terminals. The base station is placed in an electrical room located on the upper level of the audience stands, which is below the steel roof and not so far from the first relay node. The layout of area division is displayed in Figure 14 and Table 2.
Distribution of sensor nodes in eight areas.


Layout of area division for chain-type network.
A graphical user interface (GUI) software has been developed for the utilization, as shown in Figure 15. All operations on WSN management including topology adjustment, ID address reassignment, and sampling execution, could be artificially controlled.

GUI software.
Various internet terminals of SHM system have been set up for system controlling, data sampling, and results display. The main monitoring center is located in Zhejiang University, as shown in Figure 16(a).

Various Internet terminals of SHM system. (a) The monitoring center in Zhejiang University. (b) The exhibition screen for visitors in field.
At the main entrance of “Bird's Nest,” there are also four exhibition screens displaying the statistics of the structure and environment with the latest graph. It serves as a view spot for visitors, as shown in Figure 16(b).
3.4. Workflow in Normal Process
For regular data sampling process, the first step is to wake up the relay nodes from 1.0 to 8.0 one by one by unicast way. If there is any one broken, the backup will be woken up to take over. For example, change the ID of 9.0 to 1.0. The second step is to wake up the sensor nodes and command them to start sampling in each piconet, respectively, by broadcast way. The broadcast will last 15 seconds for assurances of wakeup mode of all sensor nodes. After receiving the command of sampling, all sensor nodes start working at almost the same time. Various types of sensor nodes work by specified time and frequency, respectively, and the data are saved in their SRAMs automatically. The third step is to call back the data from the sensor nodes one by one through unicast way in each piconet. The sensor nodes will be altered back to sleep mode as soon as the data has been transferred. The last step is to turn the relay node into sleep mode one by one from 8.0 to 1.0. Then, an entire work process is completed, which usually lasts 10 minutes for such scale of a network. The work process can be artificially controlled or automatically repeated according to monitoring requirement.
4. Monitoring Data during One Year
A total of 290 sensors were installed on the stadium structure, collecting data via the WSN for more than one year. Huge amount of data have been obtained, including all kinds of parameters such as strain, temperature, displacement, acceleration, and wind. Take the data from May 1, 2011 to May 1, 2012 as examples, and the analysis work is briefly discussed in this section.
Data analysis results indicate that such super large-scale steel structure as “Bird's Nest” is not as tough as imagined and it is very sensitive to the temperature effect. To be specific, the stress and displacement variation of the structure are correlated with the temperature. Comparatively, the wind and vibration parameters did not show particular features, so they are only briefly discussed.
4.1. Temperature
In structural analysis work on temperature effect, normally only the annual range of temperature is considered. For a specific time, the environment of an entire structure is always considered as a unified temperature field. Take the monitoring data of one hot summer day like July 17th for example. It is obvious that the structural temperature of different locations at 2:00 PM is very different from the official data of 32.4°C, as shown in Figure 17(a). Most measuring points on beams have much higher temperature due to the direct sunlight. Only points on columns are consistent with air temperature because all of them are in shadow. While at midnight, the structural temperatures of all measuring points are relatively average but still a little higher than air temperature, as shown in Figure 17(b).

Hour-average temperature of each sensor at one hot summer day. (a) Hour-average temperature of each sensor at 14:00. (b) Hour-average temperature of each sensor at 00:00.
4.2. Stress to Temperature
The giant “Bird's Nest” consists of large amounts of steel tubes whose square-section measure 1 meter in side length and 40 mm in wall thickness. Supposedly, it is very rigid and can hardly be affected by conventional static loads. However, to the temperature effect, the rigidness is commonly not a beneficial factor on structural behavior. The monitoring data during one year also shows that the structure is very sensitive to temperature variation. As shown in Figure 18, take four measuring points on columns, upper-layer tubes, middle, tubes and lower-layer tubes, respectively, as examples. Obviously the stress variation is related to the temperature value, and the maximum value of the entire structure could be more than 25 MPa.
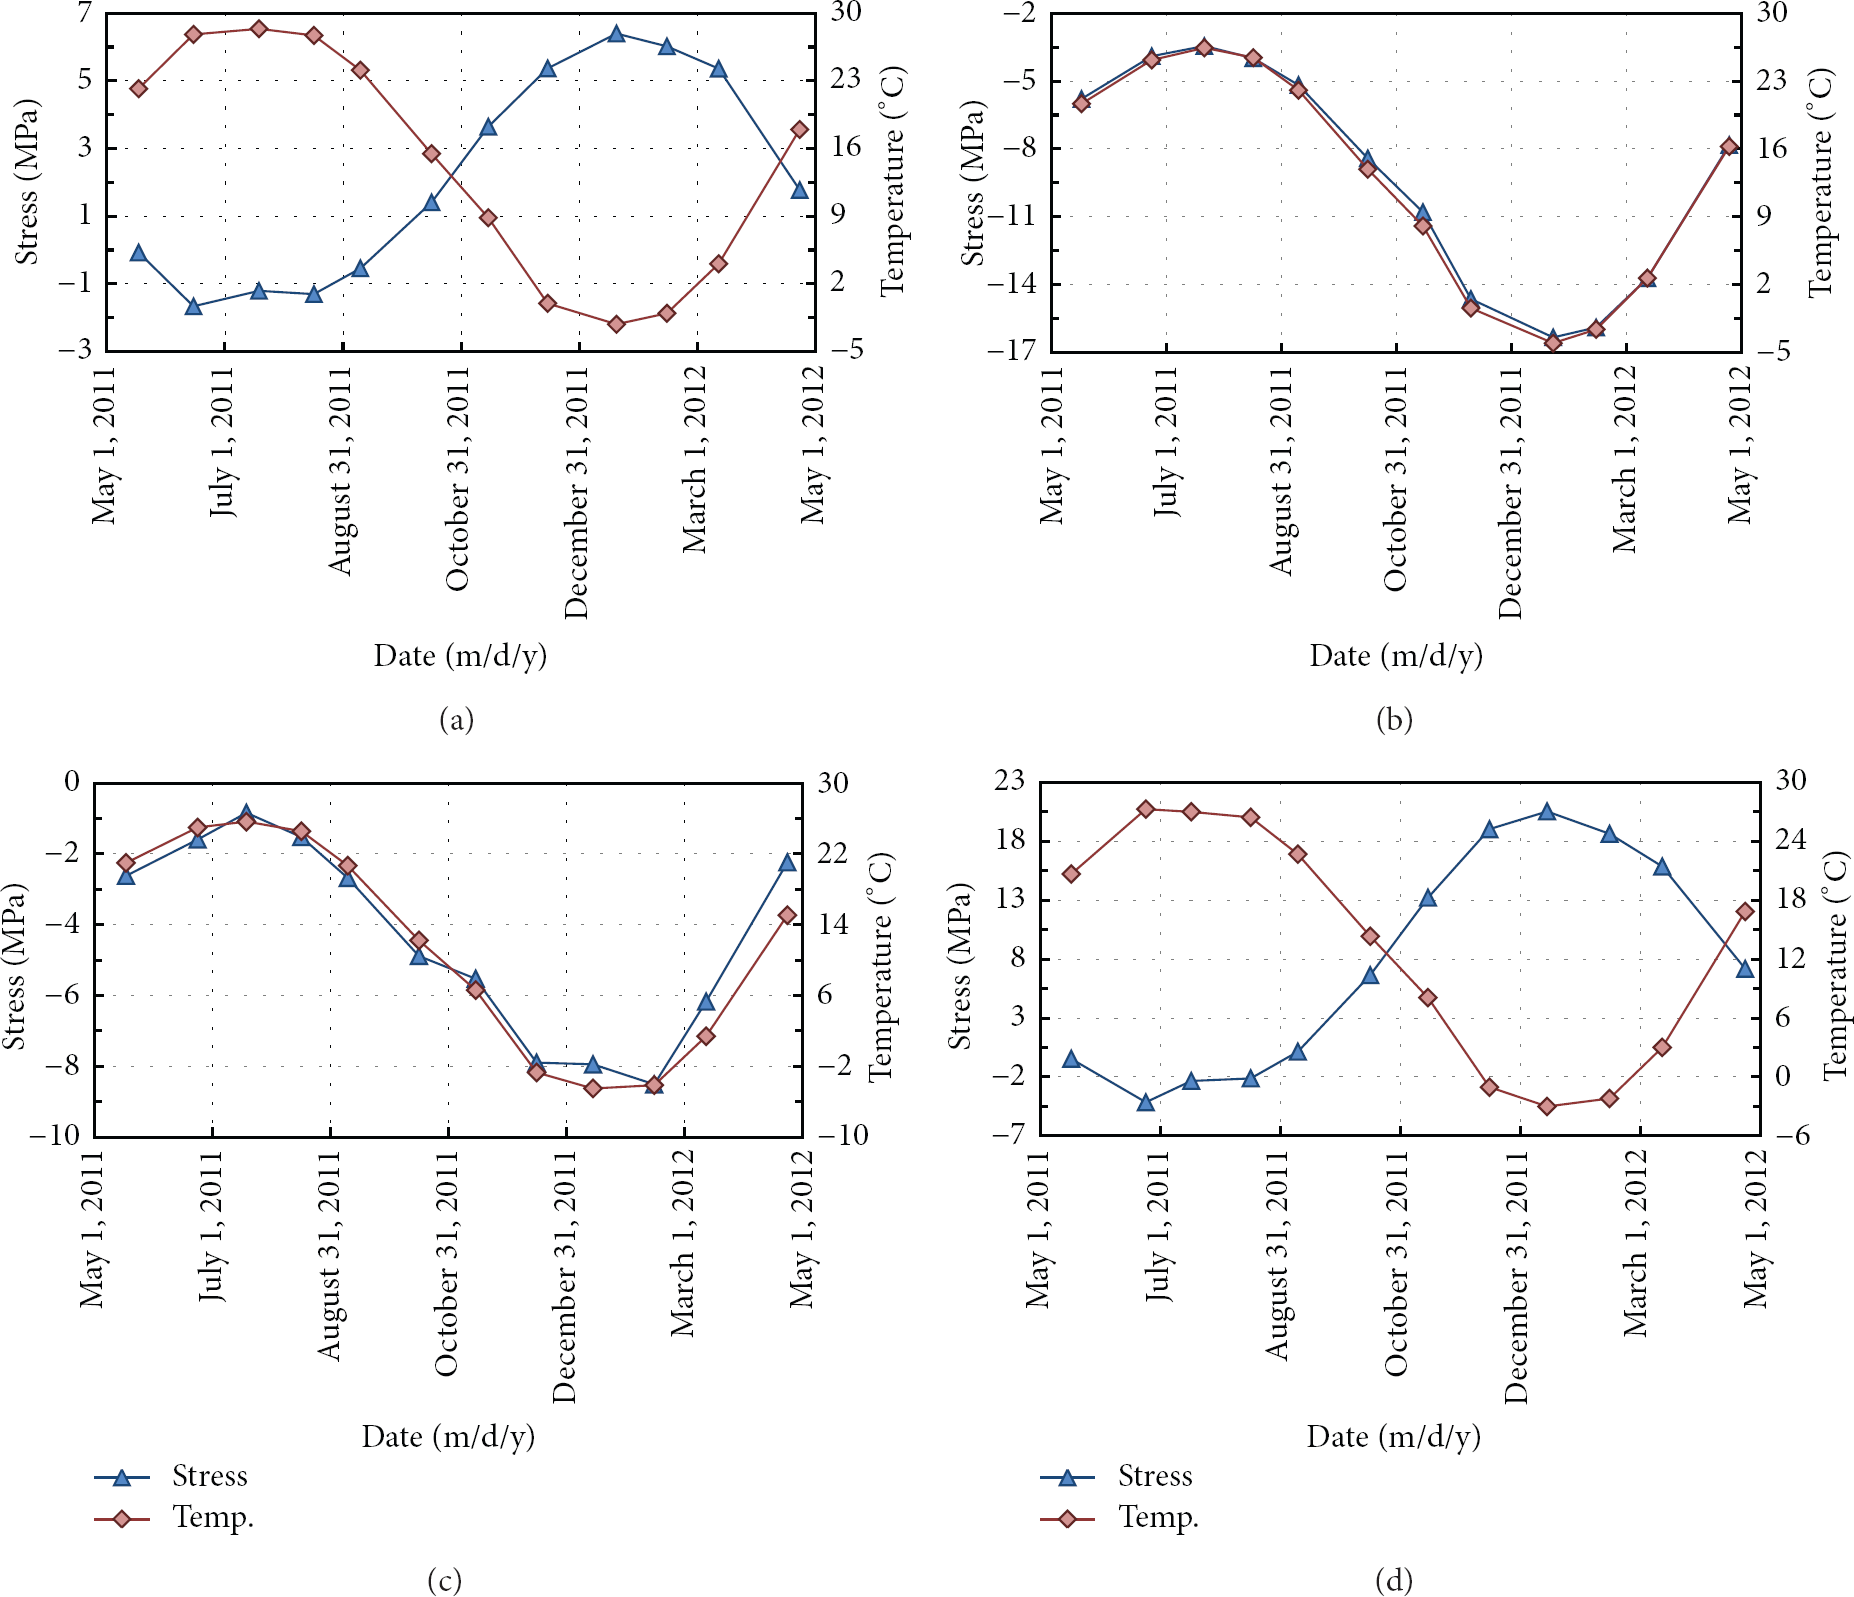
Stress variation to temperature effect during one year. (a) Sensor node 20 channel 4 at column tube. (b) Sensor node 56 channel 3 at middle tube. (c) Sensor node 8 channel 2 at upper-layer tube. (d) Sensor node 14 channel 1 at lower-layer tube.
4.3. Displacement to Temperature
Deformation of the structure is basically a reflection of stress distribution. From the measuring data of the displacement on cornice, it turns out that the expansion and contraction of the structure somewhat resemble the “breathing” pattern. In Figure 19, take the measuring point 1.95 of north cornice for example; the displacement value is also mainly related to the temperature variation. Specifically, the cornice moves up when the temperature increases, and the change rate is about 2.5 mm per degree Celsius.
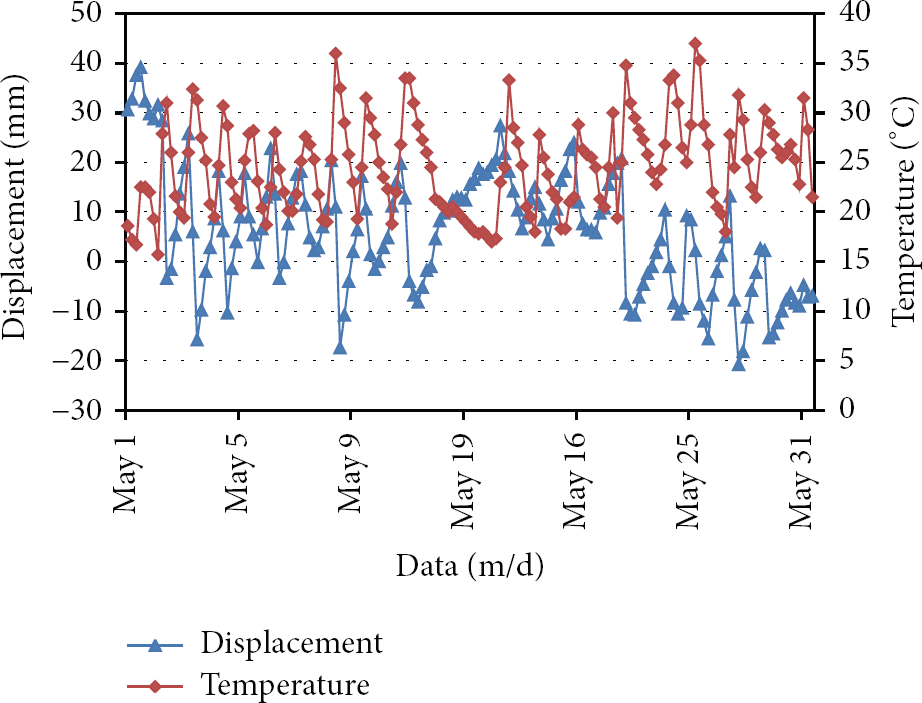
Displacement variation to temperature effect during one month.
4.4. Vibration to Performances
The acceleration data did not show particular features during regular hours. Only at the time of performances, the structure responds to the excitation from the audience and show. Take the data of sensor node 2.78 on April 16, 2012, for example, when there is a large concert performing from 18:00 to 23:00, as shown in Figure 20, six different time points of sampling data were displayed together, and it is obvious that the structure has stronger vibration during the performance time.

Acceleration of node 2.78 on a performance day.
4.5. Wind Velocity and Direction
The data of wind velocity and direction is also an integrated part of the whole monitoring database and displayable outcome on site. It helps managers and visitors to learn the latest wind load well. Take the data of node 1.91 and 5.94 on a random date like September 16, 2012, for example, 22 times of continuous data sampling during 220 minutes are displayed in Figure 21, and the direction is indicated via the wind angle in anticlockwise direction off the north. It turns out that the wind velocity and direction at different locations of the structure are not the same due to the effect from the building itself.

Wind velocity and direction variation during 220 minutes on September 16, 2012. (a) Wind velocity and direction variation of node 1.91. (b) Wind velocity and direction variation of node 5.94.
5. Conclusion
The national stadium of China, generally known as “Bird's Nest,” is deemed to be the symbol of super large-span structures in China. The integrated design and implementation of SHM systems for such an important civil infrastructure is very innovative and full of challenge. This paper introduces the development and application of a robust and efficient wireless sensor network system toward the structure. Taking the instrumented “Bird's Nest” as a testing ground, the authors hope to generalize certain norms for health monitoring of large-area-scale structures and narrow the gap between research and application. With the case study completed, some conclusions and recommendations are summarized as follows.
To meet the monitoring requirement of the “Bird's Nest,” the system takes multitype sensors as measurement components including stress, displacement, acceleration, wind, and temperature. In terms of hardware functional design, five modules are involved, namely, PM, RF, MCU, SRAM, and MTS. Advantages of such hardware includes (a) independent MTS module designed for multitype sensors in the same network; (b) rapid installation and low cost; (c) stable and accurate sensor measurement. Stability and durability are mainly considered on the WSN development for real-world application of such a super large-scale structure. The customized WSN has several features as follows: adjustable chain-type topology, artificial control work mechanism, and robustness enhancement. It has been proved that the network well satisfies the requirement of plenty multitype sensors working in a large-area distribution, and the data collection work has been carried out for more than 1 year up to now. The data analysis results reveal that the super large-scale steel structure is not as tough as supposed and it is very sensitive to the temperature effect. The variation of the deformation and stress are very relative to the temperature value, and the entire structure of “Bird's Nest” is expanding and contracting as if it were breathing.
Footnotes
Acknowledgments
The authors are grateful to the National Stadium Co., Ltd. for the financial support. The work described in this paper was also supported by the National Key Technology R&D Program (2012BAJ07B03), National Science Foundation of China (Grant no. 51178415), Qianjiang Scholar Foundation of Zhejiang province (2013R10038), and the Scientific Research Foundation for the Returned Overseas Chinese Scholars, State Education Ministry.