
Abstract
There is no standard testing method of the thermal physical properties of phase change materials (PCM). This paper has shown advancements in this field. Developments and achievements in thermal physical properties testing methods of PCM were commented, including differential scanning calorimetry, T-history measurement, the water bath method, and differential thermal analysis. Testing principles, advantages and disadvantages, and important points for attention of each method were discussed. A foundation for standardized testing methods for PCM was made.
1. Introduction
Energy conservation is an important area of research. Thermal energy storage [1, 2] is a practical and important prospect. Phase change materials (PCMs) are a series of functional materials with storing and releasing energy properties when the physical state changes, which can store a large amount of energy due to the latent heat of fusion [3]. Since the Eleventh Five-Year Plan of National Economic and Social Development, the new medium and long term plan to build a well-off society in an all-round way in China, our country has strived to develop energy-saving and environmental protecting industries which are resource-saving. The use of phase change materials in a building envelope [4] can lessen the impact of outdoor temperatures and associated heat fluxes, better maintaining the indoor temperature in a comfortable range [5–8]. The combination of PCM and a building envelope is gaining use as an effective way to improve building comfort, reduce energy consumption, and minimize environmental impact.
The thermal properties of PCM have become a focus of study. The optional PCM in an energy storage system has a large latent heat associated with phase change, minimal change temperature associated with phase change, and good heat transfer [7]. Evaluation of the thermal physical properties of PCM has been performed using different methods. Karaipekli and Sari [9] mixed erythritol tetrapalmitate (ETP) and erythritol tetrastearate (ETS) with building materials to make phase change materials. The thermal properties were tested using differential scanning calorimetry (DSC) and thermogravimetric analysis. DSC revealed that the phase change temperature was 21.6–32.3°C and the phase change latent heat was 35.9–43.3 J/g. Thermogravimetric analysis revealed that PCM had good thermostability, even after 1000 heat storage and release cycles. There have been some problems with the testing methods used to evaluate PCM. PCM absorbs and releases a large amount of latent heat during phase change. Using constant material properties testing methods to evaluate PCM, the results evaluated are very different from the actual properties. There are no international standards or test specifications in place to evaluate PCM. Current test methods include differential scanning calorimetry, differential thermal analysis (DTA), the water bath method, and T-history measurement.
We evaluated the testing principle, advantages and disadvantages, and points for attention of different testing methods for PCM in order to form a basis for standardization of PCM testing.
2. Thermal Testing Methods of PCM
2.1. Water Bath Method
The water bath method [10] was a widely used, simple, rapid testing method. Paksoy et al. proposed it in the 1980s [11]. The method evaluated phase change temperature and the thermal storage capacity of PCM.
(1) Testing Principle. The water bath method [10] determined the thermal storage capacity at any temperature range of PCM or its components. A constant temperature water bath was uniformly heated from T1 to T2 and the electric energy and heat losses were measured. The overall heat flux, Q w , was determined. A PCM sample was then placed in the water bath and the temperature allowed to equilibrate at T1. The bath was then heated to T2 and the electric energy and heat losses were measured. The energy required to heat the water and the PCM sample was then determined as Qw + pcm, and Qw + pcm minus Q w was the thermal energy required to heat the PCM sample from T1 to T2.
The energy balance equation in a uniform constant temperature bath was

where Q e was the total electric energy to heat the water bath, J; Q w was quantity of heat to heat the water alone, J; Q1 was the heat loss from the water bath surface during water bath heating, J.
The energy balance equation for the water and the PCM sample with uniform heating was
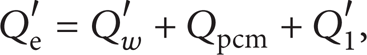
where Q e ′ was total electric energy used to heat the water bath and PCM, J; Q w ′ was the quantity of heat required to heat the water alone, J; Qpcm was the quantity of heat required to heat the PCM, J; Q1′ was the heat loss from the water bath surface during heating of the water bath and PCM, J.
If the water mass and temperature rise were the same for both heating processes, Q w ′ = Q w and

If Q e ′, Q e , Q1′, and Q1 were measurable, the thermal energy storage capacity of the PCM or its components was determined over the temperature range [T1, T2].
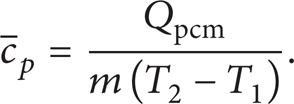
The heat capacity of PCM was calculated as

where m was the mass of PCM, kg;
The average specific heat capacity of PCM was defined as
(2) Testing Device. The experimental device consisted of a constant temperature water bath with a heater and stirrer. Three thermocouples were placed at different depths and in different areas of the bath. Figure 1 illustrates the experimental device.

The water bath method device.
A stirrer was used to maintain a uniform water temperature and facilitate heat exchange between the sample and the water. Thermocouples placed at different depths were used to measure the average temperature of the water bath. Heat flux slices were used to measure the heat losses during heating.
(3) Influencing Factors and Points for Attention. The water bath method measured the latent heat of fusion during heating. Samples tended to heat unevenly, resulting in measurement error. Heat losses were measured by heat flux slices placed on the top side and bottom of the bath. The calculation of the heat loss was affected by differences in the wall heat flux density at the start and during heating, leading to measurement error.
(4) Testing Examples. Paksoy [11] determined the solid-liquid phase change enthalpy and the specific heat capacity of paraffin, high density polyethylene, zinc nitrate tetrahydrate, and ethylene using the twin water bath method. When the two bath experiment conditions were identical, the phase change enthalpy was the heating difference between the PCM sample bath and the reference bath. Ye et al. [12] used the water bath method to evaluate a stable PCM. The difference in the thermal storage capacity of PCM measured using the water bath method and the DSC method was less than 2%. Zhang et al. [13, 14] designed a bath calorimetric device to test the specific heat of copper and water at different temperatures and the solid-liquid phase change enthalpy of ice. This method was useful for evaluating the thermal physical properties of PCM within a room temperature range.
2.2. T-History Measurement
Zhang proposed the T-history test in the 1990s to measure the latent heat, specific heat, and thermal conductivity of PCM [15]. The experimental conditions of this test were relatively strict. In contrast to the water bath method, the T-history measurement accounted for the effect of supercooling. The phase change materials or the components tested were required to melt to the liquid state and have a Biot number less than 0.1. The lumped heat capacity method was used to analyze heat transfer and the results obtained were accurate enough for engineering needs.
(1) Testing Principle. The T-history measurement [16, 17] was used to determine the freezing point, specific heat, latent heat, thermal conductivity, and thermal diffusion coefficient of PCM. In this method, one glass test tube was filled with the phase change material and a second with a reference material (generally pure water). Both materials had the same mass and were heated to a temperature T0, where T0 > T m (T m was the phase-transition temperature). When the temperature of the two materials reached T0, the test tubes were suddenly exposed to the temperature T a (T a < T m ) and allowed to cool. If the material had a phase change, a typical T-history curve was seen during cooling (Figure 2). The curve for water during the cooling process was also obtained (Figure 3). The thermal physical properties were obtained from the thermodynamic equations that describe the two cooling curves.

A typical modified T-history curve for PCM during cooling.

T-history curve of water during cooling.
The Biot number was defined as B i = hr/2k, where r was the test tube radius, k was thermal conductivity of the PCM, and h was the atmospheric free convection heat transfer coefficient. When the Biot number was less than 0.1, the distribution of temperature in the tubes was considered to be homogeneous and the lumped heat capacity method was used to analyze heat transfer. The energy equations that describe this were

The latent heat of the PCM was described by

where
(2) Testing Device. The experimental device consisted of a test part and a data acquisition part. The heating equipment was a flume that provided a constant temperature water bath to absorb heat from or release heat to the test tubes. A PCM sample and water or some other comparison materials were placed in each of the identical two tubes. The temperature probes were located in the sample and reference material and connected to a thermocouple for online monitoring (Figure 4).

T-history measurement device.
This device was convenient and simple to operate. The device allowed measurement of several materials at the same time. The number of materials depended on the size of the water bath and the number of acquisition channels in the collection system.
(3) Influencing Factors and Points for Attention. The sample used was small, only a few grams. The sample was fragmented in order to obtain even sample heating. These fragments did not reflect the actual thermal physical properties of the sample, introducing error to the measurement. The uneven distribution of tube materials in the water bath leads to uneven temperature distribution in the test tube when the water bath was heated. This introduced additional measurement errors. The speed of heating and cooling influenced the accumulation and release of heat from the sample, affecting the results.
T-history measurement was performed under specific conditions. (a) Experimental conditions: the thermodynamic equation for the lumped heat capacity method was only valid when B i < 0.1; hence calculation of the experimental constants before testing was necessary to determine if the test was valid. (b) Temperature selection: the best cooling curve was obtained when the heating temperature was higher than the phase change temperature and the cooling temperature was lower than the phase change temperature.
(4) Testing Examples. Zhang et al. [18] described the principle and experimental device used for T-history measurement. The thermal physical properties of water, salt, lipid acid, paraffin, and PCM measured with this device were close to the literature values. The experimental principle, device, and operation were simple. The test process was easy to perform, but the experimental device had a great effect on test results. Zeng et al. [19] tested the latent heat of n-octadecane (C18H38) and its phase change using T-history measurement and DSC. There was less than a 5% difference in the two methods findings. Testing a microcapsule suspension of n-octadecane, however, resulted in a larger difference.
These findings demonstrated the effect of material structure on test results. Lázaro et al. [20] described and tested a proper methodology to perform testing and analyze data using standard materials with known properties. Hong et al. [21] measured the latent heat and specific heat of PCM with a lower melting point than room temperature (low-PCM) by modifying the original T-history method. Unfortunately, the melting velocity of the PCM varied over the specimen, adversely affecting the results.
2.3. Differential Thermal Analysis (DTA)
Differential thermal analysis was the most studied and earliest thermal measurement technology used. The differential thermal analyzer was a laboratory device with poor sensitivity and accuracy before the 1950s [10]. The device was subsequently automated and miniaturized. The DTA method had a wide temperature measurement range, from −180°C to 2400°C. DTA at high temperatures required uniform heating, sample symmetry, and sample equivalence in weight in order to obtain high sensitivity.
(1) Testing Principle. Differential thermal analysis [22] measured the temperature difference between PCM and a reference material when they were both subjected to the same heat load. The two were compared using a temperature or time control program. This method was used to measure the specific heat capacity and phase change latent heat. The basic principle is shown in Figure 5. When the PCM and the reference material absorbed the same quantity of heat, their temperature changes were different because of their different thermal properties. PCM were evaluated by measuring the temperature difference of the two. Figure 6 shows the temperature rise curve and DTA curve and T w was the furnace temperature. Figure 7 shows the DTA temperature difference curve.

The basic principle of DTA.

The temperature rise curve and the DTA curve.

The DTA temperature difference curve.
The enthalpy difference caused by heating was

So,

where S was the area under the curve and h T was a heat transfer coefficient. h T was related to experimental conditions, reaction temperature range, geometric shape of the holder, and other operative characteristics. This number was calculated when measuring the quantity of heat delivered.
When heating a solid or nonvolatile liquid sample under constant pressure, the total heat capacity of the sample C s was defined as

where m s was the mass of the PCM, kg; c p was the specific heat capacity of the PCM, kJ/kg·k; C0 was the heat capacity of the sample tray, kJ/kg·k.
If the reference material tube was empty, the specific heat capacity of the PCM was

where ε was the rate of temperature risen.
(2) Testing Device. The experimental device consisted of a test part and a data acquisition part. This included a crucible, thermocouple, differential thermal amplifier, and recorder. The PCM and the reference material were each placed in a crucible. Below the crucible was a flaky galvanic and two thermocouples with opposite polarities. A temperature difference in the PCM and the reference material occurred when the PCM temperature reached its melting point. The two thermocouples measured the temperature difference in the form of a potential difference and transmitted the result to a differential amplifier. This was transmitted to a recorder as the DTA curve. The experimental apparatus is shown in Figure 8.

DTA device.
(3) Influencing Factors and Points for Attention. The main influencing factors were (1) the instrument factor, including the heating method, the thermocouple type, the location of the thermocouples used to measure temperature, and the status of electronic instrument. (2) Experimental conditions: the rate of temperature change affected the DTA curve. The faster the rate of temperature, the lower the resolution. (3) Influence of the sample: there was generally better resolution and less baseline drift of the DTA curve with smaller samples. Samples that were too small and had poor resolution.
Points for attention are as follows (a) The use of a flat thermocouple reduced error caused by the temperature measurement device. (b) Controlling the rate of heating improved resolution. (c) Select a suitable sample size, considering from a physicochemical point of view that small particle size has large surface area and is conducive to the reaction, but for the participation of a gas, it is susceptible. (d) A reference material with similar thermal conductivity as the PCM was selected in order to obtain a baseline curve near zero.
(4) Testing Examples. Jiao and Ding [23] tested the thermal properties of myristic-palmitic acid/bentonite composite materials using the DTA method. There was little variation in phase change temperature and latent heat of PCM after 800 phase change, cooling-heating cycles. Gasior et al. [24] reported the thermodynamic evaluation of the Cu-Li phase diagram using EMF measurements and DTA. Kuang [25] evaluated the phase change of glass with DTA. Huang et al. [26] used this DTA method to improve measurement of the change in nucleation rate with temperature during glass crystallization and proved it by solid phase change theory.
2.4. Differential Scanning Calorimetry (DSC)
Differential scanning calorimetry was developed in the 1970s [7]. There were several differences between DTA and DSC. DTA recorded the temperature difference between the reference and the sample. This difference was caused by the change of heat capacity associated with the phase change. DTA recorded temperature (time) as the abscissa and the temperature difference between the reference and sample as the ordinate. DSC recorded the difference in heat absorbed between the reference material and the PCM when both were kept at the same temperature. DSC recorded temperature (time) as the abscissa and heat quantity difference as the ordinate. In DSC testing, the temperature difference between the two materials was zero, so there was no heat transfer. For this reason, DSC was more accurate than DTA. In DTA testing, an appropriate reference material was needed to convert the peak area to a heat quantity. DSC measurements were performed at temperatures less than 700°C, while DTA was performed at temperatures above 700°C.
(1) Testing Principle. There are no national standards for DSC. Measurements were mostly based on GB/T 22232-2008 (the test method for the thermal stability of chemicals using differential scanning calorimetry). DSC [22] was a thermal analytical technique that used temperature control to measure the relationship between temperature and energy absorbed by the reference sample and PCM. DSC was used to measure enthalpy and specific heat capacity. There were two types of DSC, power-compensation DSC and heat-flux DSC [27, 28].
Power compensation DSC measured the power difference needed to maintain the reference sample and PCM at the same temperature. This was described by
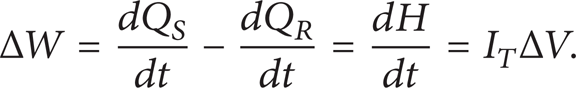
The enthalpy change per unit time was described by

where ΔW was power difference required, W; Q S and Q R were the quantity of heat absorbed by the PCM and reference material, J; dH/dt was the enthalpy change per unit time (rate of heat flow), J/s; I T was the total current, A; ΔV was the voltage difference, V.
Heat-flux DSC measured the temperature difference between the reference sample and PCM heated with the same amount of power. The temperature difference was converted to a heat flux difference using the heat-flow equation and heat flux difference.
ΔT was proportional to the heat flux difference and was described by

where R was the sample and reference arm resistance, m2·k/W; R b was the bridge heat resistance, m2·k/W; R g was the heat leakage resistance, m2·k/W; i S and i R were the sample and reference material heat-flux, W/m2 (obtained using Kirchoff's thermal equivalent law).
Enthalpy Measurement. Differentia scanning calorimetry directly recorded the heat flow over time. The area under the curve was proportional to the heat transferred. The DSC curve was constructed using temperature as the x-coordinate and heat-flux as the y-coordinate (Figure 9).

A typical DSC heat release curve.
Specific Heat Capacity Measurement. The rate of heat-flux dH/dt was proportional to the sample transient specific heat capacity. The PCM specific heat capacity c p was calculated by

where c
p
was the PCM specific heat capacity, J/(kg·k);
(2) Testing Device. Differential scanning calorimetry consisted of a detecting chamber, a container, and a balance. The detecting chamber was the core component of the differential scanning calorimeter that provided the basic environment for testing. A sensitive temperature sensor and differential sensor in the detecting chamber operated over a large range of temperature rate, ensuring minimal detection error. The detection chamber should have some instruments to maintain indoor inert or active gas environment. The recording instrument was adjusted to optimize the signal to noise ratio. The temperature was plotted on the x-coordinate and the associated heat difference on the y-coordinate. Figures 10 and 11 illustrate the device.

Power compensation DSC.

Heat flux DSC.
Differential scanning calorimetry was a mature device with a wide temperature range, high resolution power, and high sensitivity. Its operation was simple, data collection and analysis were straight forward, and presentation of the DSC curve with a computer was easy.
(3) Influencing Factors and Points for Attention. Factors that influenced DSC were as follows. (1) Experimental conditions: heating rate affected temperature distribution uniformity. Gas composition and pressure in the detecting chamber affected heat accumulation and release. Accurate measurement of the sample mass was important. (2) Sample characteristics: the mass of sample needed to be small enough so there was not a large energy release associated with phase change. PCM sample masses were usually 1–50 mg. The PCM sample had a representative geometrical shape, particle size, and purity. (3) Reference materials: there should not be any heat exchange within the experimental temperature range. Typical reference materials included calcined alumina, glass bead, silicone oil and an empty container. (4) Other factors: instrument rectification is included.
Special attention was needed to several points. (a) Sample selection: DSC required small samples, only a few mg. Consequently, sample selection played a vital role in thermal property testing. Samples with a representative size and purity were chosen and accurately weighed. (b) Control of temperature change rate: a slow rate of heating was used so the temperature distribution in the sample was even and the sample would not overheat. (c) DSC was suitable for evaluating solid materials that are relatively unconsolidated.
(4) Testing Examples. Alkan et al. [29] measured the thermal physical properties of different PCM and PCM microcapsules using DSC. But the test method was single and the result had no reference. He et al. [30] measured the latent heat of a mixture of n-tetradecane and n-hexadecane using DSC. It was difficult to assure the proportion of these two alkanes consistent with proportion of the whole material. A. A. Aydin and A. Aydin [31] used DSC and other methods to obtain the phase change temperature, enthalpy, and specific heat of a series of high-chain fatty acid esters of 1-hexadecanol. These materials were found to be favorable for low temperature heat transfer applications. Xia and Zhang [32] studied the thermal properties of acetamide and acetamide/expanded graphite composite phase change material using DSC. The results were similar to published values.
3. Advantages and Disadvantages of the Testing Methods
Table 1 shows the test results of the four methods. DSC and DTA could be used to test PCM but could not test phase change components. Parameters evaluated included specific heat capacity, phase change range, phase change latent heat, and degree of supercooling. T-history was used to evaluate six PCM thermal parameters including thermal conductivity, thermal diffusivity, specific heat capacity, phase change range, phase change latent heat, and degree of supercooling. But this method could not test phase change components directly because the components need to crush into the liquid state first. The water bath method was used to evaluate both PCM and the phase change components. Four thermal parameters including specific heat capacity, phase change range, phase change latent heat, and degree of supercooling were evaluated with this technique.
Test results.

(Available-Y/unavailable-N).
T-history was used to evaluate of most the parameters. The water bath method was used to evaluate phase change components, but only over a small temperature range. The test methods operational temperature ranges are shown in Figure 12 and it includes all the phase change materials currently used.

Temperature range of the test methods (1. salt hydrates, 2. methane hydrates, 3. fatty acids, 4. paraffin, 5. inorganic salt compounds, 6. alcohol sugars, 7. nitrates, 8. hydroxides, 9. chlorides, 10. silicates, and 11. fluorides).
We can see that DTA had the widest temperature test range and could be used to evaluate all the PCM. DSC also had a wide temperature test range but could not be used to evaluate some silicates and fluorides. The use of an oil bath increased the temperature range of the T-history temperature test range to −20–180°C. Paraffin, fatty acids, and inorganic salts were used as their melting point was in the temperature test range. The water bath method's temperature test range was the narrowest. It could only be used to test PCM with a phase change temperature between 0–100°C.
Table 2 shows the advantages and disadvantages of the four testing methods. The analysis principles, devices, and scope of the methods are presented.
Comparison of the methods.

4. Conclusions
We analyzed the testing methods used to evaluate PCM and discussed their applications and the advantages and disadvantages of each method. Important experimental design and implementation points were described. DSC used a small sample and had a wide temperature test range. Testing was fast and accurate. The sample was so small and there were supercooling and precipitation problems. The water bath method's principle and device were simple and rapid and could test PCM components. There were problems related to uneven heating. T-history measurement was able to determine more thermal parameters. DTA had the largest test temperature range.
PCM with a phase change temperature above 750°C could only be evaluated with DTA. A disadvantage to this was that quantitative DTA was not accurate.
DSC had the best precision with small samples having uniform granularity and simple structure and composition. T-history measurement was used with materials that are relatively unconsolidated. The water bath method was fast and simple and was easily performed in the lab. Materials with a high phase change temperature were evaluated with DTA. When practical, two or more methods were used to compare results.
Footnotes
Acknowledgments
The work described in this paper was supported by the Program for International Science & Technology Cooperation Projects of China (no. 2011DFA60290), the National Key Technology Research & Development Program of China (no. 2011BAE14B06-07), and the National Natural Science Foundation of China (no. 51378025).