
Abstract
Due to the high growth of social economic activities and the increased need for mobility in recent days, transportation problems like congestion, accidents, and pollution have been increased. However, improving the reliability of delay estimates and real-time dissemination of information remains a challenge. An advanced border-crossing system corresponding to the changes of cross-border circumstances becomes an urgent matter. An automated system for queue end monitoring has been proposed using image processing based transformed domain and empirical mode decomposition (EMD) feature extraction systems. The performance of feedforward backpropagation algorithm artificial neural networks (ANNs) was evaluated and tested, based on a selected set of features. The experimental results showed that the use of discrete wavelet transform (DWT) based Daubechies with decomposition of level 2 has accomplished the target with a processing time 2 sec and 3 epochs of training network only with best validation performance of (2.1053e-007) for vehicle recognition. Also the use of EMD as a feature extractor has accomplished the target of vehicle recognition with a best validation performance of (about 3.42e-09) and a processing time of 1 sec at epoch 3 of training network only with a minimal percentage of error for the recognition of each vehicle in the appropriate queue with the aid of the new concept of road side unit (RSU).
1. Introduction
Intelligent transportation systems (ITS) offer potential solutions to growing congestion problems in major urban areas because of increasing mobility demands which has directly adverse effects on level of service, transportation costs, commerce, tourism, and the environment. Intelligent transportation system involves the use of IT and technology such as image processing and artificial neural networks for solving transportation problems.
In this paper, we propose a novel ITS that aims at estimating the waiting times of vehicles stuck at “traffic buildups.” These buildups happen, for example, at traffic signals, border crossings, and “work zones” on highways and arterials. The estimation of this “waiting time” enables ITS applications and enables taking actions to mitigate issues related to environment, international trade, and safety. For example, reducing queue length at traffic signals cuts down significantly
We propose a cost-effective infrastructure-based system that detects accurately and dynamically vehicular waiting times at such queues. The system requires the deployment cost-effective roadside units (RSUs). RSUs are used as vehicular sensors. We calculate the vehicular waiting time through coordinating the RSUs operations and exchanging information. Each RSU has a consumer-grade equipment of a camera and a wireless communications module (e.g., Wi-Fi module). The system relies on processing individual images (not videos) taken by the cameras of RSU. The RSU uses artificial neural networks (ANNs) to identify vehicle and RSU wireless communications (e.g., Wi-Fi module) to exchange information with other RSUs to enable the calculation of vehicular waiting times.
The rest of this paper is organized as follow. Section 2 is literature review; Section 3 is the appropriate proposed system with respect to its composition and mechanism; Section 4 introduces feature extraction using transformed domain algorithms; Section 5 introduces the empirical mode decomposition algorithm; Section 6 introduces the backpropagation feedforward artificial neural network for the recognition; Section 7 introduces the basic idea for calculation the waiting time; Section 8 experimental results; and Section 9 is conclusion and future work.
2. Literature Review
Previously proposed systems involve many technologies such as video image processing (VIP), wireless sensor networks (WSNs) as a road sensors. For examples advanced warning system (AWS), which was designed as an automated system to improve tunnel safety, reduces the potential for both primary and secondary collisions, as well as reducing incident response times producing an incident management system [1, 2]. The system has some key objectives: (i) provide means of automated real-time advance notice to motorists entering the tunnel of queues or lane blockages that may be beyond their sight depending on video frames, (ii) provide means of automatic dissemination of information on overall system events preferably via automatic email, and (iii) provide means of remote Ministry LAN access to monitor and manually override when required [3]. The main advantage in our proposed system is the use of small number of images in the recognition process instead of videos; also, we focused on the recognition with a small number of salient features. For our proposed system, state-of-the-art deployments rely on an imaging camera to collect traffic flow information for measuring queue length and estimating delay based on that. For example, a camera uses an ultrasonic vehicle detector that detects vehicle presence by the time difference of the reflection of ultrasonic wave fired from above the road surface to just under it. The number of passed vehicles in a unit time is used to calculate queue length and delay. Another example is an ITV camera that can be installed along the side of the roads or at light posts at road intersections. The images taken by this camera are processed and features are extracted to calculate queue length. The camera is installed to cover a specific road area (of around 150 m of road length). More expensive cameras will be able to cover larger areas. However, a single camera generally has a poor visibility [4]. Our proposed system has the following advantages: (i) a highly efficient and real-time system is achieved through in-network processing of real-time individual images as opposed to videos which affects directly it is processing time and communication speed; (ii) cost effective as RSUs are built using consumer-grade technologies and open source tools and (iii) it is highly reliable as there is no single point of failure (i.e., a centralized server) in the system. Data processing is performed at many RSUs. The failure of an RSU does not affect the operation of the system significantly.
3. The Proposed System
Figure 1 shows the main components of a deployment of the proposed system and practical aspects of its deployments. There are 3 main stages: (i) data acquisition system and it is responsible for capturing vehicle images of the queue of interest using camera module which connected to each RSU unit; (ii) feature extraction stage and it is responsible for extracting the most salient features in each image using transformed domain features such as discrete Fourier transform (DFT), discrete cosine transform (DCT), and discrete wavelet transform (DWT) based Daubechies mother function; and (iii) recognition using ANNs feed forward backpropagation algorithm.

Main components of deployment.
The system is composed of RSU deployed on the side of roads in areas around border crossing, checkpoints, or highway work zones. RSUs can be programmed to operate as data sensors. Each RSU is configured to run the OpenWRT (http://www.openwrt.org/) Linux distribution for embedded devices. OpenWRT is a Linux distribution that provides a Software Development Kit (SDK) that is used to compile custom code into a package to be installed on different RSUs.
For the purposes of detecting waiting time, we interface cameras to RSU through USB ports. We extended the camera software required to drive hardware modules. With this setup, each RSU, and its attached camera, is controlled to take snapshots of vehicles on the road. RSUs process the images taken, as described below, to detect vehicles through a feature extraction module. RSUs communicate amongst themselves using Wi-Fi to forward data related to traffic queues and vehicle waiting times. This augments each RSU with spatial and contextual characteristics of surrounding environments as explained below. This wireless infrastructure enables routing of information in a multihop manner.
An RSU is a stationary access points of a wireless mesh network typically deployed in a stationary manner. RSU exchanges data packets over, possibly, mobile multi-hop. We use optimized link state routing (OLSR) as a proactive routing protocol that maintains an up-to-date routing table. APs exchange OLSR HELLO messages periodically to build and maintain this table. This dynamic method of building the table enables APs to self-configure themselves to establish a WMN. HELLO messages advertise the one-hop interfaces of each AP. The periodic exchange of HELLO messages also enables the WMN to recover from a failed link or node. The system architecture does not require all RSUs to be connected to the Internet.
In general, a special type of RSU, called gateway, allows integration with other network types (e.g., Internet). The gateway receives/forwards the information using TCP/IP on the Internet where packets are rerouted to reach the Server. RSU and gateways self-configure themselves to identify their roles.
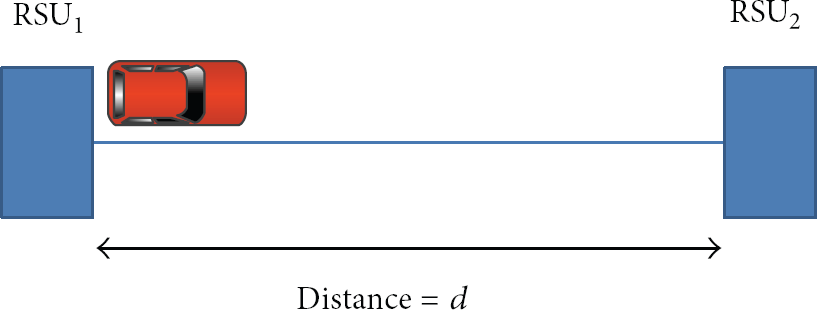
For example in Figure 2, the three vehicles, red, followed by a green vehicle, followed by blue vehicle, constitute a platoon. RSU1 through its installed camera captures image of the vehicular platoon which is to build an ANNs. Information of the resulting structure of trained ANN is forwarded to RSU2. RSU2 takes images for vehicles. Each image is processed by the trained ANN until the platoon of vehicles is detected and recognized. The process is repeated for RSUs down the road. Knowing the distance between RSUs and assuming time synchronization between the RSUs, the travelling speed, and waiting times of vehicles can be estimated and calibrated.

System deployment.
An important design parameter is the use of an NN-expiration timer. The trained NN is considered useless after the expiry of this timer. In the previous example scenario, RSU2 (or the RSU downstream) cannot continue looking for the platoon forever.
This can be due to cars in the platoon changing their positions (e.g., blue vehicle followed by red and then green). This may cause the NN not to recognize the platoon. The expiry timer resets the algorithms and gets the RSU to restart image capturing, feature extraction, and platoon recognition.
This does not affect the overall ability of the system to estimate waiting times as this ability depends on averaging the waiting time for many images taken over a specific period of time. If one or two failures occur, then this should not affect the overall average. In addition, our objective is to estimate waiting times in terms of minutes and accuracy (on the scale of seconds) is of not much relevance to our objectives.
Default case is that RSU1 sends a trained NNs to RSU2 to start recognition process but in case that RSU2 has started a failure situation due to any technical reasons (S/W or H/W failure), then RSU1 automatically resent NNs to the most prior RSU module (the RSU module in the direction of queue). In our case, if RSU2 has failed, then RSU1 resent trained NNs to RSU3 not RSU0 as shown in Figure 3.
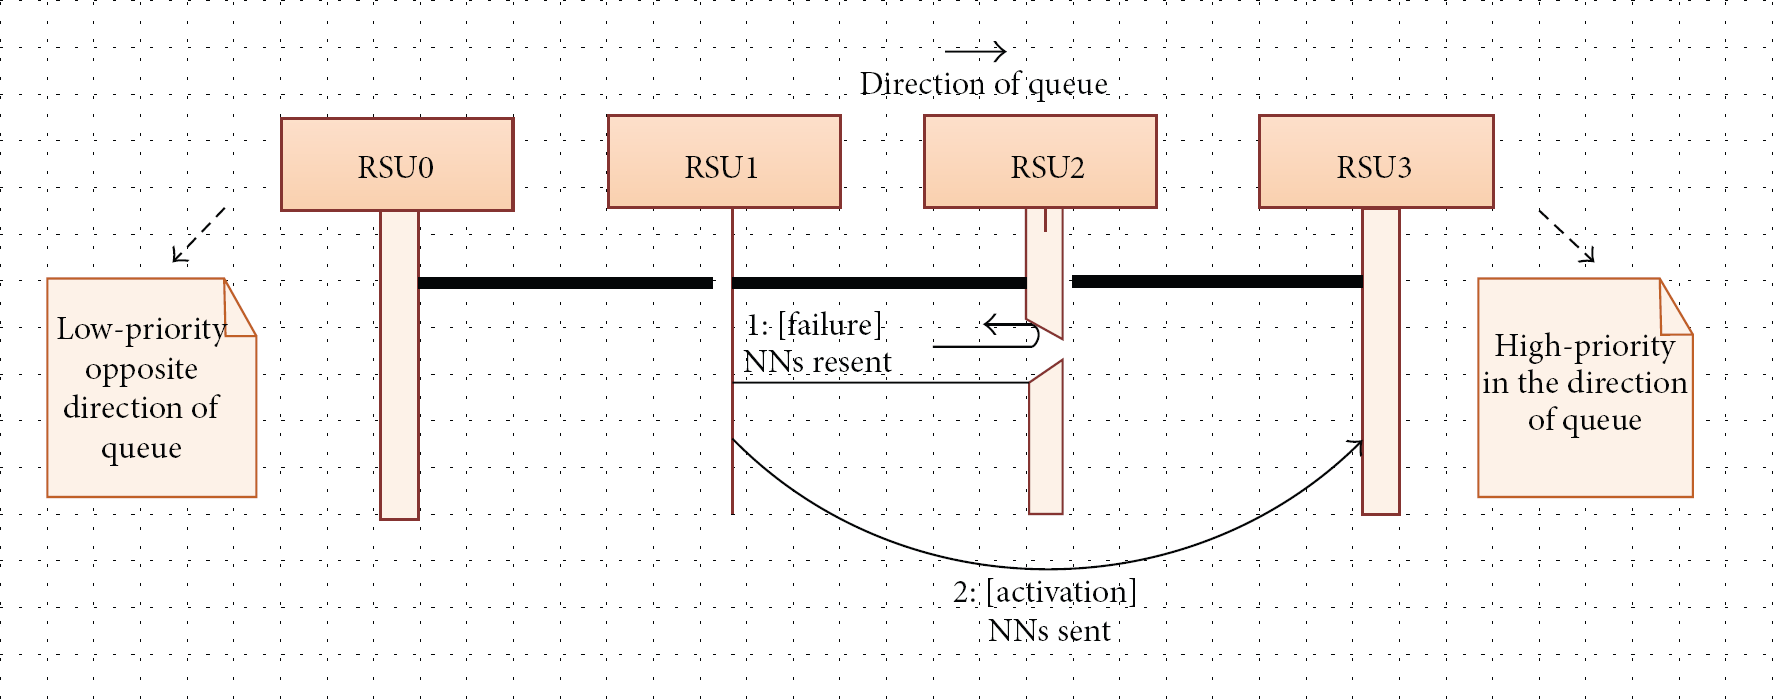
RSU unit failure scenario.
4. Image Processing and Feature Extraction Using Transformed Domain (Frequency and Wavelet Domain)
In the proposed system, transformed domain based feature extractor with 3 categories has been manipulated: (i) discrete wavelet transform (DWT), (ii) discrete cosine transform (DCT), and (iii) fast Fourier transform (FFT) as a good representation for the Discrete Fourier Transform (DFT). For FFT, DCT, and DWT, we have the following mathematical assumptions.
Each vehicle image is a 2D matrix which can be expressed in spatial domain as a matrix of size
x or
[
A DFT decomposes a sequence of values into components of different frequencies. This operation is useful in many fields but computing it directly from the definition is often too slow to be practical. Fast Fourier transform (FFT) is a way to compute the same result more quickly, so FFT is an efficient algorithm to compute DFT [5]. 2-D FFT for each vehicle image is calculated through the following equation:

A DCT expresses a sequence of finitely data points in terms of a sum of cosine functions oscillating at different frequencies. The DCT, and in particular the DCT-II, is often used in image processing [6]. The DCT is given according to the formula of the following equation:
DWT has gained widespread acceptance in image compression. The most commonly used wavelets were formulated by the Belgian mathematician Ingrid Daubechies in 1988. This formulation is based on the use of recurrence relations to generate progressively finer discrete samplings of an implicit mother wavelet function [7].
The DWT of each vehicle image is calculated by passing it through a series of filters, a low pass filter and a high pass filter. The outputs are then divided into (i) detailed coefficients (d) from the high-pass filter, and (ii) approximation coefficients (a), from the low-pass one. It should be noted that the two filters are related to each other and they are known as a quadrature mirror filter. However, half of the frequencies of the image have now been removed and half of the samples can be discarded according to Nyquist rule [8].
There are three different detailed coefficients; these are vertical (V), horizontal (H), and diagonal (D) coefficients. The obtained detailed coefficients are passed through 3 different thresholds, in order to reduce the number of coefficients as well as remove nonsignificant value. The 2-D DWT of order (j) based detailed coefficients can be estimated through the following equation:

where i is the detailed coefficients and expressed by
The 2-D DWT of order (j) based approximate coefficients can be estimated through the following equation:
where
5. Image Processing and Feature Extraction Using Empirical Mode Decomposition (EMD)
The key part of the empirical mode decomposition method with which any complicated dataset can be decomposed into a finite and often small number of intrinsic mode functions (IMFs) that admit well-behaved Hilbert transforms. This decomposition method is adaptive and, therefore, highly efficient. Since the decomposition is based on the local characteristic time scale of the vehicles data, it is applicable to nonlinear and nonstationary processes. With the Hilbert transform, the intrinsic mode functions (IMFs) yield instantaneous frequencies as functions of the spatial domain parameters
There are many reasonable reasons for using EMD in analyzing vehicle images for the training and testing processes. These reasons may be summarized as follows.
It does not assume a prior basis function for the decomposition and thus it is fully adaptive.
It can separate non-stationary oscillations.
It does not require spurious harmonics to represent nonlinear data.
It can give a meaningful instantaneous frequency representation.
EMD is a method to decompose data based on its IMFs instead of a set of predefined basis functions. EMD was proposed by Huang et al. in 1998 [9]. It can extract adaptively the oscillatory modes at each time from a complex signal, namely, it can decompose the signal into a finite (often less) number of IMFs. In addition, EMD is especially suited for analyzing nonlinear and nonstationary data sequence [10, 11]. Any IMF must satisfy two conditions, (i) in the whole dataset, the number of extrema and the number of zero-crossings must be equal or may differ at most by one. (ii) At any point, the mean value of the envelope defined by the local maxima and the envelope defined by the local minima is zero. The Hilbert Huang transform (HHT) consists of two processes: performing EMD of the signal and calculating the Hilbert spectrum of the resulting IMFs. From these spectra, a time-frequency representation of the IMFs can be determined. The signal

where
In the whole data set, the number of extrema and the number of zero crossings must either be equal or differ at most by one.
At any point, the mean value of the envelope defined by the local maxima and the envelope defined by the local minima is zero [12].
The following basic steps describe the complete algorithm for reaching the sifting process to extract the (IMFs) in each captured image after transforming time domain analysis to spatial domain 2D analysis, and this could be considered as a new contribution in feature extraction [9, 13].
Step 1.
Calculate the upper and lower envelopes of the vehicle image

Step 2.
Calculate
Step 3.
Check if
Step 4.
If not, use
Step 5.
Continue until an
Step 6.
Considering the
6. Recognition Using ANNS
Backpropagation feedforward algorithm has been used for the recognition process in each case of feature extraction. The backpropagation algorithm trains a given feedforward multilayer neural network for a given set of input vehicle images with known classifications. When each entry of the sample set is presented to the network, the network examines its output response to the sample input pattern. The output response is then compared to the known and desired output and the error value is calculated. Based on the error, the connection weights are adjusted. The back propagation algorithm is based on Widrow-Hoff delta learning rule in which the weight adjustment is done through mean square error of the output response to the sample input [14]. The set of these sample patterns are repeatedly presented to the network until the error value is minimized. Algorithm 1 and Table 1 show the basic steps in both feature extraction and recognition processes in both transformed domain and EMD algorithm.
Basic feature extraction and recognition steps in all transformed domain case studies.

IMFs based EMD
Read, format (as a double), and convert (as a grey scale) vehicle images per queue. Apply EMD technique for each image
Calculate both envelope and mean for each image Extract the mean Check if it satisfies the two conditions of the IMFs If not, check again using new envelope and new mean Continue until the two conditions is satisfied We have now the first IMF, repeat again to get the higher IMF and this one will be the last IMF Rearrange IMFs as a column matrix concatenate the coefficients of the previous step of all vehicle images together in a matrix form
7. Estimating Vehicular Waiting Time
7.1. Time Calculation through Camera Coordination
The following steps describe how vehicular waiting time is calculated.
RSU1 through its installed camera captures image scenes for vehicles then uses the images to start training and building an ANN.
RSU1 registers the time
In case of failure of an RSU unit, a resent scenario will begin the process again as shown in Figure 3 according to the direction of queue as we discussed before.
A feed-forward back propagation neural network has been utilized and built with a differentiable transfer function which uses from 2 to 3 scenes for each vehicle.
Each NN uses transformed domain feature extractor to extract most salient features for the training process.
The resulting trained ANN structure and timing information is forwarded to RSU2 via the RSU Wi-Fi interface and through its locally maintained routing tables via OLSR. We assume that RSUs are synced in time.
RSU2, through its Camera, captures image scene for vehicle. The trained ANN is used to recognize vehicles.
The images taken are used to fine-tune the training of the ANN. The RSU registers the time of vehicle crossing by RSU.
The fine-tuned ANN and registered time are forwarded to RSU3 via the RSU Wi-Fi interface.
As the vehicle is identified, the RSU registers the time of vehicle crossing by RSU2 by the relation (waiting time =
The fine-tuned ANN and registered time are forwarded to RSU3 via the RSU Wi-Fi interface. Algorithm 1 and Table 1 show how the RSU sends the NNs in case of activation.
The process is repeated for RSUs as shown in Algorithm 1 and Table 1. Simple timing calculations can provide information on waiting times for a vehicle as well as their average speeds. Averaging timing and speed information on a number of vehicles result in increasing the accuracy of this information.
Finally, accurate vehicular waiting time information is forwarded via the gateway and the Internet to Traffic Management Center headquarters.
7.2. Coordination Algorithm with Respect to Vehicle Speed
As shown in Figure 4, the following assumptions with some standards will be assumed:
ANNs processing time = t (and it is a variable depending on the algorithm of interest),
predefined threshold expiry time =
distance between any two
vehicle velocity = v,
time taken from vehicle at RSU1 to reach

Proposed infrastructure.
8. Experimental Results
We ran simulation experiments to study the performance of the proposed ANN based DWT, DCT, FFT, and EMD system. The objective of the experiments is measuring four performance indices which could provide a good view for the hardware implementation. These are (i) ANNs performance, (ii) regression performance, (iii) vehicle recognition error (target value-output value), and (iv) processing time.
In our simulations, we used the following parameters for all tested ANNs using the three feature extractors:
(i) number of hidden neurons = 10, (ii) train ratio = 70%, (iii) validation ratio = 15%, and (iv) test ratio = 15%.
The performance of all tested ANNs was evaluated through Tables 3 and 4 which introduce a comparison study between all transformed domain extractors with respect to (i) number of inputs, (ii) number of NNs iterations (epochs), (iii) processing time, and (iv) best validation performance and recognition error.
For the FFT based feature extractor, the best validation performance has been achieved at epoch (4) and regression is approximately equal to (1) with processing time equal to (8 sec).
For the DCT based feature extractor, the best validation performance has been achieved at epoch (2) and regression is approximately equal to (1) with processing time equal (7 sec).
The DWT based feature extractor has been used with different levels of decomposition as follow.
Daubechies level one (db1) which called Haar family (db1): we found that the best validation performance has been achieved at epoch (3) and regression is deviated than (1) with processing time equal to (3 sec) and this deviation causes some sort of vehicle recognition error. For this level of decomposition, we found the recognition error of car 3 and it is recognized to be car 2. by calculating this error mathematically, we found that it was about (target – output = 1.2957). We believe that this error is increased in such family due to low level of decomposition which reflects less salient wavelet coefficients.
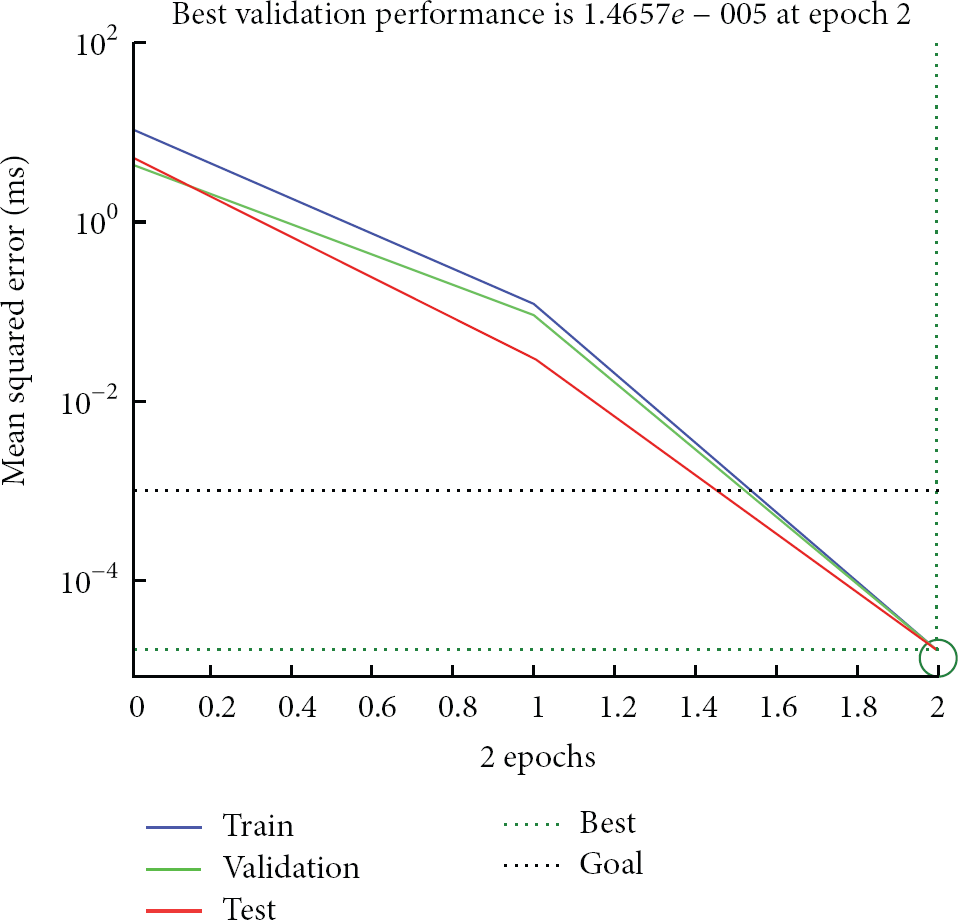
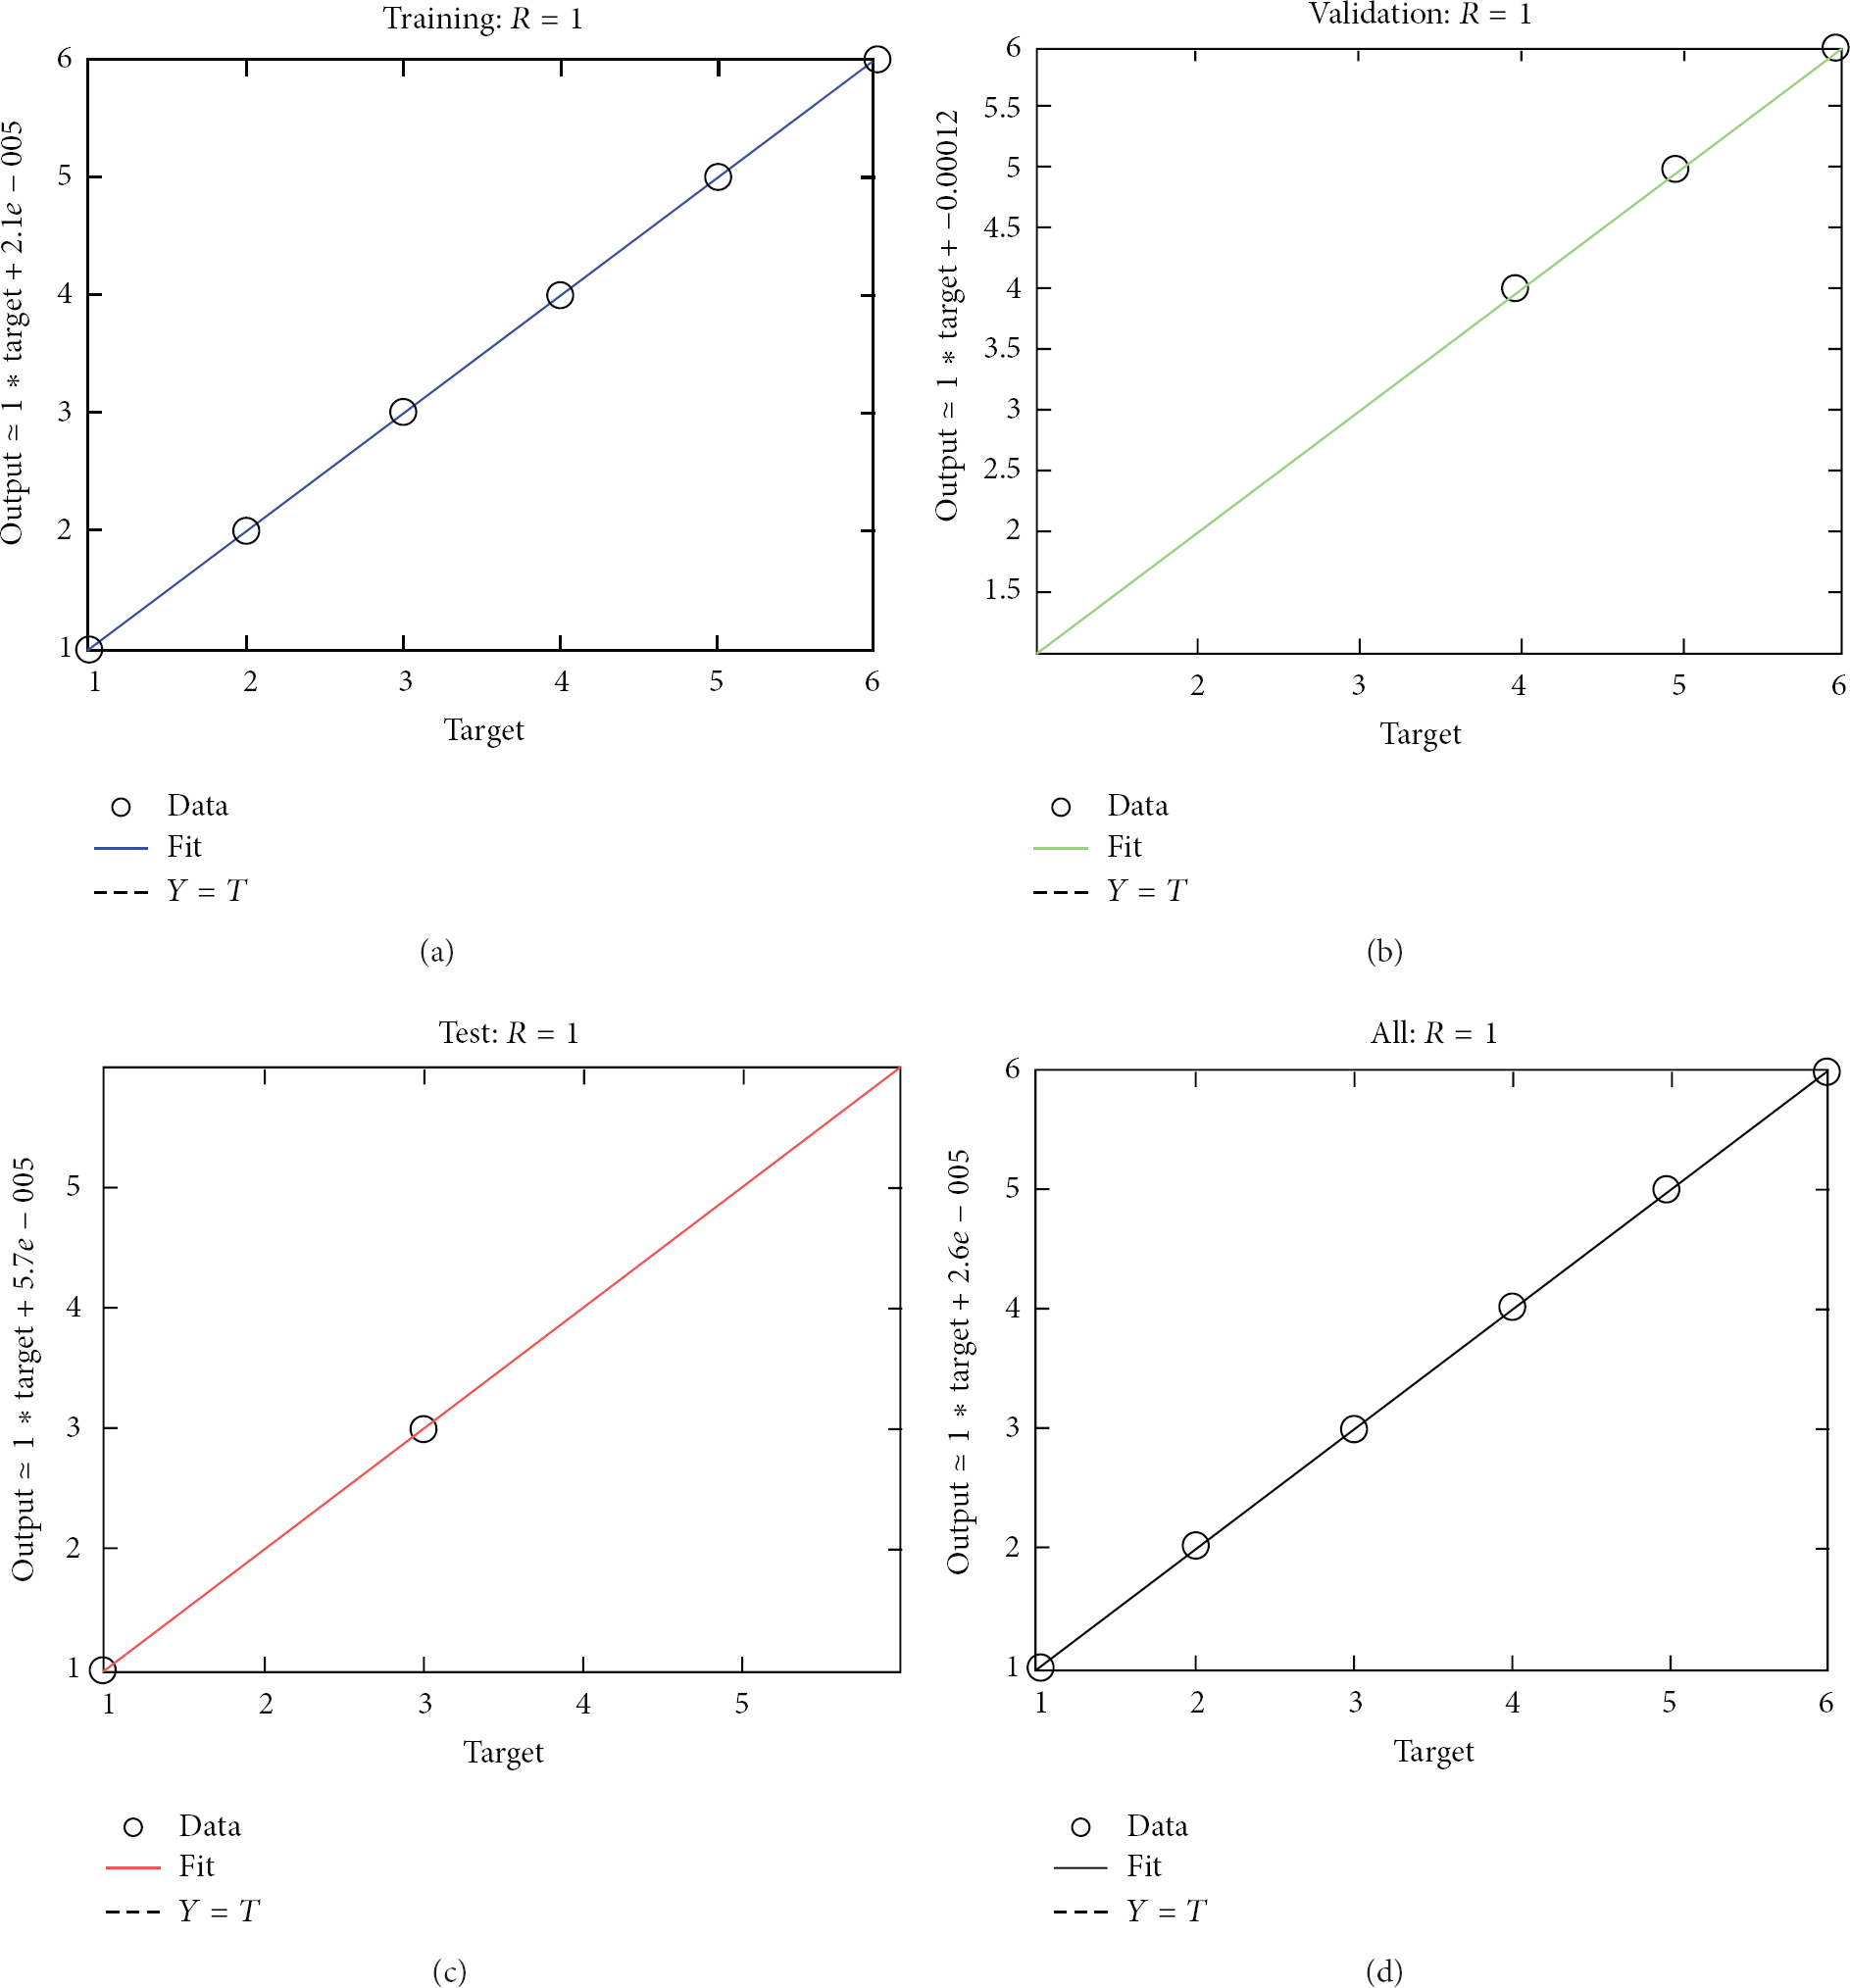
Daubechies level two (db2): we found that the best validation performance has been achieved at epoch (3) and regression is approximately equal to (1) with small processing time equal (2 sec). We believe this high performance is achieved due to high level of decomposition which reflects most salient wavelet coefficients.
For the EMD based feature extractor, the best validation performance has been achieved at epoch three and regression is approximately equal one with a processing time equal to (1 sec). This new algorithm of feature extraction was very powerful and more efficient technique for the hardware implementation because of sifting algorithm which provides only five IMFs with a minimal recognition percentage of error and we can easily discriminate between cars of the same colors one following after another.
Figures 5, 6, 7, 8, and 9 show mean squared error achieved versus the number of epochs for the training, testing, and validating samples. The best validation performance achieved in FFT, DCT, DWT based db1, DWT db2 and EMD is

Network performance for the FFT based.
Network performance for the DCT based.

Network performance for the DWT of family db1 (haar) based.

Network performance for the DWT of family db2 based.
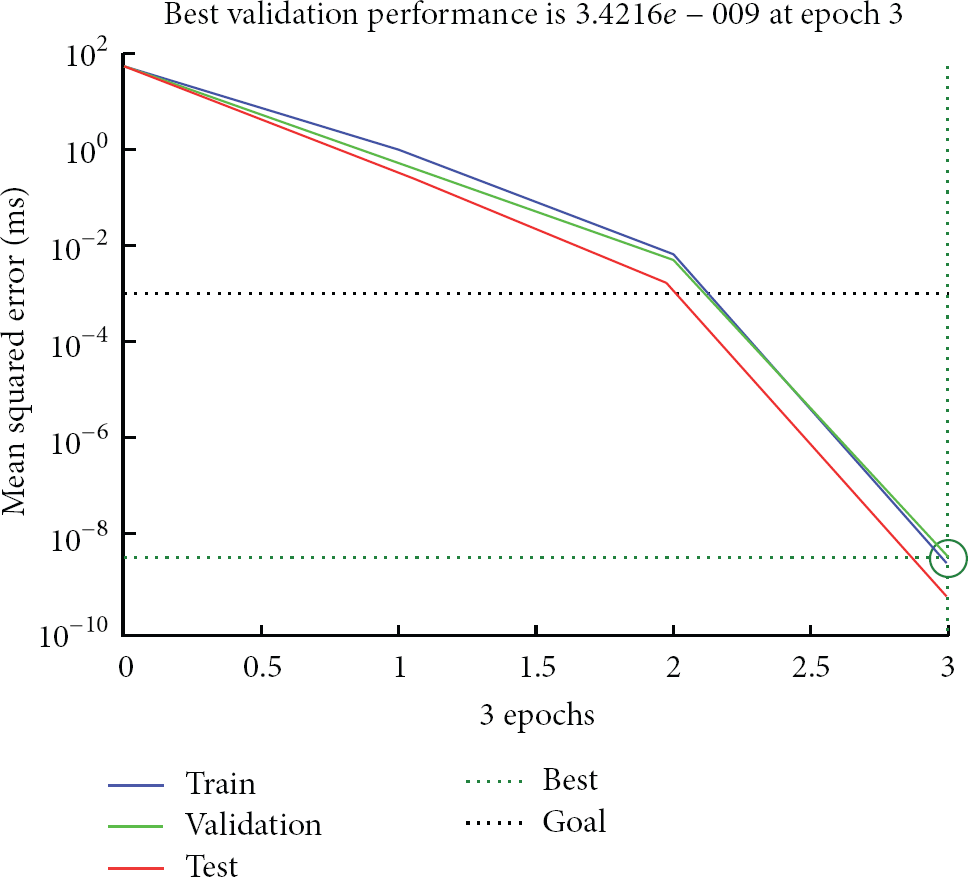
Network performance based EMD.
These results reflect that the EMD and DWT based db2 is the highest performance algorithm for all tested cases of transformed domain extractors and DWT based db1 (Haar) is the worst-case performance.
Figures 10, 11, and 12 show the regression
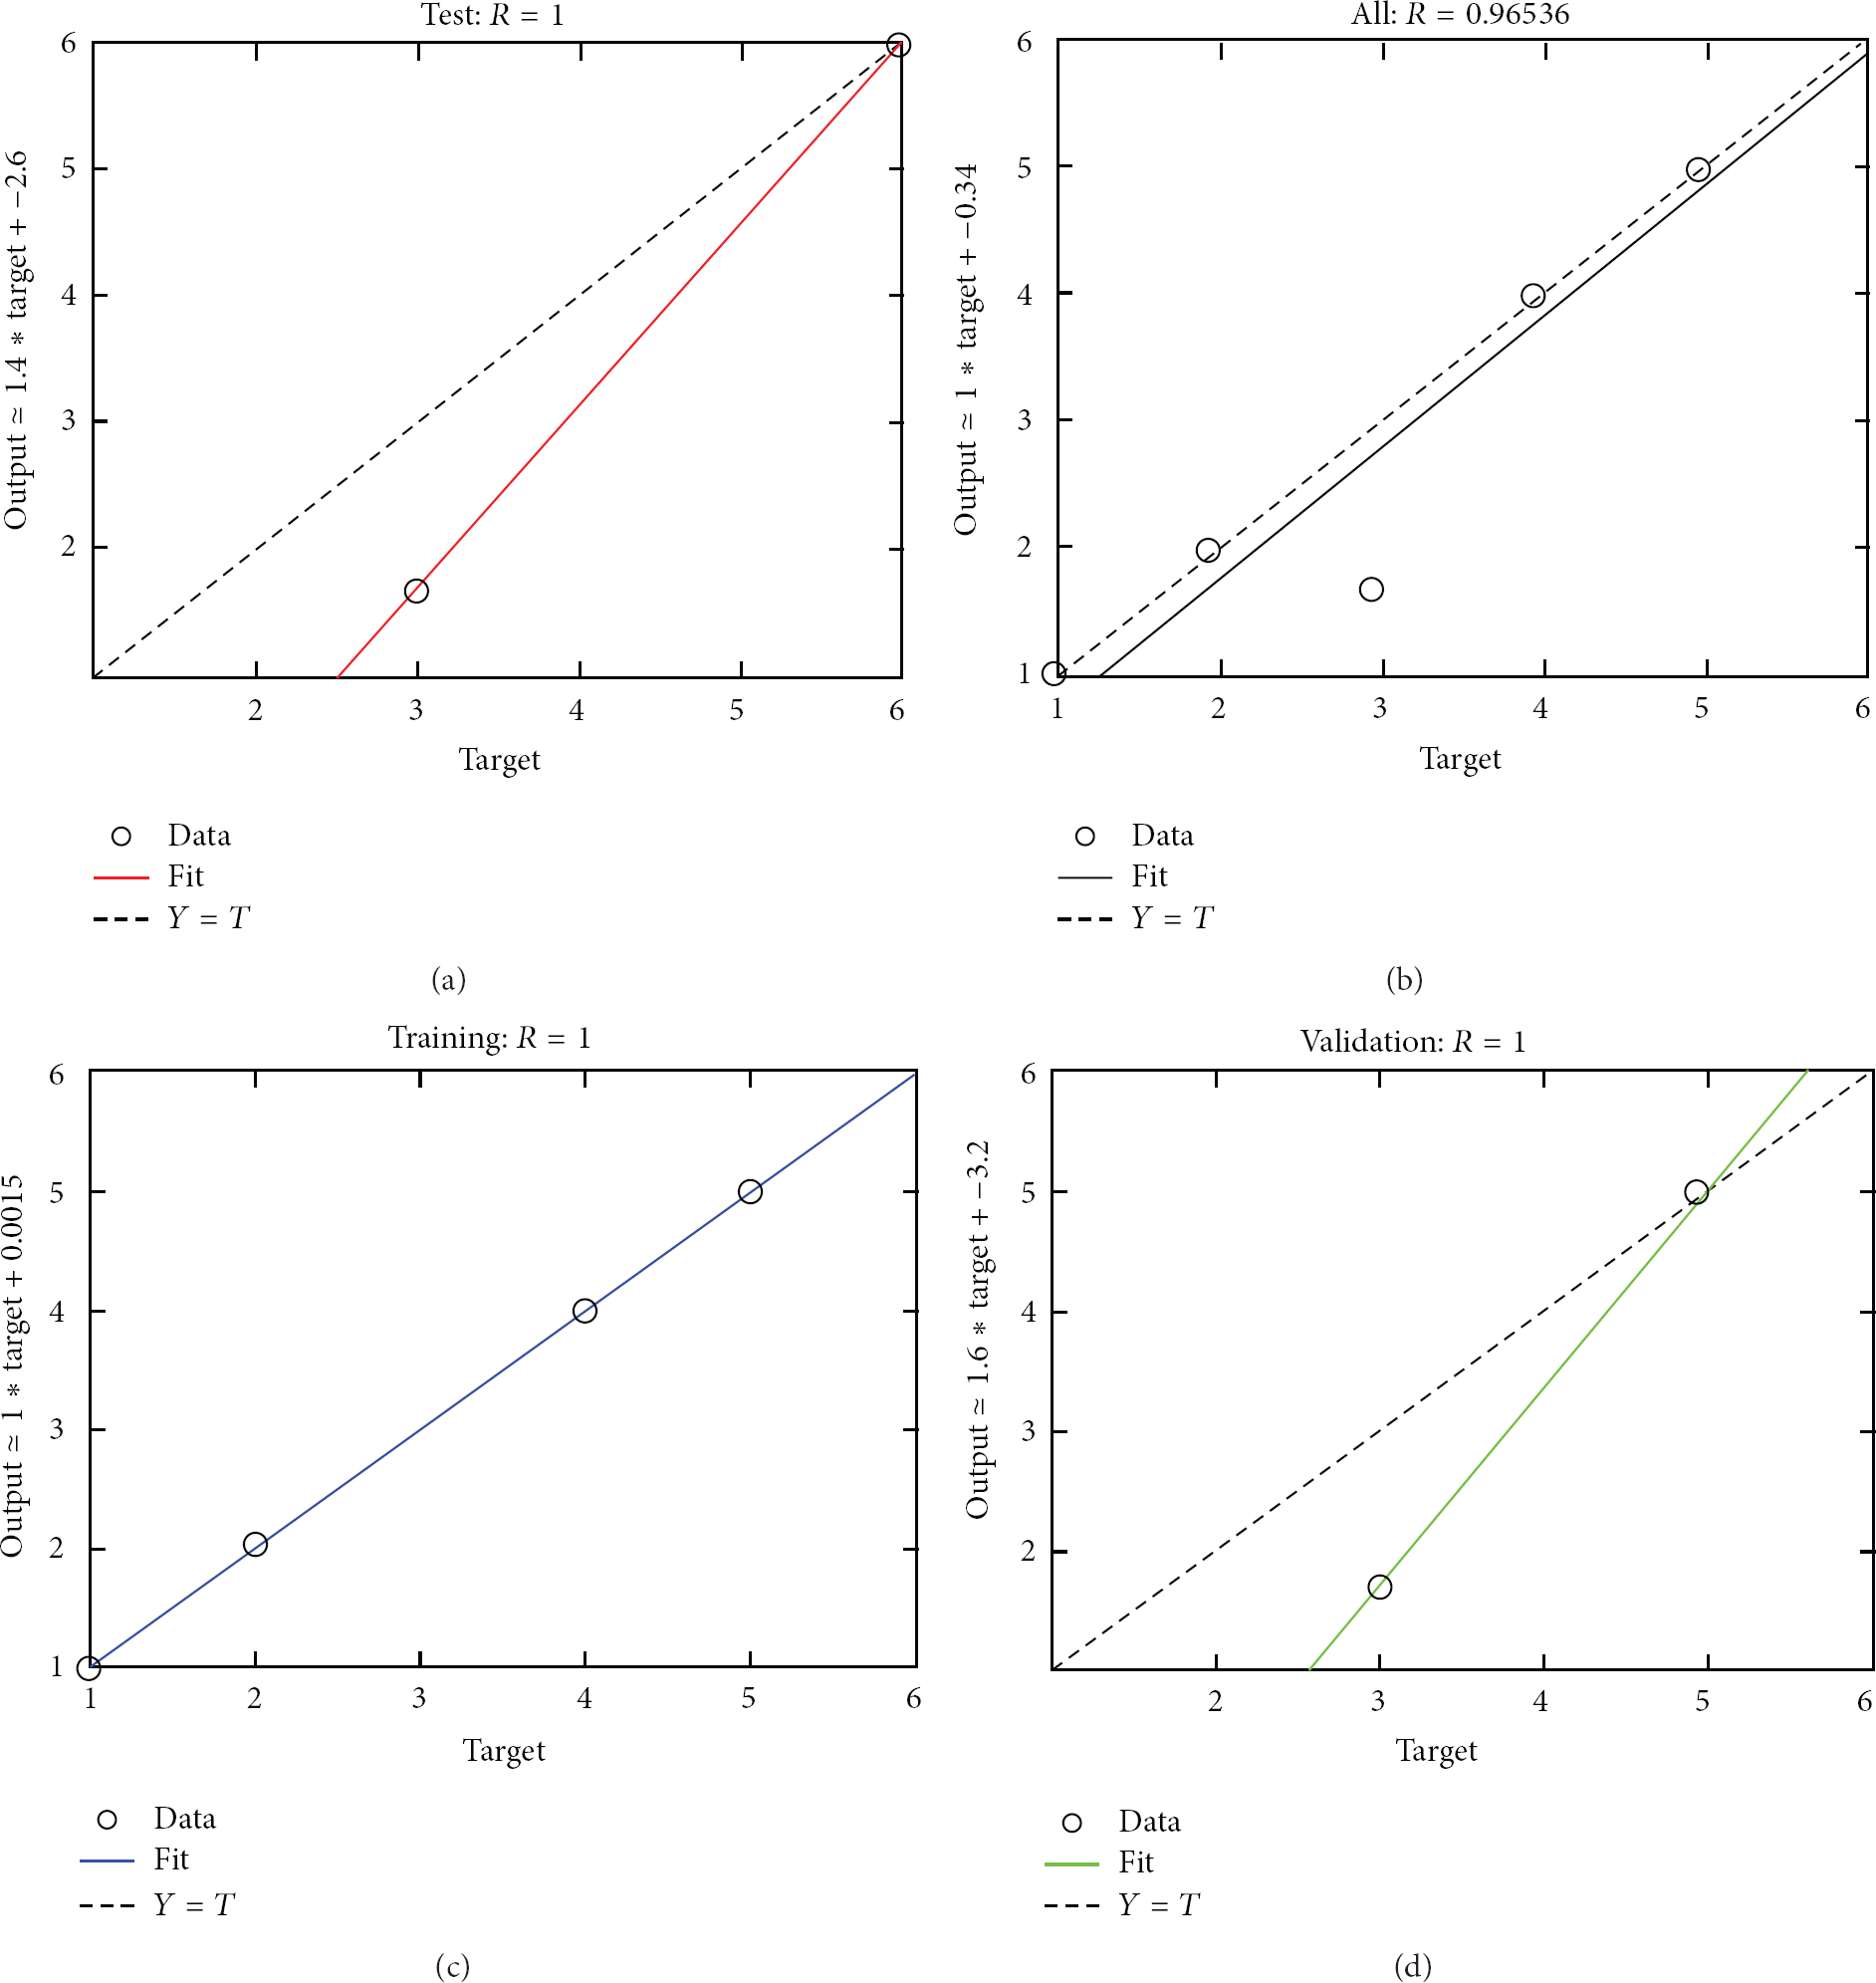
Regression DWT based db1 (Haar) family (worst-case solution).

Regression DWT based db2 family (best case solution).
Network regression based EMD.
All cases of the regression as represented by linear straight line equation
We can summarize the results of the algorithms with respect to the processing time of the NNs as in Table 2.
Results summary.

Transformed domain network specifications.

Percentage of recognition error per vehicle.

We have 3 basic assumptions that describe the relationship between the applied algorithm and the vehicle speed.
Assume that small level of crowding (vehicle speed is 50 km/hr) is
It means that FFT and DCT will introduce a mismatch in the recognition of the vehicles
Assume that high level of crowding (vehicle speed approaches to zero km/hr) is

It means that a vehicle takes much more than expiry threshold time
Assume that no level of crowding (vehicle speed is ≥120 km/hr) is

It means that EMD is the only algorithm that could be suitable for the vehicle recognition.
We can summarize these assumptions as follows.
Case 1.

vehicle speed around recommendation: use EMD or DWT based db2, vehicle speed around recommendation: EMD is only recommended.
Case 2.
One has

(occurs when vehicle speed approaches to zero).
Then, resend NNs with another vehicle for waiting time calculation.
The two cases should satisfy the condition

9. Conclusion and Future Work
In this paper, we proposed a novel system for the prediction of vehicular waiting times at different traffic locations and conditions including traffic signals, border crossings, and work zones. We described the main components of the system and many real-life deployment concepts of the system. We also described image-processing algorithm used to determine such waiting times. We used Wi-Fi based wireless communication to coordinate and share information between different parts of the system.
We used artificial neural networks to recognize vehicles and transformed domain based algorithms to extract features of images. Performance results indicate that the use of Empirical Mode Decomposition as a feature extraction provides our system with the most salient features producing a minimal error of vehicle recognition within acceptable processing time. This results in providing advanced automatic waiting time prediction system depending on images not video frames which decreases processing time needed and complexity of the neural networks and communication overhead between system modules.
In the future work of interest, we will produce new experiments using other feature extractors such as (invariant moments-independent component analysis (ICA) and other recognition methodology such as 2-D correlation, fuzzy logic, and genetic Algorithms.
Footnotes
Acknowledgment
This research has been supported by the center of Research Excellence in Hajj and Omrah (HajjCORE), Umm Al-Qura University, Makkah, Saudi Arabia under project number P1129, entitled (UQU-SENSE:A Crowd-sourced Data Management Platform for intelligent Transportation systems).