
Abstract
We focus on top-k monitoring in wireless sensor networks and propose a novel sequence-aware top-k monitoring algorithm called SAT. Top-k monitoring is important to many applications of sensor networks. Conventional top-k monitoring algorithms install a filter at each sensor node and suppress unnecessary sensor updates. However, they have some drawbacks such as the fact that the sensor nodes consume energy extremely to probe sensor reading or to update filters. Our basic idea is to collect readings sequentially by their values. First, sequence-aware data collection is investigated to make sensor nodes to determine their orders for data gathering phase. Next, sensor nodes transmit their sensor readings sequentially to the base station. When the base station collects k-readings, it broadcasts a simple message to stop data gathering phase. Therefore, SAT may minimize the communication cost for processing top-k queries. Moreover, we expand our approach to a cluster-based top-k monitoring to filter out false positives in hierarchical levels. In order to show the superiority of our top-k monitoring approach, we simulate its performance with the conventional filter-based top-k monitoring algorithm. In the results, our approach reduces communication overhead and prolongs the network lifetime largely.
1. Introduction
Wireless sensor networks are widely used in military and civil fields such as environment and habitat monitoring, object tracking, nuclear reactor controlling, fire detection, and traffic controlling [1–5]. Monitoring sensor readings is very important in many applications [6–10]. Sensor nodes collect useful information such as temperature, humidity, and seismic intensity. They transmit sensor readings to the base station for sophisticated processes. Because sensor nodes have limited batteries and consume a lot of energy for communication, energy-efficient methods are required to reduce the network traffic. Recently many works on a top-k query processing have been done to reduce the network traffic. A top-k query retrieves the highest (or lowest) k readings and sensor nodes with them in the wireless sensor networks. Top-k queries are required environment monitoring applications. A top-k query is issued to find out the nodes and their corresponding areas with the highest pollution indexes for the purpose of pollution control or research study. In network management, power supply is critical to the operation of a wireless sensor network. Thus, a top-k query may be issued to continuously monitor the sensor nodes with the least residual energy to extend the network lifetime.
In a centralized approach for processing top-k queries, all sensor readings can be periodically collected by the base station that computes the top-k result set. However, it incurs network traffic in the data collection phase. Madden et al. [11] proposed an in-network aggregation technique, known as TAG, to reduce network traffic. Initially, a routing tree is first established, and the data are then aggregated and collected along the routing tree in the base station. Each sensor node sends its sensor readings to the base station. It compares the readings received from child nodes with its own readings and sends the highest reading to the base station or to the parent. In the result, the base station can just collect the top-k result set. However, all sensor nodes must always send their corresponding sensor readings in every epoch. Therefore, this approach incurs unnecessary updates in the network. To overcome this problem, Wu et al. [12] propose a filter-based approach, known as FILA. It installs a filter at each sensor node to suppress unnecessary sensor updates. Filter setting and query reevaluation upon updates are two fundamental issues to the correctness and energy-efficiency of the FILA approach. Whenever an update occurs in FILA, however, some sensor nodes that filter ranges that contain the update value consume energy extremely to probe their sensor readings or to update the filters. That is, the network consumes more energy to update filters or to reevaluate the top-k result. Especially, it becomes worse as the top-k result changes more frequently.
In this paper, we propose a novel sequence-aware top-k monitoring approach. The basic idea is to collect the readings sequentially by their values. First, the sequence-aware data collection algorithm is investigated to make the sensor nodes determine their orders for the data gathering phase. Next, we perform a simple sequence-aware top-k monitoring algorithm, called SAT. The sensor nodes transmit their sensor readings sequentially to the base station.
When the base station collects k-readings, it broadcasts a simple message to stop the data gathering phase. Therefore, SAT may minimize the communication cost for processing top-k queries. We also expand our approach to a cluster-based top-k monitoring, called SAT-c. The expanded approach filters out many false positives in two levels such as a cluster level and a tree level. Sequence-aware approaches perform better than the existing filter-based approaches, because they avoid filter updates and query reevaluation, and minimize communication cost in networks. However, there are the following fundamental issues. How are sensor readings collected in sequence without centralized control and filters? How do sensor nodes recognize their sequence to transmit their readings to the base station? These issues that are essential to achieve sequence-aware top-k monitoring without filters are investigated in this paper. Our contributions are as follows.
We investigate a simple and intuitive top-k monitoring without filters, which leads to adjusting filter setting(s) and to reevaluating queries in the existing algorithm. We exploit the semantics of TDMA scheduling and propose a sequence-aware approach called SAT for monitoring a top-k query in wireless sensor net-works. Moreover, we extend our approach to SAT-c, which performs better in the hierarchical network topology. To the best of our knowledge, this is the first work that exploits TDMA scheduling to process a top-k query. We develop a data collection algorithm (SAC) that is capable of collecting sensor readings in sequence without any centralized control or filters. We design a lazy k-validation algorithm to avoid incorrect termination in the multihop network and to adapt SAC for top-k monitoring efficiently. Extensive experiments are conducted to evaluate the performance of our approaches by using real data traces. The results show that our approaches substantially outperform FILA in terms of the network lifetime and energy consumption under various network configurations. In particular, our approaches are more suitable for the large-scale networks.
The rest of the paper is organized as follows. Section 2 reviews the related work on top-k query processing and presents some problems of the conventional approaches. Section 3 presents our proposed approach, SAT, and discusses how we collect sensor readings in sequence and terminate top-k query processing for each epoch. Also, we describe the extended top-k query processing approach, SAT-c, for the hierarchical network topology. In Section 4, we show the superiority of our proposed compression algorithm through performance evaluation and analysis. Finally, we conclude this paper and present some future works in Section 5.
2. Related Work
Querying the sensor readings is an important and challenging problem in wireless sensor networks. COUGAR [13] and TinyDB [14] are two typical perceptual data management systems. They implement a type of SQL interface to describe readings that users collect and how users want to combine, transform, and summarize readings. In-network processing is an energy-efficient approach for sensor networks [15, 16]. It allows sensor nodes to perform the compression, filtering, and aggregation functions on the collected sensor readings. Several collected readings will be merged into only one single value using aggregation functions, such as MIN, MAX, SUM, AVG, and COUNT.
In-network aggregation reduces the overall energy consumption by performing computation within the network and reducing the size of data propagated upward. Madden et al. [11] proposed an in-network data aggregation technique to reduce network traffic for data collection. Madden et al. established first a routing tree that collects readings and outputs aggregated values over the routing tree in sensor networks. Yoon and Shahabi [17] utilized additional temporal suppression schemes to reduce the communication cost on the TAG. Heinzelman et al. [18] considered both the temporal and spatial correlations among sensor readings for further reduction on aggregation cost.
The clustering algorithm also could be an efficient protocol for data collection and data aggregation in sensor networks as well [19–24]. In the clustering algorithm, sensor nodes elect their own cluster heads and are organized into different clusters. When a node wants to transmit data to the base station, it first transmits the sensed readings to its cluster head, and then the cluster head forwards the data to the base station. In this phase, the cluster heads can apply some aggregate functions to reduce the communication cost (e.g., combining and compressing the readings of the member nodes).
Recent researches focus on not only common queries but also the more complicated queries including a top-k query, a kNN query, a join query, and a skyline query. A top-k query retrieves the highest (or lowest) k readings and sensor nodes with them in the wireless sensor network. Wu et al. [12] exploited the semantics of a top-k query and proposed a filter-based monitoring scheme, called FILA, to maintain the current top-k points by assigning a dedicated filter to each sensor. Silberstein et al. [25] proposed a sampling-based approach to optimize top-k queries. Silberstein et al. considered the top-k query evaluation problem by providing approximate solutions with high probability based on a prediction model that is built on the samples of previous top-k query results. Zeinalipour-Yazti et al. [26] proposed TJA algorithm to find k top-ranked answers under the user-defined similarity. Zeinalipour-Yazti et al. [27] proposed a materialized in-network top-k views algorithm (MINT) to find the fixed top-k ranges in the networks. It has some global information in advance. Mai et al. [28] proposed a linear regression-based filter setting algorithm and a decentralized query reevaluation algorithm to reduce the communication cost for sending probe messages.
Skyline is a set of objects which are not dominated by other objects in the data set. Unlike other aggregation queries, a skyline query requires much comparison among objects. Chen et al. [29] addressed the issues of skyline monitoring in WSN and proposed a threshold-based hierarchy filter algorithm, MINMAX, to reduce network data traffic. Xin et al. [30, 31] proposed the sliding window skyline query in the WSN and methods to effectively reduce the data transmission volume of the sensor nodes, thereby reducing the overall network energy consumption. Shen et al. [32] proposed a location-based skyline query processing approach, called Ring-Skyline. It divides the monitoring area into several rings and adopts in-network query processing to reduce energy consumption. Seong et al. [33] proposed a lazy filtering-based in-network skyline query processing algorithm to improve the filtering scheme.
Another related work is a TDMA scheduling approach. Designing a TDMA schedule is to allocate time slots depending on the topology and the node packet generation rates. A proper schedule not only avoids collisions by silencing the interferers of every receiver in each time slot but also minimizes the number of time slots hence the latency [34].
3. Sequence-Aware Data Collection
In this section, we describe a novel top-k approach to reduce the energy consumption due to the query reevaluation and the filter updates in FILA. Our key idea is to self-sort by the values of sensor readings. A top-k query requires the highest (or lowest) k-readings. If all the sensor readings can be collected in sequence, it is possible to get just k sensor readings which are included in the top-k result. It reduces the number of sensor readings which are collected from the sensor network. First, we describe how sensor readings can be collected in sequence without any centralized control and how the data gathering is finished after collecting k readings. Next, we explain an extension for hierarchical network topology.
3.1. Sequence-Aware Data Collection
Our major concern is how to collect the sensor readings from the highest to the lowest sequentially. If we can collect the sensor readings sequentially, it provides opportunities to terminate data gathering intuitively after collecting the highest (or lowest) k readings. We propose a sequence-aware data collection algorithm (SAC) to collect sensor readings from the highest to the lowest sequentially. SAC uses the equi-width histogram to avoid the reevaluation of a query and the adjustment of filters. The base station diffuses a histogram setting including
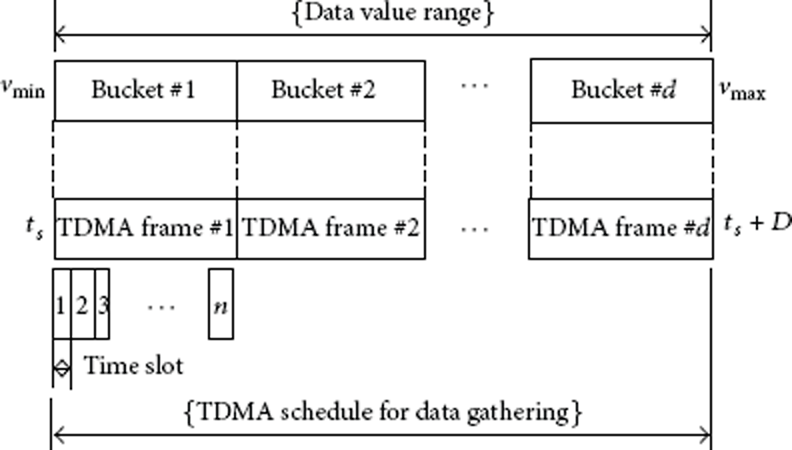
A histogram-mapped TDMA schedule.
Figure 2 shows an example of gathering the lowest k readings sequentially. We assume that there are five time slots in each TDMA frame and ten TDMA frames per round. All the sensor nodes measure temperature from 0 to 100 and transmit sensor readings directly to the base station. Sensor nodes

An example of data gathering with SAC.
3.2. Lazy k-Validation to Terminate Data Collection
We propose a lazy k-validation algorithm to avoid incorrect termination in the multihop network and adapt a sequence-aware data gathering algorithm to top-k monitoring. Data gathering must be finished to minimize energy consumption after collecting kth sensor reading. A simple implementation of collecting only k-readings is to count the number of the collected readings. If the base station collects k-readings, then it broadcasts a stop signal into the sensor network and terminates the data collection. However, it may lead to incorrect results or termination in the multi-hop network. We assume that in the multi-hop network, sensor nodes B and G pick the same bucket and TDMA frame, but the depth of each sensor node and time durations that transfer readings to the base station are different. G measures higher sensor reading and transmits its sensor reading earlier than B, as shown in Figure 3. If time slots are assigned into a TDMA frame as many as the number of sensor nodes, each sensor node can transfer its readings to the base station without interference. Otherwise, it cannot be guaranteed that the sensor readings of G will arrive in the base station earlier than the sensor readings of B. The multi-hop network can generally suffer from packet order inversion. As shown in Figure 3, for example, if the readings of B

An example of communication latency (k = 1).
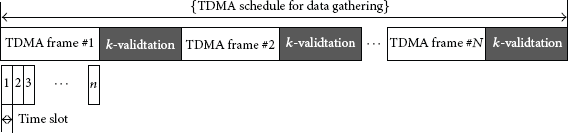
TDMA schedule for data gathering.
Algorithm 2 presents the pseudocode to terminate data gathering for each epoch. We assume that a routing tree is constructed by the conventional algorithm like TAG. All sensor nodes determine their own buckets and TDMA frames by Algorithm 1. In SAC, the sensor nodes transmit their sensor readings to the base station. The base station counts the number of received readings. When each TDMA frame is finished, the base station validates whether the count value is more than k or not. If so, the base station broadcasts the beacon message into the sensor network. Otherwise, the validation for the next TDMA frame is continued to collect more sensor readings. The beacon message is a signal to stop gathering sensor readings, and it is significantly smaller than other messages. We exploit an intuitive approach for processing continuous top-k queries. Our proposed algorithm repeats ad hoc top-k processing at each epoch. Although this manner is not sophisticated, it is suitable for sensor networks, which have low computation performance.
(1) sleep mode {turn off communication circuit} (2) v←current sensor reading (3) selectedFrame←nil (4) (5) (6) selectedFrame← (7) (8) (9) (10) (11) active_mode (turn on communication circuit) (12) transmit v (13) sleep_mode (turn off communication circuit) (14) (15) waiting for next TDMA Frame (16) (17) (18) active_mode (turn on communication circuit) (19) waiting for stop signal
k = the number of final result (1) broadcast (2) top-k candidates = Ø (3) count = 0 (4) (5) v = receive sensor readings for (6) (7) count = count + (8) top-k candidates = top-k candidates (9) (10) break (11) (12) (13) (14) broadcast stop-signal (15) top-k = compute final top-k result from top-k candidates (16) return top-k
3.3. Extension for Hierarchical Network Topology
We propose an extended sequence-aware top-k monitoring which operates in three phases: (i) establishing a routing tree, (ii) top-k query processing in the cluster level, and (iii) top-k query processing in the tree level. The expanded algorithm establishes a routing tree once. Next, it repeats ad-hoc top-k query processing in both cluster and tree levels.
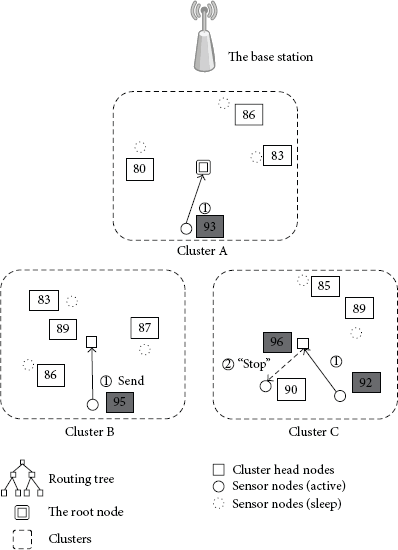
(1) Establishing a Routing Tree. The sensor nodes are clustered using clustering schemes like LEACH and HEED. After the formation of the clustered network, the routing tree is organized by connecting cluster heads, as shown in Figure 5. A cluster head directly communicates with a distant observer.

Establishing a routing tree with clusters.
(2) Top-k Processing in Cluster Level. The sensor nodes transmit their readings to their cluster heads over sequence-aware data routing in the cluster level. The incorrectness due to multi-hop routing can be ignored, because cluster members can communicate with each other in a single hop. In the cluster level, each cluster head elects k or less candidates for top-k results. Figure 6 represents an example of top-2 query processing. The current TDMA frame is mapped to a bucket which has the range
Top-k query processing in the cluster level.
(3) Top-k Processing in the Tree Level. The tree level is composed of cluster heads. Top-k candidates which are determined in the cluster level are transmitted from the leaf nodes to the root node along the routing tree, like TAG. Parent nodes collect top-k candidates from their child nodes, filter out unnecessary readings, and transmit top-k candidates to their parents repeatedly. The root node tries to determine the final top-k results and transmits top-k results to the base station. If the number of readings is over k in the root node, the root node broadcasts a beacon message into the sensor network to stop data gathering. Otherwise, the next frame is performed. As shown in Figure 7, for example, the candidates

Top-k query processing in the tree level.
4. Performance Evaluation
4.1. Simulation Setup
We have developed a simulator based on Java to evaluate the proposed two algorithms, sequence-aware top-k monitoring (SAT), and an extended SAT (SAT-c). The energy consumption for sending a message is determined by a cost function,
Simulation parameters.


Network layout.
Figure 9 shows the representative segments of the TEMP data traces in the simulation. The sensor readings are simulated using the real traces provided by the Live from Earth and Mars (LEM) project [35] at the University of Washington. We extracted many subtraces starting at different times. We assigned each subtrace to the readings of each sensor. We controlled the variance of readings with the starting times of subtraces.
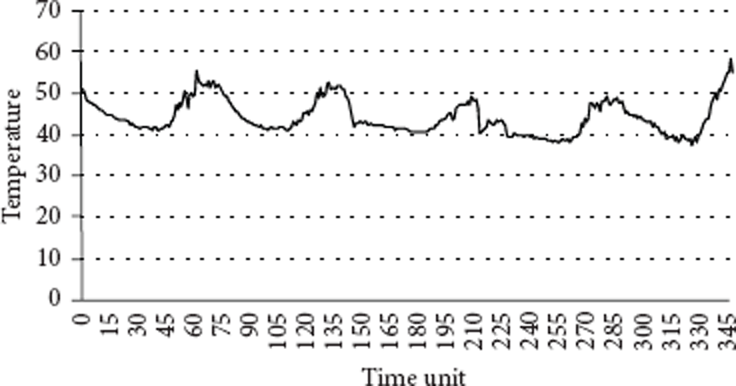
Sample of real data traces.
We first compare our proposed algorithms, SAT and SAT-c, with the different number of buckets. We then compare our approaches with FILA in terms of (i) the value k, (ii) the scale of sensor networks (the number of sensor nodes), (iii) variation rate. The following metrics are employed for performance comparisons.
Network Lifetime. The network lifetime is defined as the time duration before the first sensor node runs out of power. It serves as the primary metric in the performance evaluation. Residual Energy. We measure the minimum (Min), maximum (Max), and average (Avg) residual energy from sensor nodes for a specific round (=1000).
4.2. Query Reevaluation and Filter Updates in FILA
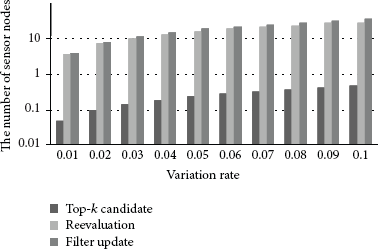
Figure 10 shows the number of sensor nodes that perform query reevaluation and filter update(s) as k values change from 1 to 10. The variation rate and the number of sensor nodes are set to 0.02 and 120, respectively. The number of top-k candidates is usually under k because the filters prune unnecessary updates effectively. However, k or more sensor nodes must perform query evaluation and filter updates, therefore consuming much energy for these executions. Similar performance trends are obtained as the number of sensor nodes changes from 48 to 440, as shown in Figure 11. Although top-k candidates are constant, usually as the k value changes, query reevaluation and filter updates still increase. This is because the number of sensor nodes that fall in the value range bounded for top-k candidates increases with the number of the deployed sensor nodes. When the number of sensor nodes becomes over 224, the number of sensor nodes that must perform the filter update is constant with the top-k candidate. Figure 12 shows the number of sensor nodes that perform query reevaluation and filter update(s) as the variation rate changes from 0.01 to 0.1. Query reevaluation and filter updates are indispensable to the variation of top-k results. These executions increase linearly with the variation rate.

Query Reevaluation and Filter Update(s) (

Query Reevaluation and Filter Update(s) (k = 3,
Query Reevaluation and Filter Update(s) (k = 3,
4.3. The Number of Buckets (=d)
Figure 13 shows the network lifetime as the number of buckets d changes from 10 to 100. The k value and the variation rate are set to 3 and 0.02, respectively. As shown in Figure 13, the network lifetime generally increases with the number of buckets in both schemes. This is mainly because the number of collecting and routing false positives is reduced. SAT-c shows better performance than that of SAT because it effectively prunes the false positives during routing them in the network. Though the number of buckets is an important factor that affects the network lifetime, finding optimal value without prior knowledge may be difficult because it depends on unknown underlying probability distribution of sensor readings. It can be predefined by some machine learning algorithms in the base station. For simplicity, we assume the absence of finding optimal d and set the default number of buckets to 70 in our next experiments.

Network lifetime (k = 3,
4.4. The Value k
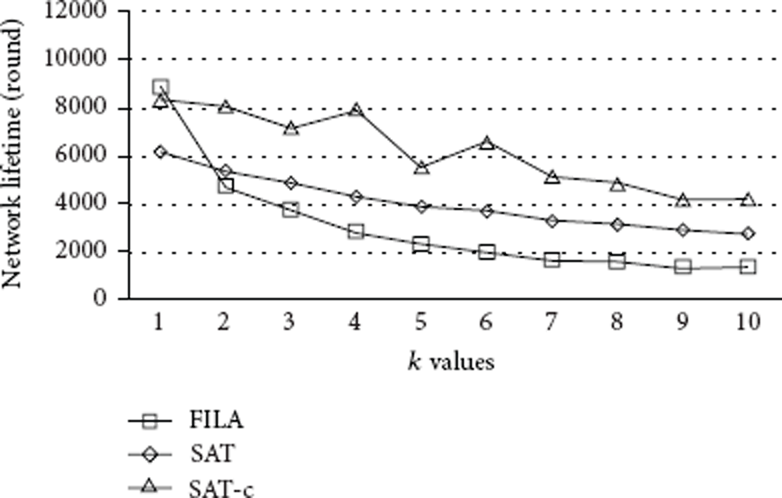
Figures 14 and 15 show the network lifetime and the residual energy as the value k changes from 1 to 10. The variation rate and the number of buckets are set to 0.02 and 70, respectively. The network lifetime linearly decreases when the values k increase in FILA and our approaches. While the communication cost is increased significantly for adjusting filter setting(s) and reevaluating the query with the scale of the value k in FILA, the probability of collecting the false positives is increased in our approaches. Although these factors increase energy consumption simultaneously, our approaches narrow the gap between the maximum and the minimum and are more energy-efficient to process top-k queries than FILA.
Network lifetime (

Residual energy (
4.5. The Number of Sensor Nodes
Figures 16 and 17 show the network lifetime and the residual energy as the number of sensor nodes is changed from 48 to 440. The number of buckets, variation rate, and the value k are set to 70, 0.02, and 3, respectively. FILA performs better than our approaches when the number of sensor nodes is less than 80. Our approaches collect k readings periodically regardless of the variation of the top-k result, while FILA suppresses unnecessary sensor updates. As the number of sensor nodes is increased to more than 80, our approaches outperform FILA. FILA consumes much energy for adjusting filter setting(s) and reevaluating the query over our approaches. As mentioned above, this is because the number of sensor nodes that fall in the value range bounded for top-k candidates is increased with the number of the deployed sensor nodes. Our approaches are more suitable for the large-scale networks. SAT-c that suppresses false-positives in the cluster level is more energy-efficient than SAT.

Network lifetime (k = 3,

Residual energy (k = 3,
4.6. Variation Rate
Figure 18 shows the network lifetime as the variation rate changes from 0.01 to 1. The number of buckets and the value k are set to 70 and 3, respectively. FILA shows that the network lifetime decreases as the variation rate increases. This is because filter updates and query reevaluation are increased simultaneously. On the contrary, our approaches are independent of the variation rate and prolong the network lifetime. This is mainly because the variation of top-k helps to distribute the communication overhead of the sensor nodes that send their readings to the base station for the top-k result, as shown in Figure 19. If the top-k result is constant, specific k nodes send their readings to the base station periodically for each round and consume energy intensively. It is also interesting to observe that the network lifetime can be extended with the variation rate in the result. If the variation rate can be measured, it may be possible to improve the energy-efficiency by adjusting the collection period adaptively.

Network lifetime (k = 3,

Residual energy (k = 3,
5. Conclusion
In this paper, we have proposed a novel top-k monitoring algorithm, called SAT. SAT is based on a sequence-aware data collection method that collects readings sequentially by their values. The sensor nodes transmit their sensor readings sequentially to the base station. When the base station collects k-readings, it broadcasts a simple message to stop the data gathering phase. Moreover, we extend our approach to a cluster-based top-k monitoring to filter out false positives in hierarchical levels such as the cluster level and the tree level. It has been shown through various experiments that our approaches reduce the energy consumption efficiently with no filters and are more suitable for the large-scale networks over the existing approach. In our future work, we will study approximate top-k query approach based on SAT. We plan to extend the sequence-aware data collection to other aggregate functions such as skyline, MIN, MAX, and kNN. We are also interested in adjusting the collection period adaptively to improve the energy-efficiency.
Footnotes
Conflict of Interests
The authors declare that there is no conflict of interests regarding the publication of this paper.
Acknowledgments
This research was supported by the MSIP (Ministry of Science, ICT and Future Planning), Korea, under the ITRC (Information Technology Research Center) support program (NIPA-2013-H0301-13-4009) supervised by the NIPA (National IT Industry Promotion Agency), by the MSIP (Ministry of Science, ICT and Future Planning), Korea, under the CPRC (Communications Policy Research Center) support program supervised by the KCA (Korea Communications Agency) (KCA-2013-003) and the Korea Institute of Science and Technology Information (K-13-L01-C02).