
Abstract
This paper proposes the incorporation of engineering knowledge through both (a) advanced state-of-the-art preference handling decision-making tools integrated in multiobjective evolutionary algorithms and (b) engineering knowledge-based variance-reduction simulation as enhancing tools for the robust optimum design of structural frames taking uncertainties into consideration in the design variables. The simultaneous minimization of the constrained weight (adding structural weight and average distribution of constraint violations) on the one hand and the standard deviation of the distribution of constraint violation on the other are handled with multiobjective optimization-based evolutionary computation in two different multiobjective algorithms. The optimum design values of the deterministic structural problem in question are proposed as a reference point (the aspiration level) in reference-point-based evolutionary multiobjective algorithms (here g-dominance is used). Results including S-metric statistics in a structural frame test case with uncertain loads show considerable reductions in computational costs without harming the nondominated front quality, obtaining a design set that makes it possible to select minimum weight and maximum robustness optimum designs.
1. Introduction
Evolutionary algorithms have been applied since their origins [1] in the mechanical and structural optimization field. Their global optimization nature, derived from the fact that they are based on population searches, enables them to avoid the stagnation in frequent local minima that occurs in structural problems. In addition, they permit discrete optimization, matching real requirements in metallic bar structures. They have been applied in bar structures, trusses, and frames, as well as in metallic or concrete structures; surveys of the state of the art can be found in [2–4]. Their principal aim has been focused on the weight minimization problem, which is directly related with the raw material cost. It is an ongoing active field in mechanical and structural design (see e.g., [5]).
Evolutionary multiobjective algorithms have been developed since the mid nineteen eighties, but their success in a wide range of science and engineering fields has really taken off since the late nineties [6]. These population-based global search algorithms also have extensive applications in the structural design field, for example, in [7–9]. The incorporation of engineer/decision maker preferences in the evolutionary multiobjective optimization process has been a topic of increasing interest in recent years (e.g., [10–13]). This is particularly so, when engineer/decision maker preference information is considered to constitute desirable aspiration levels for objective functions; the use of a reference point when using evolutionary multiobjective computation has led to various recent proposals: Ben Said et al. propose the r-dominance in [14], Deb et al. propose the r-NSGAII in [15], and Thiele et al. [16] and Molina et al. propose the g-dominance in [17].
There has been a general move to include uncertainties in optimum engineering design and this has played a key role in the field of multidisciplinary design optimization (MDO) [18]. In particular, in the field of structural design optimization, two approaches are considered: reliability-based design optimization (RBDO) and robust design optimization (RDO) (see [19–21]). Some recent research work in structural engineering design is by Coelho [22] and by Greiner and Hajela [23].
A review of structural optimization for robust design [24] can be found by Doltsinis et al. [25], where robust truss design is performed by optimization of the mean and variance of the fitness function considering a weighted approach for optimization and a Taylor series approach for simulation. A Monte-Carlo simulation coupled with a hybrid optimization is carried out by a single-objective genetic algorithm for topology identification and conventional nonlinear programming for continuous cross-section design; reducing the response of fluctuations is performed by Sandgren and Cameron [26]. Structural truss robust design has been handled by Lagaros et al. in [27, 28] considering multiobjective optimization evolutionary methods with a priori articulation of preferences (cascade evolutionary algorithm), for simultaneous minimization of the weight and response (characterized by one point displacement), as well as in [29, 30]. A review of robust optimal design in dynamics is also done by Zang et al. [31].
Although other approaches are possible, Monte-Carlo simulations are still useful tools when dealing with uncertainties in multiobjective design [22]. A structural robust design optimization of frames with engineering knowledge-based variance-reduction simulation that allowed a high reduction in computational cost in terms of the required number of fitness function evaluations versus a previous conventional approach was proposed by Greiner et al. [32]. This paper proposes to combine that approach with the consideration of the engineer/decision maker's preference information as desirable aspiration levels for objective functions (reference point(s)) when using evolutionary multiobjective computation. These aspiration levels are materialized in the case of robust design as the values of the fitness function of the optimum design of the deterministic problem (without considering uncertainties) as well as zero variation of the performance function, as proposed by Greiner et al. [33]. In this paper we introduce a methodology that consists of the combination of preference-based multiobjective evolutionary algorithms introducing aspiration levels as a reference point; here, the g-dominance is used, with engineering knowledge variance reduction in the Monte-Carlo simulation process for improving computational performance of robust design in structural engineering.
The structure of the paper is as follows. In Section 2 the structural problem addressed is presented, introducing first the deterministic problem and later a design dealing with uncertainties. Section 3 briefly describes evolutionary multiobjective algorithms and the incorporation of preference information as aspiration levels with reference point information, used in the optimization procedure. Later, Section 4 explains the structural frame test case considered. Then, Section 5 gives the results and discussion, including a comparison between the standard and proposed reduced simulation procedures. Finally, the paper ends with the conclusions section.
2. The Structural Problem
2.1. Deterministic Design
The fitness function, in order to perform the constrained weight minimization, has to take into account those proper requirements of the bar structure to perform its mission. Its value is directly related with the acquisition cost of raw material of the metallic frame. The information needed by the fitness function is obtained through the direct stiffness method and the following constraints are applied, in order to guarantee the appropriate functionality of the structure.
Stresses of the bars, where the stress limit depends on the frame material (e.g., common construction steel has a stress limit of 2600 kgp/cm2) and the stress compared takes into account the axial and shearing stresses by the shear effort and also the bending effort, using Von Misses yield criteria. For each bar, (1) has to be accomplished. Consider

where σ co refers to the comparing stress (maximum stress of the bar) and σ lim refers to the limit stress.
Compressive slenderness limit, for each bar where the buckling effect is considered (the value in question may vary, depending on the particular code used) (2) has to be satisfied. Consider
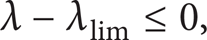
where λ refers to the slenderness compared (compressive slenderness of the bar) and λ lim refers to the limit slenderness.
Displacements of joints or middle points of bars are also possible requirement, as observed in (3). Consider
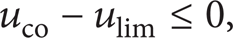
where u co refers to the displacement compared and u lim refers to the limit displacement.
With these constraints, the fitness function constrained weight integrates the constraints violations as weight penalties, as shown in

where A i is the area of the bar section type i; ρ i is the density of bar i; l i is the length of bar i; k is the constant that regulates the equivalence between weight and restriction (suitable values around one); viol j , for each violated restriction j, is the quotient between the violated restriction value (stress, displacement, or slenderness) and its reference limit.
2.2. Robust Design
2.2.1. Introduction
The deterministic optimum design of a bar structure is frequently defined by the constraints imposed in terms of stress, displacement, or buckling, which are taken up to, but not over, their limit values.
In real structures, loads often vary and this is taken into consideration in the design codes. So, a deterministic optimized structure, in which the corresponding constraints come close to limit values, is expected to be more sensitive to those random variations. An analysis of those uncertainties is required to guarantee a robust design. The principal objective of robust design is to find a solution in which structural performance is less sensitive to the fluctuations of parameters without eliminating their variation.
The variation in load actions that act on a structure from the viewpoint of probabilistic or semiprobabilistic safety criteria is related to the consideration of loads as random variables and with the existence of some ultimate limit states that lead to total or partial ruin of the structure and some serviceability limit states that they, when reached, produce malfunction [34–36]. In order to define the actions, it is assumed here that the corresponding variation follows a Gaussian probability density function. The characteristic value of an action is defined as the value that belongs to the 95% percentile; that is, the probability of it being exceeded is 0.05 (see (5)). Consider

where F k is the characteristic value, F m is the average value, k is the coefficient corresponding to the percentile of 5% = 1.64, and δ is the typical deviation of the average value expressed per unit variation. A structure is usually calculated taking into account the characteristic values of the actions, which are defined based on said actions and depending on the specific national code in question.
2.2.2. Problem Definition
The mathematical formulation of the robust design problem is as follows.
One individual is a structure E of cross sections (CS1, CS2, CS3, …, CS r ), r being the total number of bars in the structure, with weight w and statistical parameters (Constraint E , σConst E ) that are the average and standard deviation, respectively, of the constraint violations (the total number of constraint violations per structure is numviol), as shown in


where m is the number of Monte-Carlo simulation samples. In this paper, m is evaluated by two different procedures.
Standard Monte-Carlo:
m = 30 n , n being the number of random variables.
Reduced procedure (engineering knowledge-based variance-reduction Monte-Carlo):
m = card (Q), Q being the set of samples such that

F i is the effective applied load and F ki the characteristic value; those samples belonging to m are the only cases proposed to be evaluated by the finite element code; the contribution of the rest of the cases to the constraint violation distribution is estimated to be zero; therefore, they do not need to be evaluated by the finite element code with the corresponding computational cost saving [32].
Multiobjective robust design problem (as opposed to the formulation of deterministic design that does not take uncertainties into consideration, shown in (4)) consists in finding E such that (9) and (10) hold. Consider


3. Evolutionary Multiobjective Algorithms and Preferences Inclusion through Reference Point
Here, the g-dominance approach (as a method of considering desirable aspiration levels in evolutionary computation) has been used in two evolutionary multiobjective algorithms: NSGAII [37] and SPEA2 [38], although the methodology would be equally valid using other approaches with similar characteristics. G-dominance enhances those solutions that either (a) dominate the reference point or (b) are dominated by the reference point, discriminating all the others. So, when we are interested in the environment of a certain point in the objective space, it is a very useful tool. From the perspective of decision making, the preference information of the decision maker is given here as the reference point coordinates. Two ways of implementing g-dominance are proposed in [17]: (a) changing the dominance-checking function and (b) changing the evaluation of the objective functions by greatly penalizing those solutions which do not belong to the area of interest as described previously. Here, the latter option (in [17] claimed to be the simplest) is used.
The use of g-dominance for robust optimization of structural bars was first introduced by Greiner et al. [33]. In our structural problem, there is engineering knowledge that can help in defining our aspiration levels (i.e., our reference point in the g-dominance). When no uncertainties are taken into account, the optimum design is a deterministic one, and when constraints are present, it should satisfy all of them (i.e., no constraint violations are allowed). By contrast, when some of the external variables/parameters are random variables, we are dealing with uncertainties. The above-mentioned deterministic optimum design often lies on the boundary of the constraints violation and when considering the external random variables, then it is highly probable that this deterministic optimum violates the constraints in this uncertain environment. In our structural frame optimization problem, a robust design implies the achievement of designs with (1) average low constrained weight (good performance) and (2) low constraint violation standard deviations (sensitivity to external variations is minimum: zero variation in the deterministic case). Both 1 and 2 are two simultaneous minimization objectives. Therefore, we consider the function values of the deterministic optimum design as estimators of a lower limit of the solutions when considering uncertainties in the optimization, because it is expected that those deterministic optimum values dominate the designs of the problem when considering random variables. That is, those values are the aspiration levels considered as a reference point in the g-dominance criterion.
Therefore, the deterministic optimum design fitness function values are taken as the reference point in g-dominance for multiobjective optimization when considering uncertainties in the design. The advantages of combining this approach with the engineering knowledge-based variance reduction simulation in terms of computational time reduction are shown in the results section.
4. Test Case
The reference test case considered is based on a problem taken from [39] for single objective weight minimization using continuous variables. The solution reported in the previous reference using classical optimization methods was improved using evolutionary algorithms from [40, 41], where the discrete optimization problem using real cross-section types and including the buckling effect was also solved. This last deterministic evolutionary optimum design is taken as a reference in this work and compared with the robust optimum design nondominated front.
The test case is depicted in Figure 1, where the spot lengths (10 and 20) and height (6) are in meters, the loads in kN/m, 14.7, 9.8, and 1.96, and there is a constraint of maximum displacement of middle point of bar 2 equal to length/300, that is, 6.67 · 10−2 m. It is a discrete domain problem, belonging the cross-section types to the European IPE class (16 different types per bar). The buckling effect and its own gravitational load have been taken into account. The density considered (7.85 · 10−3 kg/m3) and Young modulus (205.8 · 109 Pa) are common steel values and the yield stress is 235.2 · 106 Pa (the structure is assumed to be in elastic behaviour).

Frame test case with four bars.
In addition, a second test case is analysed (incremented loading test case), where all the loads are increased by 5% in value, maintaining the rest of the characteristics as in the previous test case.
5. Results and Discussion
Ten independent executions were performed for each multiobjective evolutionary algorithm. Specifically, multiobjective genetic algorithms (both NSGAII and SPEA2) were used with a population size of 200 individuals, uniform crossover, and uniform mutation rate of 0.06 [42]. A stop criterion of 100 generations was considered in all cases.
5.1. Standard Procedure
The standard Monte-Carlo simulation was performed considering 30 N simulations per structural design in order to construct the constraint violation distribution, N being the number of different variables considered. Here, the simulated variables correspond to the three linear uniform loads of the frame structure, one for each loaded bar.
The distribution of each linear uniform load is simulated through a Gaussian distribution, which is calculated considering the test case load value to be the characteristic value. Therefore, three independent Gaussian random variables are considered: the loads applied on bars 1 and 2 have been assigned a lower standard deviation than the load applied on bar 3, which could be assimilated as wind load and has been assigned a higher variation. Their distributions are represented graphically in Figure 2.
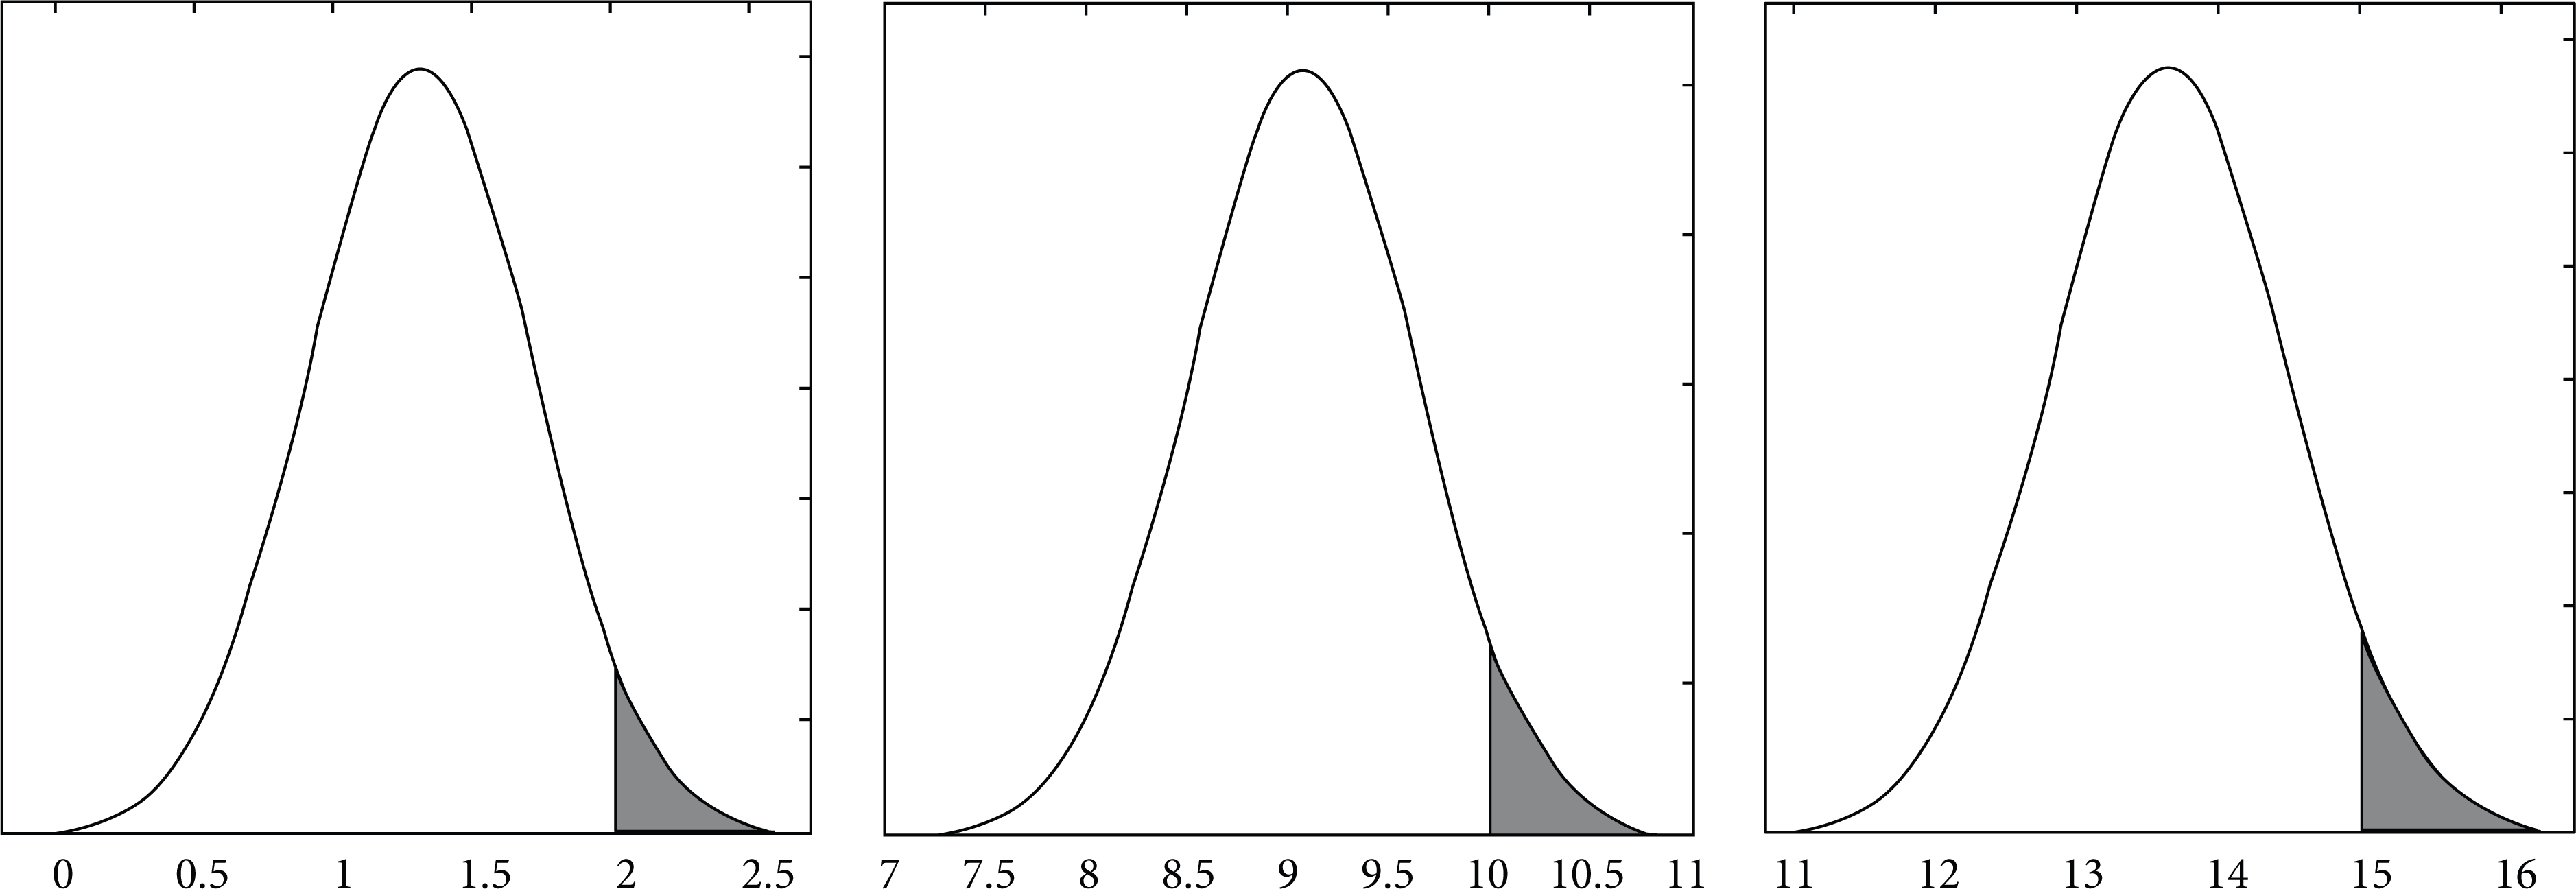
Test case load distributions, with shaded zones corresponding to the values greater than the characteristic load (in 10−1 · T/m), equivalent to 1.96, 9.8, and 14.7 kN/m, respectively.
Optimization results are shown by Greiner et al. [43] and graphically combined in Figure 3 (NSGAII and SPEA2), which shows the final nondominated front evaluated from the accumulated total number of executions performed using both algorithms. The x-axis belongs to the constrained weight value (in kg), obtained by adding the weight of the particular structural design and the average of the constraints violation distribution in terms of weight, where the constraint violation is evaluated as in (6). The y-axis belongs to the typical deviation of the constraints violation distribution in terms of weight.
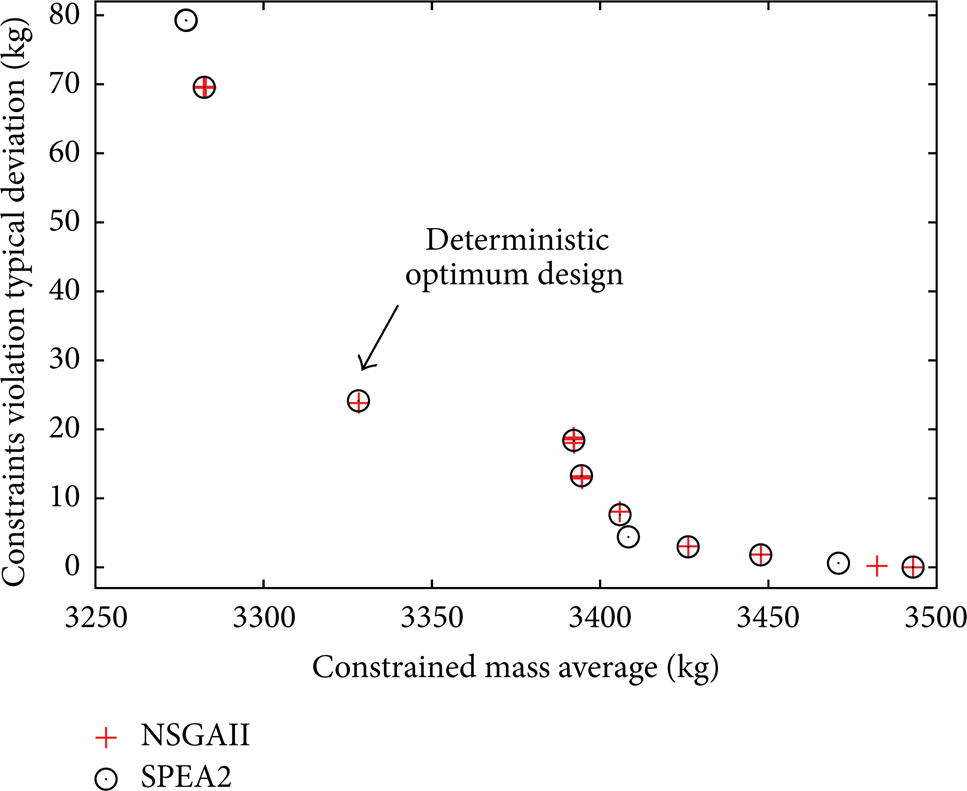
Final nondominated front obtained by accumulated SPEA2 and NSGAII executions (constrained weight versus constraint violation typical deviation, kg) [43].
A total of twelve different frame structural designs make up the Pareto optimal front obtained. They are detailed graphically in Figure 3. Due to the stochastic character of Monte-Carlo simulations, it is possible to achieve different values of the objective functions for a single design. However, the differences between them are minor, indicating that the system simulation has been suitably performed.
The two algorithms (NSGAII and SPEA2) perform similarly and are capable of locating the extreme frame structural design solutions. The number of final Pareto front designs located is similar when the nondominated front obtained by accumulating the whole solution set is taken into account: 14 in NSGAII and 12 in SPEA2. Both algorithms also found all the twelve design solutions, although the constraint variations caused by the Monte-Carlo simulation produce the effect that some of these points are dominated and not shown in the final front results (Figure 3).
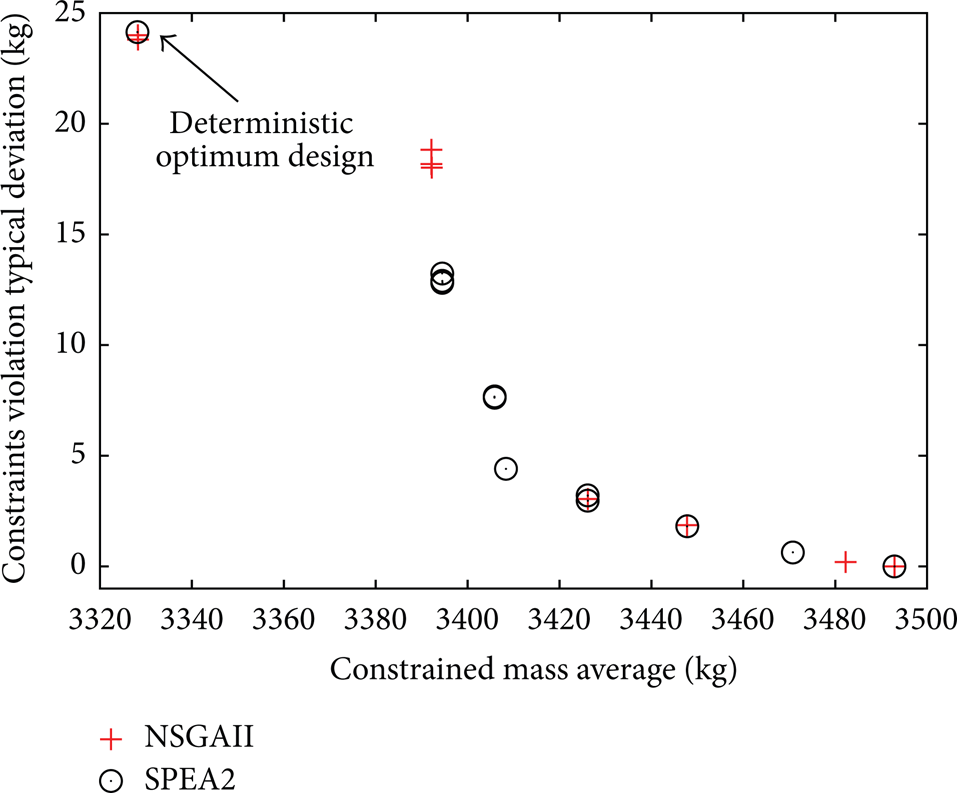
The deterministic optimum design, whose loads have the characteristic value of the imposed Gaussian distributions, has no constraint violations and a weight of 3324.3 kg. Its corresponding design for uncertain loads is highlighted in bold type in Table 1 and also arrowed in Figure 7. When the robust design including the load variations is considered this design is seen to violate the constraints on certain occasions, with a standard deviation and mean distribution of 24.1 kg and 3.8 kg, respectively. Therefore, the engineer or decision maker should select an individual among this deterministic optimum design and the solution located furthest to the right of the front, which has no constraint violations at all, even when uncertainties are taken into consideration (corresponding to a design weight of 3492.9 kg and 5.1% higher in terms of weight; see Table 1).
Detailed nondominated structural frame designs of Figure 7.

5.2. Reduced Procedure
The standard Monte-Carlo simulation evaluates 303 = 27000 structures for each evolutionary computation solution candidate in our test case. Here, the variance reduction procedure inspired by the well-known importance sampling Monte-Carlo technique [44] and based on engineering design knowledge is used to reduce the computational cost without losing solution quality. It was first introduced by Greiner et al. [32], where the NSGAII algorithm was used as an optimizer.
Structural evaluations are required to calculate the possible constraints produced by each load case and hence their contribution to the constraint violation distribution. Its standard deviation is chosen as the measure of structural robustness of each design; the structure with the lowest weight and zero standard deviation corresponds to the solution located further to the right of the Pareto frontier; by contrast, the structure with the highest typical deviation and lowest weight corresponds to the solution located on the far left of the Pareto frontier.
Considering the constant load of the deterministic optimization problem as the characteristic value (i.e., the value belonging to the 95% percentile) of the Gaussian model in the problem that handles uncertainties, the reduced procedure (as explained in Section 2.2.2) proposes evaluation only of those load cases that surpass at least one of its characteristic values (1.96, 9.8, and 14.7 kN/m, as shown in Figure 2) for each structural design. Therefore, it is estimated that only 1 – 0.953 = 0.142625, (14.2625% in percentage) of the load cases will be evaluated using this reduced simulation procedure, with the proportional benefit in terms of computational cost (here, only 3,850 structural design evaluations out of 27,000). The rest of the cases are assigned a null contribution to the constraint distribution. Here, results corresponding with the SPEA2 multiobjective optimizer are obtained and shown in Figure 4. They are very similar to the results obtained with the NSGAII in [32].

Accumulated nondominated fronts of each of the ten independent executions by SPEA2 (a) and their nondominated solutions (b). Reduced distribution.
A total of thirty-three different frame structural designs make up the Pareto optimal front obtained, as had previously been achieved using NSGAII by Greiner et al. [32]. They are detailed graphically in Figure 5, where NSGAII and SPEA2 results are compared. Behaviour in the two cases is similar and they are both capable of locating the extreme frame structural design solutions. The number of final Pareto front designs located is similar to that of the nondominated front obtained by accumulating the whole solution set: 33 in NSGAII and 23 in SPEA2. Both algorithms also found all thirty-three design solutions, although the constraint variations caused by the Monte-Carlo simulation produce the effect that some of these points are dominated and not shown in the final front (Figures 5 and 6).

Final nondominated front obtained by accumulated SPEA2 and NSGAII executions (constrained weight versus constraint violation typical deviation, kg). Reduced Distribution.

Final nondominated fronts obtained by the standard (circles) and reduced (crosses) distributions, starting with the deterministic optimum solution at top left. The two coincide (constrained weight versus constraint violation typical deviation, kg).
Final accumulated nondominated front obtained by accumulated standard and reduced distributions (constrained weight versus constraint violation typical deviation, kg).
A comparison of these results with the standard procedure ones (as in [32, 43]) shows that the reduced simulation procedure obtains a wider front, both in terms of the number of structural designs obtained (33 versus 12) and in terms of numerical values (the left nondominated solutions reach 782.2 kg and 2998.4 kg in terms of typical deviation and constrained weight average, resp., versus the standard distribution values located furthest to the left of 79.3 kg and 3276.9 kg, resp.). This is due to the fact that the contribution to the constraint distribution in the reduced procedure is limited to the cases where the characteristic load value is exceeded, and therefore, there are structures with reduced lesser constraint average, which is added to the structural weight and considered in the x-axis fitness function value, than in the standard simulation where these structures were dominated designs (Figure 3) and so appear as new nondominated designs in the nondominated set (Figure 5).
It is worth pointing out that if the engineer or decision maker's preferences are properly considered, both procedures (the standard Monte-Carlo and the reduced procedure) achieve equivalent nondominated frame designs. The engineer or decision maker has to choose a structural design between two extremes of the nondominated frontier:
the extreme right, where the solution of the nondominated set (highest constrained weight and null typical deviation) that represents the structural design has no constraint violation, even when considering uncertainties;
the extreme left, where the solution of the nondominated set in the case in which the uncertainties of the load were not considered has the lowest weight and no constraint violation, which corresponds to the structural design that coincides with the deterministic optimum.
Therefore, when the useful functional space is restricted to the above-mentioned extreme points, both procedures (standard and reduced) lead to the same nondominated design set. This can be seen in Figure 6, where the accumulated nondominated fronts of both the SPEA2 and NSGAII algorithms and of each procedure (the standard and the reduced) are depicted. This, in turn, is explained because the two simulation procedures produce identical constraint distributions in those nondominated structural designs, where the characteristic load values are surpassed. Indeed, the first design where the two procedures coincide becomes the deterministic optimum design solution; so, a comparison of the two distributions could lead to a method that achieves the deterministic optimum design, where no load uncertainties are involved. The slight variations in the depicted solutions are due to the stochastic nature of the Monte-Carlo simulation, but the proximate points represent the same structural design.
In Figure 7, the whole set of accumulated nondominated solutions are shown graphically, differentiating the evolutionary multiobjective algorithms with which they were obtained. These designs are detailed numerically in Table 1, where the bold type corresponds to the deterministic optimum design. This table shows the constrained weight (x-axis fitness function, obtained by adding the structural weight and the constraint violation distribution average), constraint violation typical deviation (y-axis fitness function), constraint violation average, and detailed cross-section, as well as the algorithm type, for each nondominated structural design corresponding to those preferences that are useful for the decision maker. A total of ten structural designs were identified.
5.3. S-Metric Statistics
The reference point in the g-dominance is (3324.3, 0), the first value being that which corresponds to the minimum constrained weight of the deterministic optimum design (as published in [41]) and the second value corresponding to the aspiration level of the standard deviation of the violation of constraints distribution, which is a null variation.
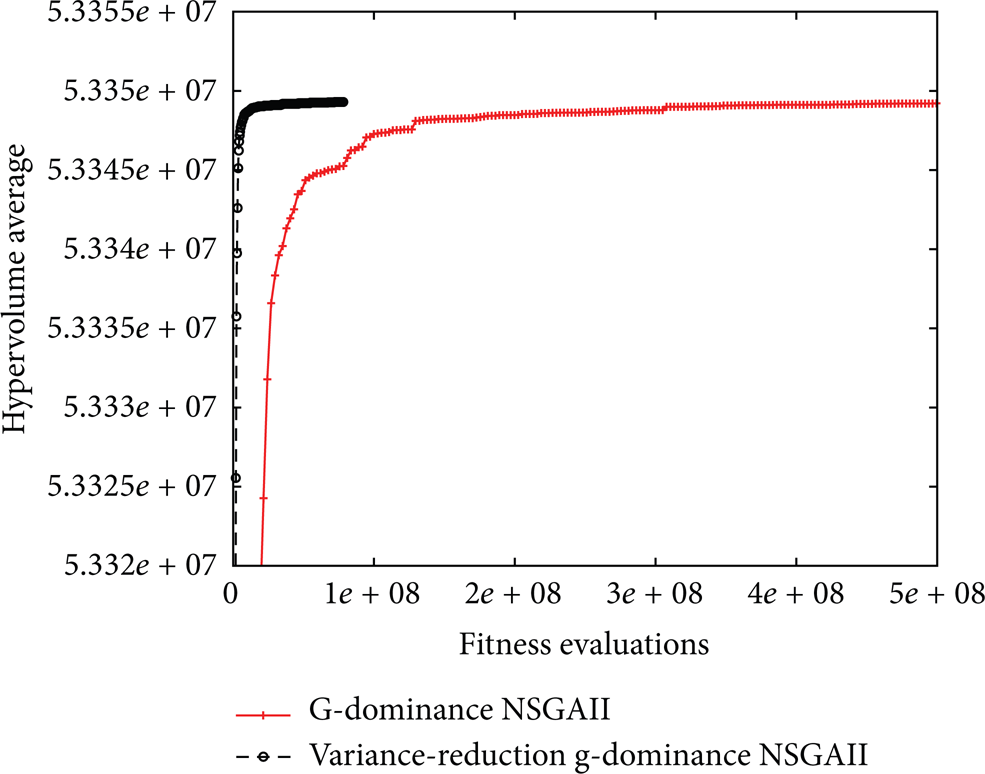
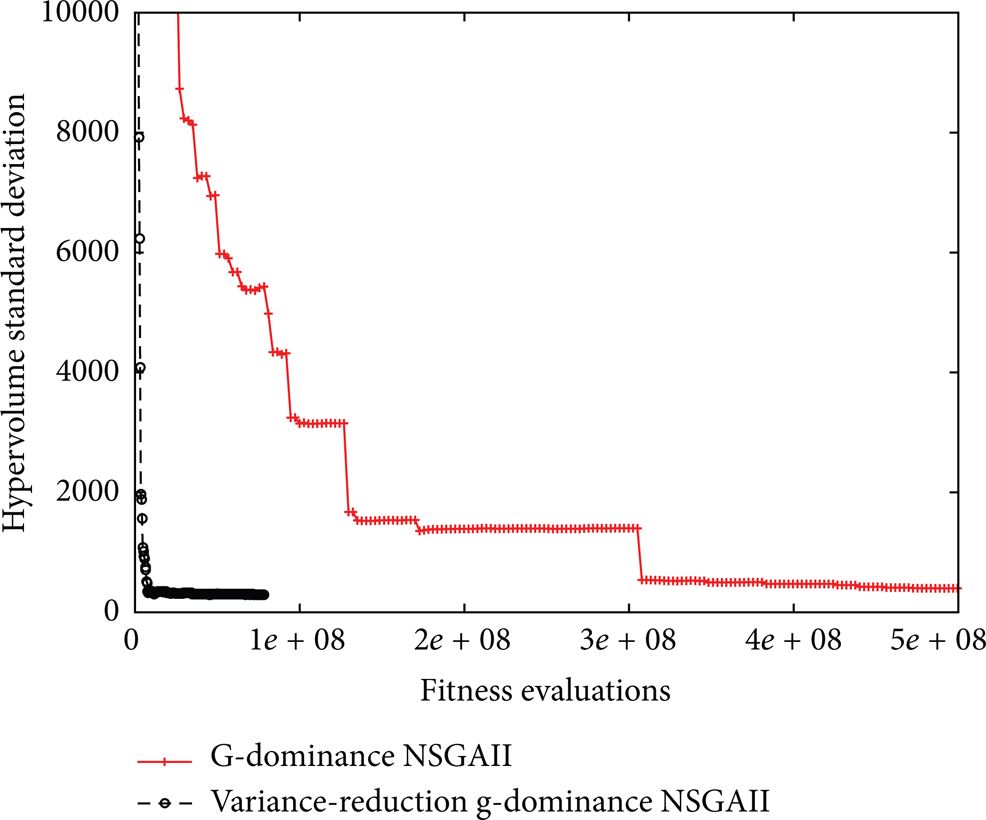
In addition, in order to compare the convergence of the algorithm, the S-metric (or hypervolume metric), originally proposed by Zitzler and Thiele [45, 46], has been calculated as “running metrics” [47]. This is an unary metric that evaluates both approximation and coverage of the nondominated front. Specifically, the S-metric evaluation proposal of Fonseca et al. [48] is considered. The reference point for its calculation is (30000, 2000), a value which guarantees that it is dominated by the design solutions. Results are shown in Figures 8 to 19, where the horizontal axis represents the number of structural finite element evaluations and the y-axis represents the values of S-metric average (Figures 8, 11, 14, and 17), best (Figures 9, 12, 15, and 18) and standard deviation (Figures 10, 13, 16, and 19), out of thirty independent executions of NSGAII (Figures 8 to 13) and SPEA2 (Figures 14 to 19). Two population sizes are shown (100 and 200 individuals) for both NSGAII and SPEA2 algorithms, as are the two simulation procedures (standard and reduced).
Average of S-metric (30 independent executions), NSGAII with g-dominance, comparing standard and variance reduction Monte-Carlo. Population size is 100.

Best of S-metric (30 independent executions), NSGAII with g-dominance, comparing standard and variance reduction Monte-Carlo. Population size is 100.
Standard deviation of S-metric (30 independent executions), NSGAII with g-dominance, comparing standard and variance reduction Monte-Carlo. Population size is 100.

Average of S-metric (30 independent executions), NSGAII with g-dominance, comparing standard and variance reduction Monte-Carlo. Population size is 200.
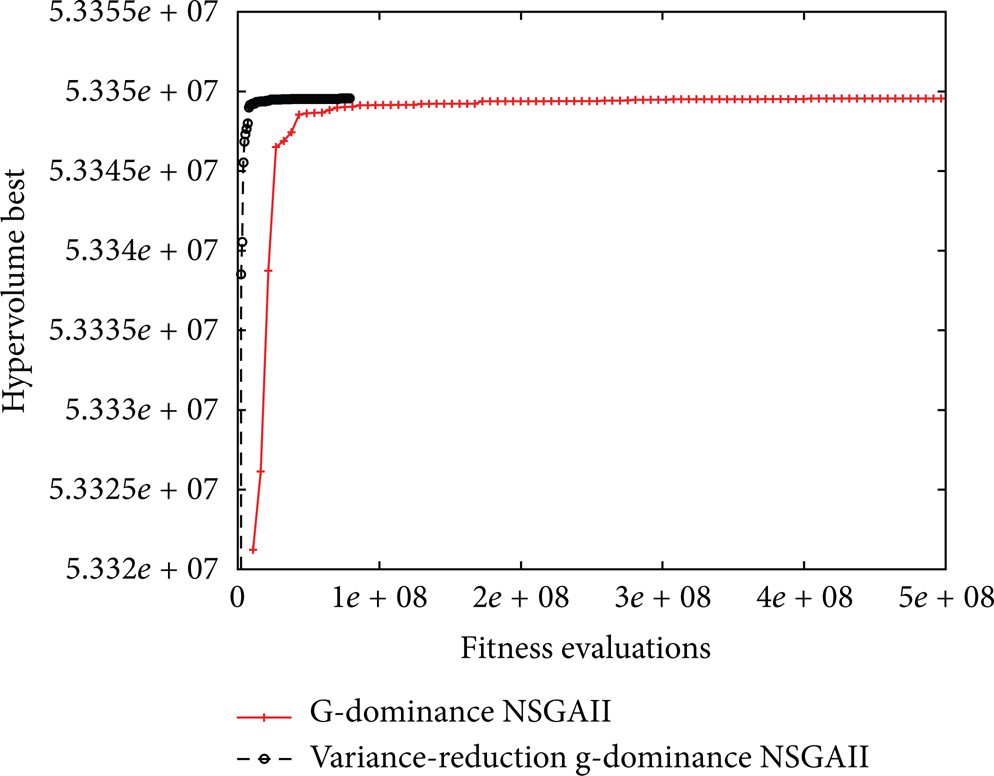
Best of S-metric (30 independent executions), NSGAII with g-dominance, comparing standard and variance reduction Monte-Carlo. Population size is 200.

Standard deviation of S-metric (30 independent executions), NSGAII with g-dominance, comparing standard and variance reduction Monte-Carlo. Population size is 200.

Average of S-metric (30 independent executions), SPEA2 with g-dominance, comparing standard and variance reduction Monte-Carlo. Population size is 100.

Best of S-metric (30 independent executions), SPEA2 with g-dominance, comparing standard and variance reduction Monte-Carlo. Population size is 100.

Standard deviation of S-metric (30 independent executions), SPEA2 with g-dominance, comparing standard and variance reduction Monte-Carlo. Population size is 100.
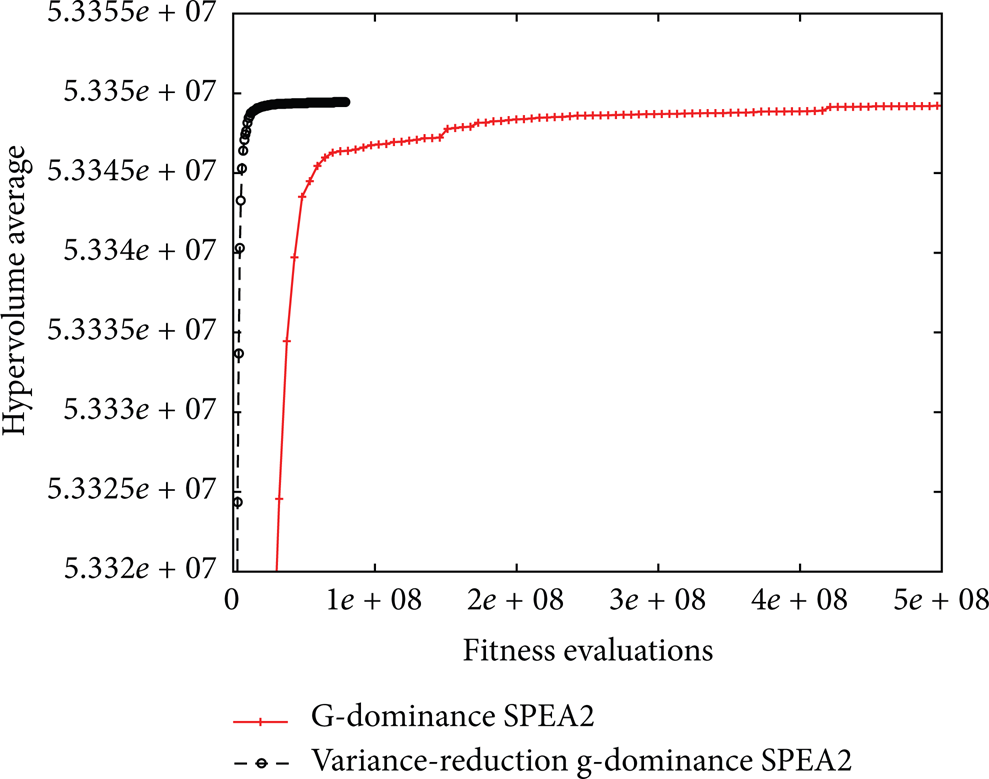
Average of S-metric (30 independent executions), SPEA2 with g-dominance, comparing standard and variance reduction Monte-Carlo. Population size is 200.

Best of S-metric (30 independent executions), SPEA2 with g-dominance, comparing standard and variance reduction Monte-Carlo. Population size is 200.

Standard deviation of S-metric (30 independent executions), SPEA2 with g-dominance, comparing standard and variance reduction Monte-Carlo. Population size is 200.
All the Figures from 8 to 19 show clearly the significant advantage of the combination of g-dominance with engineering knowledge-based variance-reduction simulation (black dots) versus the standard Monte-Carlo simulation (red crosses), in terms of better averages, best and standard deviation values in all the algorithms (NSGAII and SPEA2), and both population sizes (100 and 200).
5.4. An Additional Test Case: Increasing Loads
In this second test case, as explained at the end of Section 4, we have considered an increment of 5% in the loads; therefore, in the deterministic case, each load is increased by 5% in value; in the case of uncertainty handling, each of the three independent Gaussian distributions is increased by 5% in mean value and their standard deviations remain constant. The optimization results are obtained, performing 10 independent executions, a population size of 200, a stop criterion of 100 generations, a mutation rate of 6%, and uniform crossover.
After optimization, the deterministic optimum design gives a weight of 3408.16 kg and its constraint violation is null (the design cross section types are Bar 1 = IPE-400, Bar 2 = IPE-550, Bar 3 = IPE-160, and Bar 4 = IPE-500).
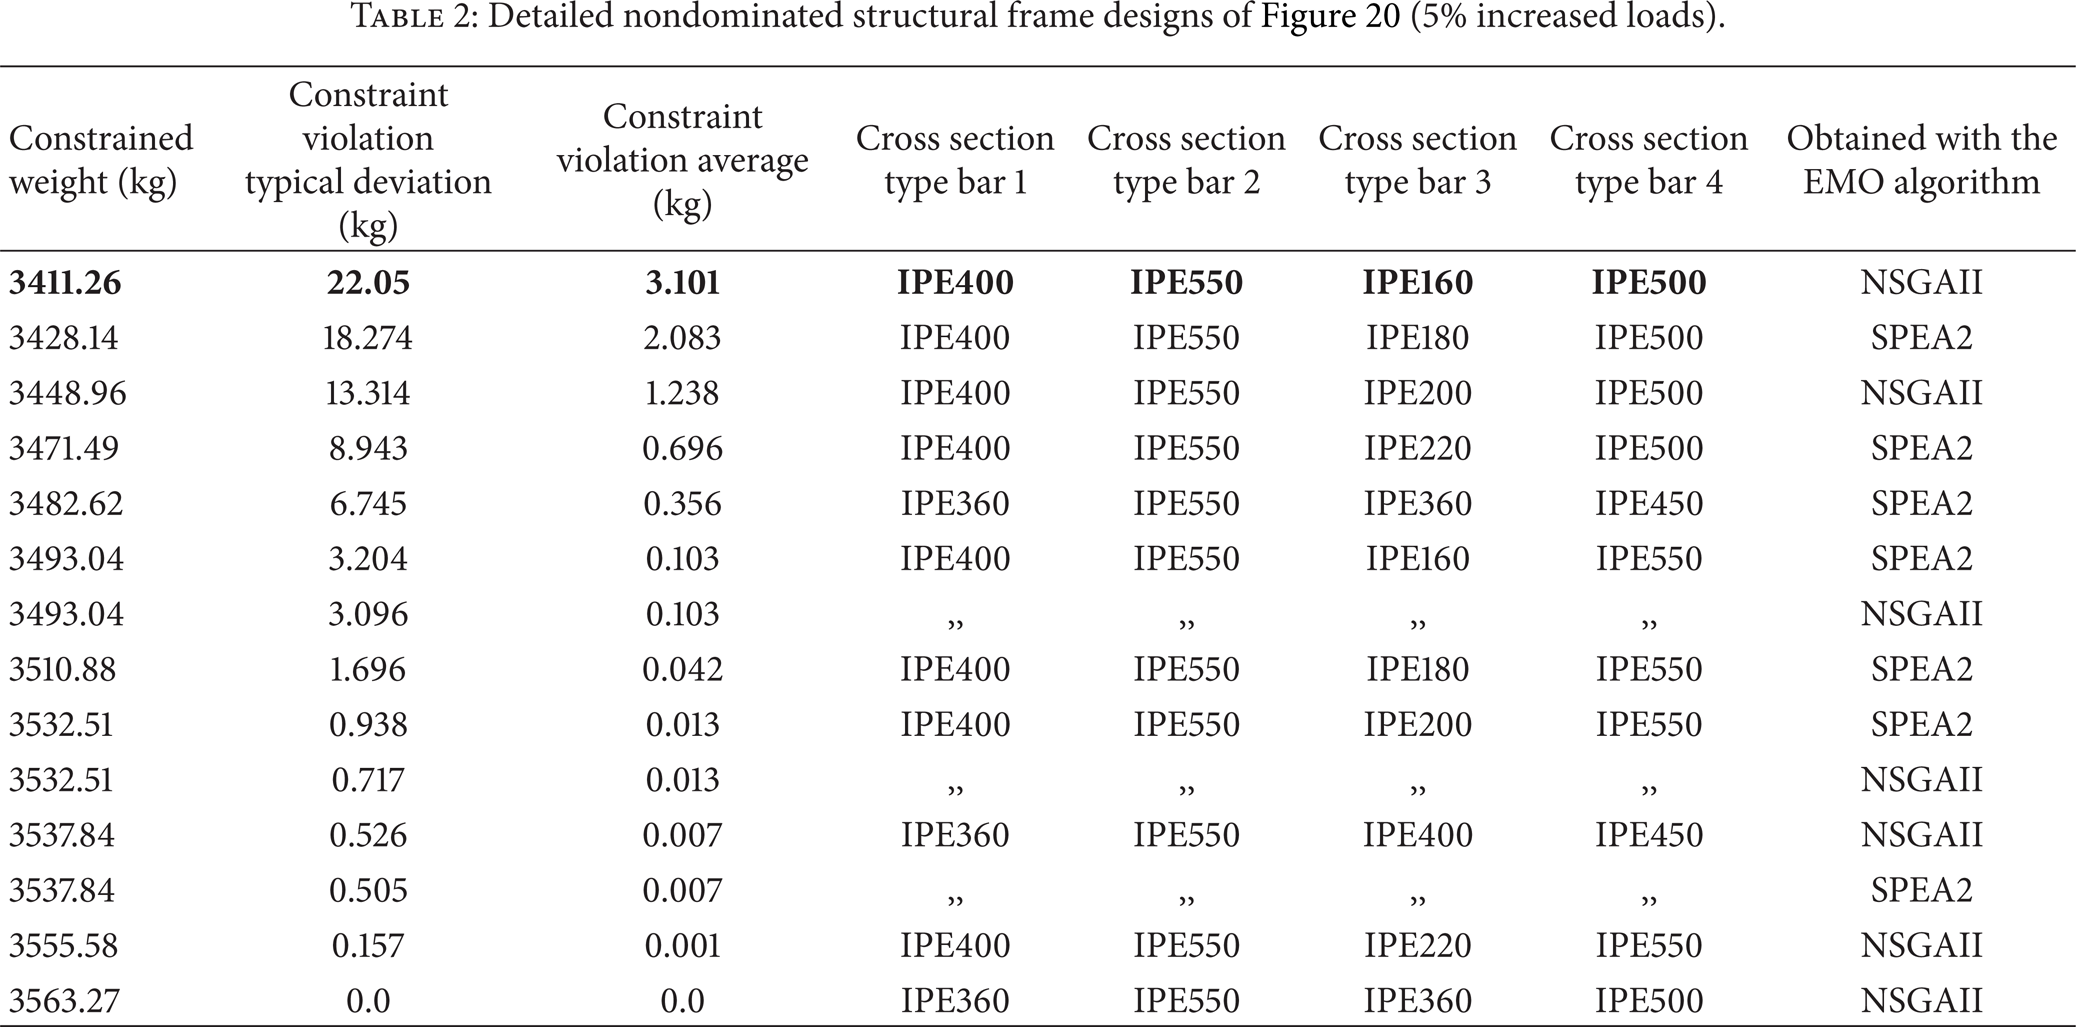
Robust design results are shown in Table 2 and represented graphically in Figure 20. The design furthest to the left belonging to the nondominated front is represented in Table 2 in bold type, and it corresponds again to the deterministic optimum design (whose fitness function values have been considered in the reference point of the g-dominance). A total of eleven different designs make up the nondominated solutions. Both algorithms (NSGAII and SPEA2) are once again able to obtain the whole front; the best solutions of accumulated fronts are shown with an indication of which algorithm achieved each.
Detailed nondominated structural frame designs of Figure 20 (5% increased loads).
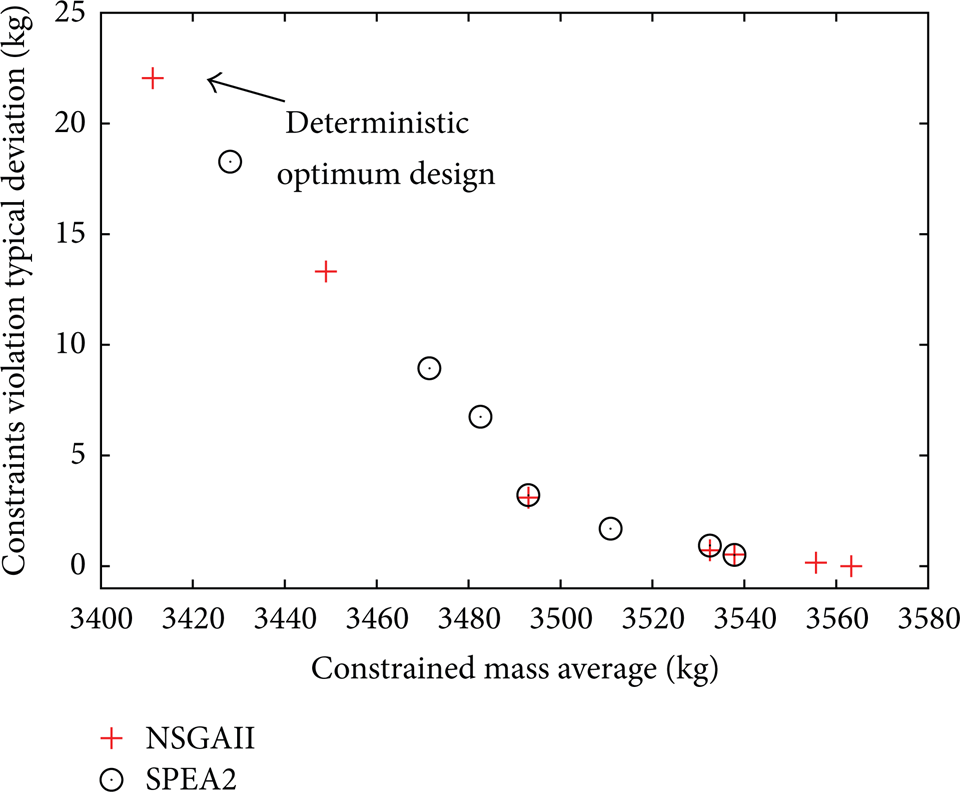
Final nondominated front obtained by accumulated SPEA2 and NSGAII (constrained weight versus constraint violation typical deviation). Reduced distribution (5% increased loads).
Figure 21 shows a comparison between the best designs of the original test case (represented by crosses) and the incremented loading test case (represented by circles). In the increased load case, the whole front is displaced to the right, which constitutes an increment in the optimum design weight when the load values are increased. A comparison with the solution furthest to the right (which has null constraint violations) in Tables 1 and 2 shows an increment of 5% in the value of the loads corresponding to an increment of 2.01% in the weight (3563.27 kg in Table 2 versus 3492.94 kg in Table 1). Moreover, some designs belong to both nondominated fronts; specifically, the six lowest designs of Table 1 overlap with the six highest designs of Table 2, as depicted with letters A, B, C, D, E, and F in Figure 21 (each letter corresponds to the same structural design).

Final nondominated front obtained by accumulated SPEA2 and NSGAII (constrained weight versus constraint violation typical deviation). Comparing test cases.
6. Conclusions
This paper has proposed, implemented, and verified a procedure for the robust optimum design of frame structures with real discrete cross-section types consisting of the simultaneous incorporation of engineering knowledge through
an engineering knowledge-based variance-reduction Monte-Carlo simulation based on important sampling methods, and
the incorporation of the engineer/decision maker's preferences, as desirable aspiration levels, in terms of the consideration of the deterministic optimum design values (knowledge of variable values is not required) as a reference point in the g-dominance implemented in evolutionary multiobjective algorithms. This second aspect could be applied with no loss of generality with any other reference point preference-based evolutionary algorithm.
Uncertainty has been dealt with by including all the possible factors of constraints violation (stresses, displacements, and buckling effect) in the final designs. Two objectives were simultaneously minimized: first, the constrained weight (representative of system performance), by adding the weight of the structure and the average constraint violation penalty distribution; second, the typical deviation of the constraints violation penalty distribution (representative of system sensitivity).
Although each of these two engineering knowledge aspects alone is useful per se, the combination of the two adds considerable value as shown in the statistical analysis of the S-metric in terms of average, best, and standard deviation in the frame structural test case addressed. This methodology enhances efficiency in the global stochastic search in robust optimum structural engineering design.
Footnotes
Acknowledgments
This work has been partially funded by Research Project ULPGC2008-009. Also computational resources are supported by Project UNLP08-3E-2010 of the Secretaría de Estado de Universidades e Investigación, Ministerio de Ciencia e Innovación (Spain), and FEDER.