
Abstract
First, this paper compiled a retrospective of the disputes and reviewed relevant research findings of street network patterns and pointed out that there is still a lack of deep and ongoing research into street patterns and their characteristics from the visual angle of traffic efficiency. By applying operation research, a very important theoretical method, and facing raising traffic efficiency and reducing travel time, this paper analyzed the advantages and disadvantages of the street patterns composed of different road densities, road widths, and traffic control measures. Finally, this paper draws the following conclusion after comparison: high-density one-way street network patterns are very suitable for urban core areas and other easily congested areas, but not all areas of a city. In suburbs, peripheral areas, and other noncongested areas of a city, low-density and large-spacing street patterns are more applicable and should be applied more.
1. Introduction
Europe and America and other regions of the world have experienced long-term competition over street network patterns, mainly originating from the invention and use of cars at the beginning of the 20th century. In America, the representative theoretical and practical event for coping with spatial urban planning under rapid motorization was the establishment of the Regional Planning Association of America (RPAA), which pursued the “garden city” in 1923, as well as the Neighborhood Unit mode brought forward by Clarence Perry in this organization. It also pursued the Radburn mode brought forward by another two RPAA members: Clarence Stein and Herry Wright when planning the new Radburn Town [1]. Neighborhood Unit and Radburn mode have brought about tremendous impact on the urban space planning in Europe and America after the 1930s. What is more, the characteristics of modern road transportation planning, like road hierarchy, super block, and the use of boulevards as a traffic artery, and so forth, have all appeared in Neighborhood theory and Radburn mode. In 1963, the British citizen Buchanan still further focused on how to cope with motorized traffic in his urban traffic report and brought forward that the road network systems would centralize neighborhoods and community motorized traffic towards arterial roads. Streets and blocks would be featured by obvious large-size traffic arteries and the super block enclosed by them [2]. In the 20 years from then on, a number of sociologists and urban design experts began to link the form and function of streets with deep-layer social issues like social communication, social safety, social isolation, and so forth. Their research was aimed at balancing the negative impact of motorized traffic on the quality of urban space and urban life and paid attention to the humanistic scale and city animation [3, 4], but they did not change the dominant street planning mode. Until the 1990s, the advocators of New Urbanism pointed out a direction for road network planning-high-connectivity, small-scale, and high-density criss-cross road network, and it was pointed out that such street patterns not only dispersed traffic load and relieved road traffic pressure, but also were convenient for designing and forming livable streets as public spaces [5]. Kentland Community in Maryland, designed by Andres Duany and Elizabeth Plater Zyberk and completed in 2001, is just one of the typical practical cases of new urbanism, and it actually denies the street pattern of Radburn [6]. Along with the development of new urbanism, high-density criss-cross networks have begun to become an area of attention in the practices of American cities recently. Of course, the debate has also begun on whether it can become a dominant pattern during the next stage.
In the research field of traffic engineering, relatively high attention has been maintained to road network density. M. C. Feisheli Song, who held the same viewpoint as Buchanan, has brought forward that when the space between crossings on a trunk road is increased from 200 m to 800 m, the traffic capacity of this road may be increased by 80%. He has proposed that the space between trunk roads will be 800 m, and no other roads will be constructed between trunk roads [7]. This viewpoint is similar to the situation where external vehicles are not allowed to pass through a closed courtyard enclosed by trunk roads, which is common in China at present. It is also considered in the Highway Capacity Manual (HCM2000) of America that decreasing the density of road networks and increasing the spacing between roads may raise the travel speed on roads [8, 9]. However, there are different opinions on this [10–13]. Walter Kulash has developed research from the angle of the proportion of left-turning traffic volume and considered that, in the precondition of the same traffic demand and land area ratio of road, raising the density of road networks may increase the traffic capacity of road entrance at crossings and thus increase the capacity of the entire road network [14, 15]. Herbert S. Levinson held the same viewpoint in his research on the reasonable density standard of trunk road networks in America [16]. Marshall's research findings are worthy of reference, and in his work, he has summarized four street patterns known as A, B, C, and D. These patterns are applicable to old urban areas, expanded areas, suburbs, and residential areas, respectively [17]. This tells us that street patterns in a city are not uniform but are different for different locations within the city [18].
Before the reform and opening, Mainland China basically followed the Neighborhood Unit thought and was willing to construct superblocks and wide roads. However, along with the fast development of the society and economy, on the one hand, it is commonly considered from the angle of openness that super blocks are not beneficial for either sharing social resources or communication and interactions of residents. On the other hand, considered from the angle of reliability, one of the crucial reasons for traffic jams in metropolises is the relatively poor reliability of whole road network due to the sparseness of any trunk road networks at all [19–21]. Therefore, academic circles have begun to give profound consideration to street patterns. From one angle, we may “ask the way” from the western countries and survey the applicability of the high-density road network of American Boston and Spanish Barcelona in China [22]. From another angle, academics here can research street patterns suitable for Chinese cities [23]. Obviously, from the angle of traffic operation efficiency, there is still a lack of relevant research findings at present.
Based on the aforementioned background and based on queuing theory and certain reasonable assumptions, this paper presets several street patterns and compares and analyzes the advantages and disadvantages of different street patterns by starting with traffic operation efficiency. It is expected to provide references and thoughts for road network planning, an important section in the practice of urban transportation planning. This paper attempts to answer the following questions: whether it is possible to prove that high-density street networks are always the best; whether or not low-density street networks are useless in cities; and whether traffic control measures are important in street network design.
2. Research Method
Queuing theory focuses on the phenomenon and working process of random service systems [24, 25]. In reality, we can find many queuing phenomena such as shopping checkouts, boarding a ship or plane, paying toll of vehicles, and waiting for green signals. Queuing theory is a tool to analyze the characteristics of queuing systems in terms of average waiting time, average length of queue, probability of given units, expected number of units in the system, and the like. At present, queuing theory has been widely used for research on design and management of urban transportation system planning. For instance, some experts analyzed and inferred intersection delay formation against nonsaturated and oversaturated traffic conditions of intersections using this theory [26]. Basic formulas in queuing theory could refer to some literatures related to operations research or transportation system analysis methods, which are important but not included in this paper because of limited space. In this paper, intersections will be considered as “service systems,” while the arrival vehicles as “clients.”
The following research plan will be carried out in this paper. First, four patterns of gridded street networks are introduced with various road densities and road control modes. Then, a function of one vehicle's time consumption related to the road land area ratio and arrival rate in a homogeneous space is deduced. The function includes two parts. One part is the delay in intersections; the other part is travel time along a stretch of road between two intersections. Based on the functions, the performances of four street network patterns will be compared and discussed.
Considering the same site area and the road area, according to modern urban transportation planning and traffic engineering theories, we put forward the following assumptions: first, uniformly distributed traffic volume in street networks, based on the assumption that drivers are completely rational. Traffic arrival rate on the way obeys Poisson distribution. The four network patterns and their schematics of the same square-shaped area are then proposed: (1) pattern 1: road section with bidirectional streets of 6 lanes, equal road spacing, and an average road width of 45 meters; (2) pattern 2: road sections with bidirectional streets of 4 lanes, equal road spacing, and an average road width of 30 meters; (3) pattern 3: road sections with bidirectional streets of 2 lanes, equal road spacing, and an average road width of 15 meters; (4) pattern 4: road section with one-way streets of 2 lanes, with alternating driving direction, and an average road width of 15 meters. The road land area in each of the above patterns is equal. So, the numbers of junctions along one road in a random direction are 2, 3, 6, and 6, respectively. The schematics of the four patterns are shown in Figure 1.

Schematics of four road network patterns.
This status is equated with N M/M/1 systems, the simplest queuing model in queuing theory. So, the average delay per vehicle because of waiting before an intersection is calculated as follows:
where
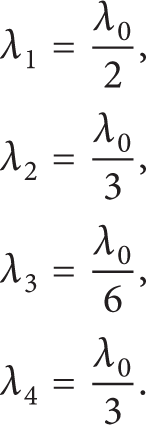
μ i is the average service rate which can be understood as intersection capacity. There are a number of theoretical approaches to confirm the capacity of intersections [27, 28]. To simplify this question, the value of intersection capacity in this paper is obtained from relevant design standards commonly used in China. Therefore, the capacities of intersections in the former three network patterns are as follows: 18.3–20.7, 11.7–14.1, and 6.2–7.8 veh/min. The mid-values in the above numerical value ranges are selected and put into the calculation process. The intersection capacity of one-way roads is different and is not given in the standards. But it is usually considered to be increased by 30 percent to 45 percent as compared to bidirectional roads according to some literature [29], of which the mid-value of 38 percent is used. The street network service rate of pattern 4 then can be calculated as

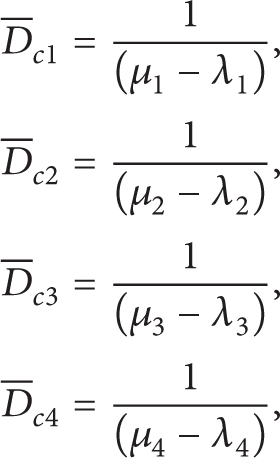
Equation (1) calculates the vehicle delay when passing through an intersection. Travel time between two adjacent intersections is also needed to be calculated as follows:

Here,
According to basic formulas in queuing theory and the equations deduced above, together with parameter values previously discussed, travel durations of each vehicle passing through the square blocks in a random direction in accordance with various patterns are

The formula shows clearly that time consumption is related to road land area ratio and arrival rate. Here, one can ascertain that time consumption decreases with the increasing of road land area ratio. However, if merely according to (5), the relationship between traffic arrival rate and time consumption still remains unclear.
3. Calculation and Discussion
3.1. Time Consumption Analysis with Changes of the Road Land Area Ratio
Based on the above analysis, μ1 = 19.5 veh/min, and

Time consumption curves with changes of road land area ratio.
Figure 2 shows that (1) as a whole, travel time decreases as the road land area ratio increases. (2) Pattern 3 has a greater time consumption and delay than pattern 4, even if they both have gridiron structures and the same density. The difference between the two patterns is whether the one-way system is applied or not. The efficiency of high-density street networks with one-way systems is shown to be considerably better. (3) When the pattern has the same road land area ratio but a lower traffic arrival rate (maybe less than approximately 29 veh/min), pattern 1 has the least time consumption and therefore shows its superiority, while the curve of pattern 4 is located between pattern 1 and pattern 2. pattern 1 saves about 16% of the time compared to that of pattern 4. When the arrival rate is slightly higher (more than 30 veh/min), patterns 1 and 4 have almost the same time consumption. If the arrival rate increases further and exceeds 34 veh/min, pattern 4 has an advantage over pattern 1 with an approximate 20% time saving, which means the former is a better network pattern and so should be selected.
3.2. Time Consumption Analysis with Changes of Arrival Rate
The most familiar road land area ratio is from 8 to 25%. Here, we chose 5.7 percent as an interval during the following computing process. Hence, Figures 3(a), 3(b), 3(c), and 3(d) correspond, respectively, to 8.0%, 13.7%, 19.3%, and 25.0%.

Time consumption curves with changes of arrival rate.
From the four sets of curves shown above, it can be concluded that when the arrival rate is less than 37 veh/min, time consumption in all four patterns also shows a slow increase in correlation with traffic volume. This, of course, is easily understood. Under any arrival rates of less than 29 veh/min, the value of time consumption in pattern 1 is always the most optimal, which is in keeping with the consequences analyzed in Section 3.1 if we look back to the discussion above.
If arrival rate is over 38 veh/min, curves in figures of the former three patterns will become volatile, which could also be found out through (1). When the arrival rate arrives at 39 veh/min, time consumption in patterns 1 and 2 peaks firstly. Meanwhile, time consumption in Pattern 3 is less than that inpatterns 1 and 2, but still much higher than that in pattern 4. If arrival rates continue to increase and exceed 40 veh/min, a worse condition will occur, making patterns 1 and 2 both inefficient, since the queuing length at intersections becomes so long that it is increasingly hard to disperse. Under the same conditions, pattern 3 is still valid although its time consumption soars up to almost 60 minutes. The threshold value of arrival rates which lead to pattern 3's inefficiency is higher (42 veh/min or so) than those of patterns 1 and 2 because the capacity discount of pattern 3 is the least of all according to capacity computing method.
In general, if arrival rates are over 38 veh/min, patterns 1 and 2 lose effectiveness at almost the same time, but pattern 3 is still functional. When the arrival rate gradually increases and becomes higher than 42 veh/min, pattern 3 fails too, whereas pattern 4 remains functional, showing that its adaptability and its time consumption remain the lowest of all. Pattern 4's efficiency range is longer than others. That means high-density one-way street network with gridiron structure will have a more stable performance when facing disadvantageous conditions. However, the curve in pattern 4 also contains some peaks and troughs. According to (1), until arrival rates arrive at approximately 59–60 veh/min, the curve reaches its peak and pattern 4 finally loses effectiveness at approximately 61 veh/min. Some values of time consumption are negative from Figure 3, which is disappointing but may be abandoned because (1) and (5) are no longer valid if μ i < λ i .
4. Conclusions
Which is more applicable and stable, the high-density or low-density grid street pattern? Which pattern will become the best choice for urban road systems? Is it necessary to consider traffic management and control modes in street network design? Urban planners and urban transportation planners have been beset with these problems for a long time [30–32]. Based on the widely applied queuing theory, this paper analyzes and discusses four types of grid street patterns. Finally, it draws the following important conclusions, which may provide vital references for urban transportation planning and design.
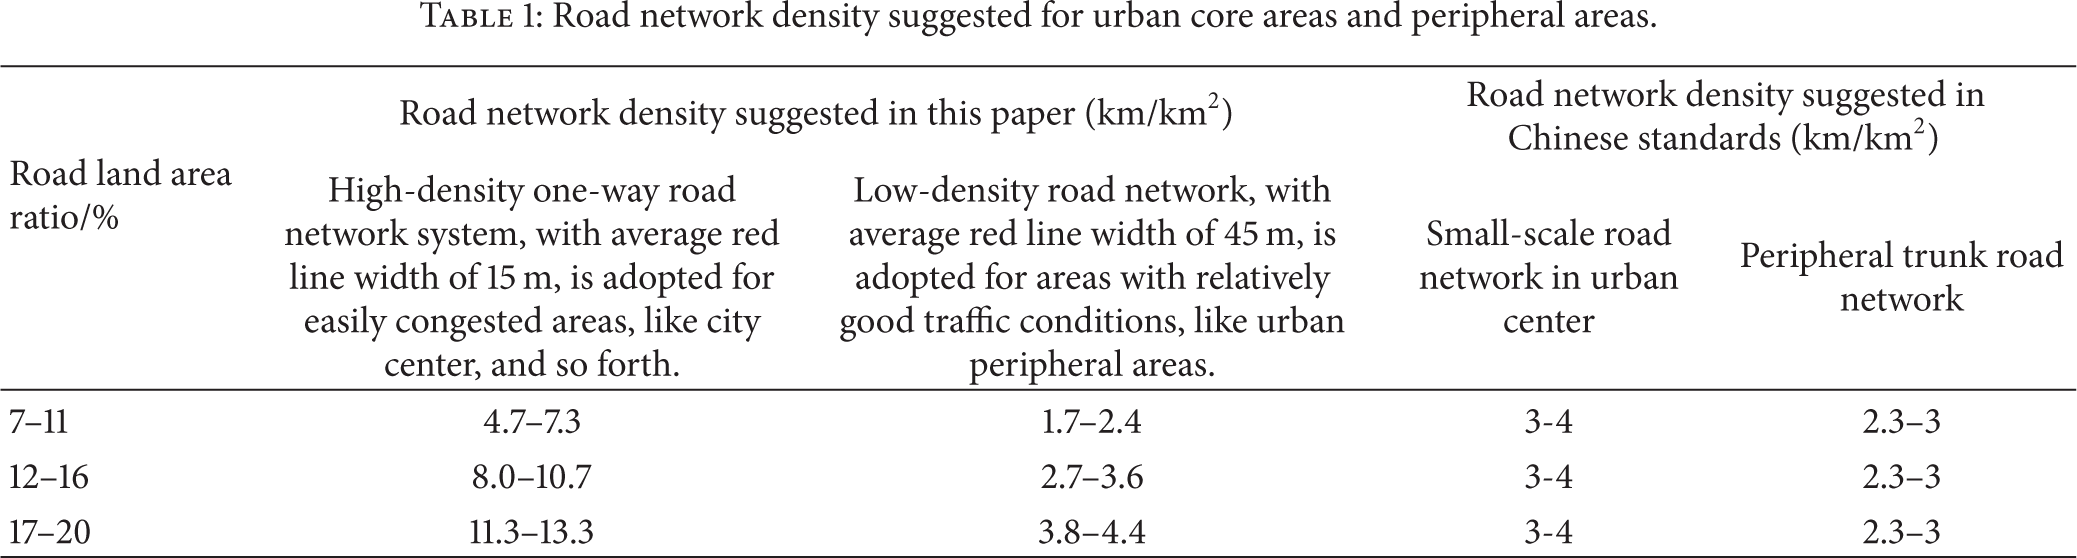
Along with the continuous growth of arrival rates and traffic volume, high-density street patterns have shown more obvious advantages. But it must be pointed out that high-density street patterns are not the best for all areas of a city. Besides arrival rate, traffic control patterns are another crucially important reference factor for selecting street patterns. If one-way systems are not considered in high-density street patterns, its operating state will be undoubtedly discounted greatly and even be the worst among the four patterns. On the contrary, once a one-way system is considered, the performance of a street network system will be greatly strengthened. Therefore, for the practice of urban transportation planning, high-density one-way street patterns should be applied to urban core areas and other easily congested areas. The road network density suggested for urban core areas is as shown in Table 1, and by comparing the value with corresponding value suggested in related standards of the Mainland China, we may discover that it is very difficult for the road network constructed according to standards to cope with the large traffic volume at peak hours.
Low-density street patterns should not be abandoned, especially in areas other than core areas. If only traffic operation efficiency is regarded, the better pattern in case of low traffic volume will not be pattern 4 but low-density and large-spacing street patterns. Therefore, for practice of urban traffic planning, in urban suburbs and other not easily congested areas, low-density and large-spacing street network patterns should be applied more. The road network density suggested for urban peripheral areas is as also shown in Table 1.
Generally speaking, street network patterns in cities are not simple and uniform but diversified and variable. The most reasonable street pattern will be applied to the most appropriate areas.
Road network density suggested for urban core areas and peripheral areas.
Footnotes
Acknowledgments
This research work was supported by National Natural Science Foundation of China (no. 51308281) and Jiangsu Provincial Natural Science Foundation of China (no. BK2012728).