
Abstract
Driver's propensity is a dynamic measurement of driver's characteristics, such as affection and preference. In the vehicle driver-assistance system, especially its collision warning subsystem, it is also an important parameter of computing driver's intention. The prediction of driver's propensity from relative static and macroscopic perspective is an essential precondition for further researching and extracting dynamic characteristics. Physiology and psychology tests are designed to measure driver's character and calculate physiological rhythm. Changing data of driver's psychology and emotion during driving are obtained by real vehicle test. Then driver's propensity values of different types are calculated by weighting method according to the contribution rate of standard features. Results show that this method is better than the traditional psychology test, and it provides a basis for further studying dynamic characteristics of driver's affection.
1. Foreword
With the rapid development of China's economy, the number of vehicles has grew rapidly, and the contradiction among people, vehicle, and environment is increasingly outstanding in road traffic system. Above 90% of traffic accidents are caused by persons and above 70% are caused by drivers. The reduction of traffic accidents at the largest degree not only needs to solve the problems of vehicle safety, road safety, and environment and climate impacts, but also to research the influence of driver on safe driving. Drivers' physiological and psychological characteristics are closely related to traffic safety; among them the psychology based on physiology is an important factor influencing driver's behavior [1]. The influence of drivers' physiological and psychological characteristics on traffic safety is represented mainly as driver's propensity [2], namely, driver's attitude toward traffic and driver's decision during driving or the preference of behavior values under the influence of all dynamic factors. Campagne et al. [3] studied the relationship of driver's age difference to traffic accidence numbers using EEG recorder, and the result showed that driver's vigilance would decrease and the number of operation mistakes would grow as the age increases. Brundell-Freij and Ericsson [4], Leng et al. [5], Pêcher [6], Di Stasi [7], Taubman-Ben-Ari [8], Cai and Lin [9], Parker et al. [10], Trick et al. [11], Lansdown [12], Daffy [13], Wang et al. [14–16], Weng and Meng [17], Verschuur and Hurts [18], Zhang et al. [19], Gosselin et al. [20], and Hu et al. [21], Danciu et al. [22] have studied driver behavior characteristics from different angles. However, in the field of vehicle active safety, there are few researches on driver's affective characteristics from microcosmic and dynamic perspective. The prerequisite for achieving the dynamic computing of driver's propensity is to extract the typical characteristics, therefore, the primary prediction value needs to be obtained in advance. Based on driver's physiological and psychological characteristics, physiology and psychology tests are designed to measure driver's character and calculate physiological rhythm. Changing data of driver's psychology and emotion during driving are obtained by real vehicle test. Then the driver's propensity values of different types are calculated by weighting method according to the contribution rate of standard features. Driver's propensity types can be classified by statistical characteristics. Results show that this method is better than the traditional psychology test, and it provides a basis for further studying dynamic characteristics of driver's affection.
2. The Analysis of Driver's Physiological and Psychological Factors
2.1. Physiological Rhythm
Physiological rhythm is a rhythmical and regular physiological circulation of human body. There are about one hundred circulations, such as breathing, blood pressure, and sleeping. The physical strength, emotion, and intelligence change, respectively, in 23-day cycle, in 28-day cycle, and in 33-day cycle. These three physiological circulations change on the same cycles from birth, then enter a peak period, soon afterwards turn into dismal period after passing through critical point, and finally turn into peak period. This is a complete circulation and it will cycle until life is over. Human's behavior will be in the best state during peak period. At this time, human will be full of energy and vigor, in high spirits and good mood, clear minded, and quick thinking, and have a good memory and the ability to solve complex problems with high efficiency. In contrast, human's behavior will be in bad state during dismal period. Physical strength failing, easy fatigue, lowspirits, depression, restlessness, spirit unconcentrated, low judgment, and inefficiency are associated with dismal period. During the critical point and critical period, physiology changes hugely and human will concentrate difficultly. Coordination capability will decrease and the person will have low adaptability and more errors. Figure 1 is the curve of physiological rhythm.

The curve of physiological rhythm.
2.1.1. Calculation Method of Physiological Rhythm
Basic Method. Physiological rhythm begins from birth. Firstly it will enter a peak period and then turn into a dismal period after passing through critical point. The physical strength, emotion, and intelligence change, respectively, in 23-day cycle, in 28-day cycle, and in 33-day cycle. In order to calculate the states of three physiological rhythms on a certain day, total days from birth to the day that needs to be calculated are figured out firstly, and then the remainder is gotten through dividing each cycle. The curve of physiological rhythm is checked according to the remainder. If there is remainder, then, it is on the critical point.
Calculation Steps. The method of calculating the total days is as follows.
Calculate the days of one full year of life: one full year of life × 365.
The extra days of leap year should be calculated as follows: one full year of life ÷ 4.
Then figure out the total days from the first birthday to the day which needs to be calculated.
The total days can be gotten through the three results above. Take a driver, for example, whose date of birth is May 20, 1962; calculate his physiological rhythm on January 1, 2012; and draw its curve.
Firstly, there are two methods to figure out the total days from the first birthday to the day which needs to be calculated. The first method is as follows: one full year of life is 50 years old from May 20 1962, to January 1, 2012; the total days of one full year of life: 50 × 365 = 18250 (day); the extra days of leap year: 50 ÷ 4 = 12.5; the result is rounded up to 12 (day); the total days from May 20 2012, to January 1 2012: 30 + 28 + 31 + 30 + 20 = 139 (day); The total days: 18250 + 12 – 139 = 18123 (day). The second method is as follows: one full year of life is 49 years old from May 20 1962 to 20 May 2012; the total days of one full year of life: 49 × 365 = 17885 (day); the extra days of leap year: 49 ÷ 4 = 12.25; the result is rounded up to 12 (day); The total days from May 20 2011, to January 1 2012: 11 + 30 + 31 + 31 + 30 + 31 + 30 + 31 + 1 = 226 (day); the total days: 17885 + 12 + 226 = 18123 (day).
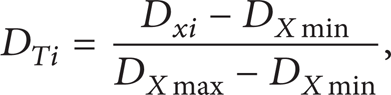
Secondly, the state value formula of physical strength, emotion, and intelligence is

Y i is, respectively, the state value of physical strength, emotion, and intelligence when i = 1,2, 3; A is cycle amplitude of physiological rhythm;t is the total days from birth to the day that needs to be calculated; T i is the cycle period of physical strength, emotion, and intelligence, respectively, when i = 1,2, 3.
2.2. Character Type
Psychologically, character which was called personality before is entirely different from personality. The true meaning of character that we talk about daily is actually the concept of personality, the integration of psychological characteristics and a steady structure. It influences the implicit and explicit psychological characteristics and behavior pattern in different times and places. It is an expression of behavior pattern and reflects in one's behavior.
Character is composed of many characteristics and its steady structure is performed in different times and places. Character structure is various, which leads to the character diversity among different people. Though some characters are the same in different people, the integration is different. Character supposes one's behavior and it is also an important aspect composing internal driving force. The driving force is not relevant to emotion and it is adaptive to life. The common methods of character test include Minnesota Multiphasic Personality Inventory (MMPI), Cattell sixteen personality factor questionnaire, MBTI character test, and DISC character test.
Cattell sixteen personality factor questionnaire (16PF) is adopted in this paper. R. B. Cattell is a professor at Illinois University and Institute for Personality and Ability Testing. After several years of observation and scientific experiment, he compiled the accurate test by using the statistical analysis method.
The test is very influential in the world and it has good validity and reliability. It is widely used in personality testing, talent selection, psychology counseling, and career counseling. It was introduced into China in 1979 and then professional institutions converted it into Chinese version. There are eight secondary factors in total and four secondary factors and adaptation and anxiety, introversion and extroversion, emotionalism and tough poise or alertness, coward and resolution, are tested combining with driving behavior.
2.3. Driving Psychology
Questionnaire of driving psychology is further modified by the questionnaire of document 3. After repeated screening, the questions can reflect driver's characteristics of physiology, psychology, and behavior. The questions and the choices are marked in descending order of numbers by referring to the classical psychological scale. The smaller the score is, the more likely the driver belongs to conservative type, and the results should take standard conversion.
Driving psychology includes two parts. The first part is the real vehicle test. The drivers are observed by special people based on the questionnaire, and driving behaviors are recorded through asking drivers simply without influencing driver's emotion and under the premise of driving normally. The second part is to replay the video. The record will be further perfected through drivers' memories. After the two parts are finished, driver's psychology in different environment is determined according to the grading standard.
2.4. Driving Emotion
Emotion is a comprehensive state of physiology and psychology including feeling, thinking, and behavior [23]. It is a reaction responding to external stimuli, such as happiness, anger, sadness, and joy or a personal subjective experience and feeling. It is an experience produced when natural and social needs can be satisfied or not and it is more situational and transient. Emotion is produced by psychological activities [24] including the experience of happiness, anger, sadness, and joy and the reaction of physiological changes. It influences human's understanding and behavior through emotion experience and reaction [25].
The existing methods of emotion test are static methods, but environment has a great effect on driver's emotion during driving. Simple test before real vehicle test can not characterize drive's emotion exactly. Considering the influence of emotion test on driving normally and in order to depict drive's emotion exactly during driving, the emotion test also includes two parts: one is observation and record during the real vehicle test, and the other one is experiment calibration after the real vehicle test through asking drivers while replaying the video.
There are three parts about emotion test: calm-excited, happy-angry, and relaxed-nervous. Testing value of each part is between 0 and 1. The more calm, happy, and relaxed the driver is, the lower the value is. In contrast, the more excited, angry, and nervous the driver is, the higher the value is.
3. The Prediction of Driver's Propensity
3.1. Experiment Scheme and Object
The experiment will be taken in shiny days and on dry pavement. Experiment time is from 8:00 am to 10:30 am at workdays. Traffic is heavy but does not meet the congestion.
The experiment objects are common drivers whose careers are teachers, staffs, workers, and freelancers of Zhangdian in Zibo. Sample capacity is 50; 82% of objects are male and 8% are female; corresponding numbers are 41 and 8. The age of them ranges from 27 to 58 years old. Average age is 34.6 years old. Driving years are 3–22 years. The average period of driving is 8.16 years. 92% of the objects had illegal driving behavior. The average is 5.12 and the frequency is 0.6 times/year. 44% of them had traffic accidents. Average accidents are 2.54 and the frequency is 0.31 times/year.
There are several points for attention in this experiment.
Drivers should practice in advance to be familiar with the performance of experiment vehicles.
The driver's experiment route is identical in order to guarantee the comparability between different drivers, and the route is shown in Figure 2.
Drivers should cope with the traffic flow status normally and not be affected by other persons.

Experiment route.
3.2. The Prediction Method of Driver's Propensity
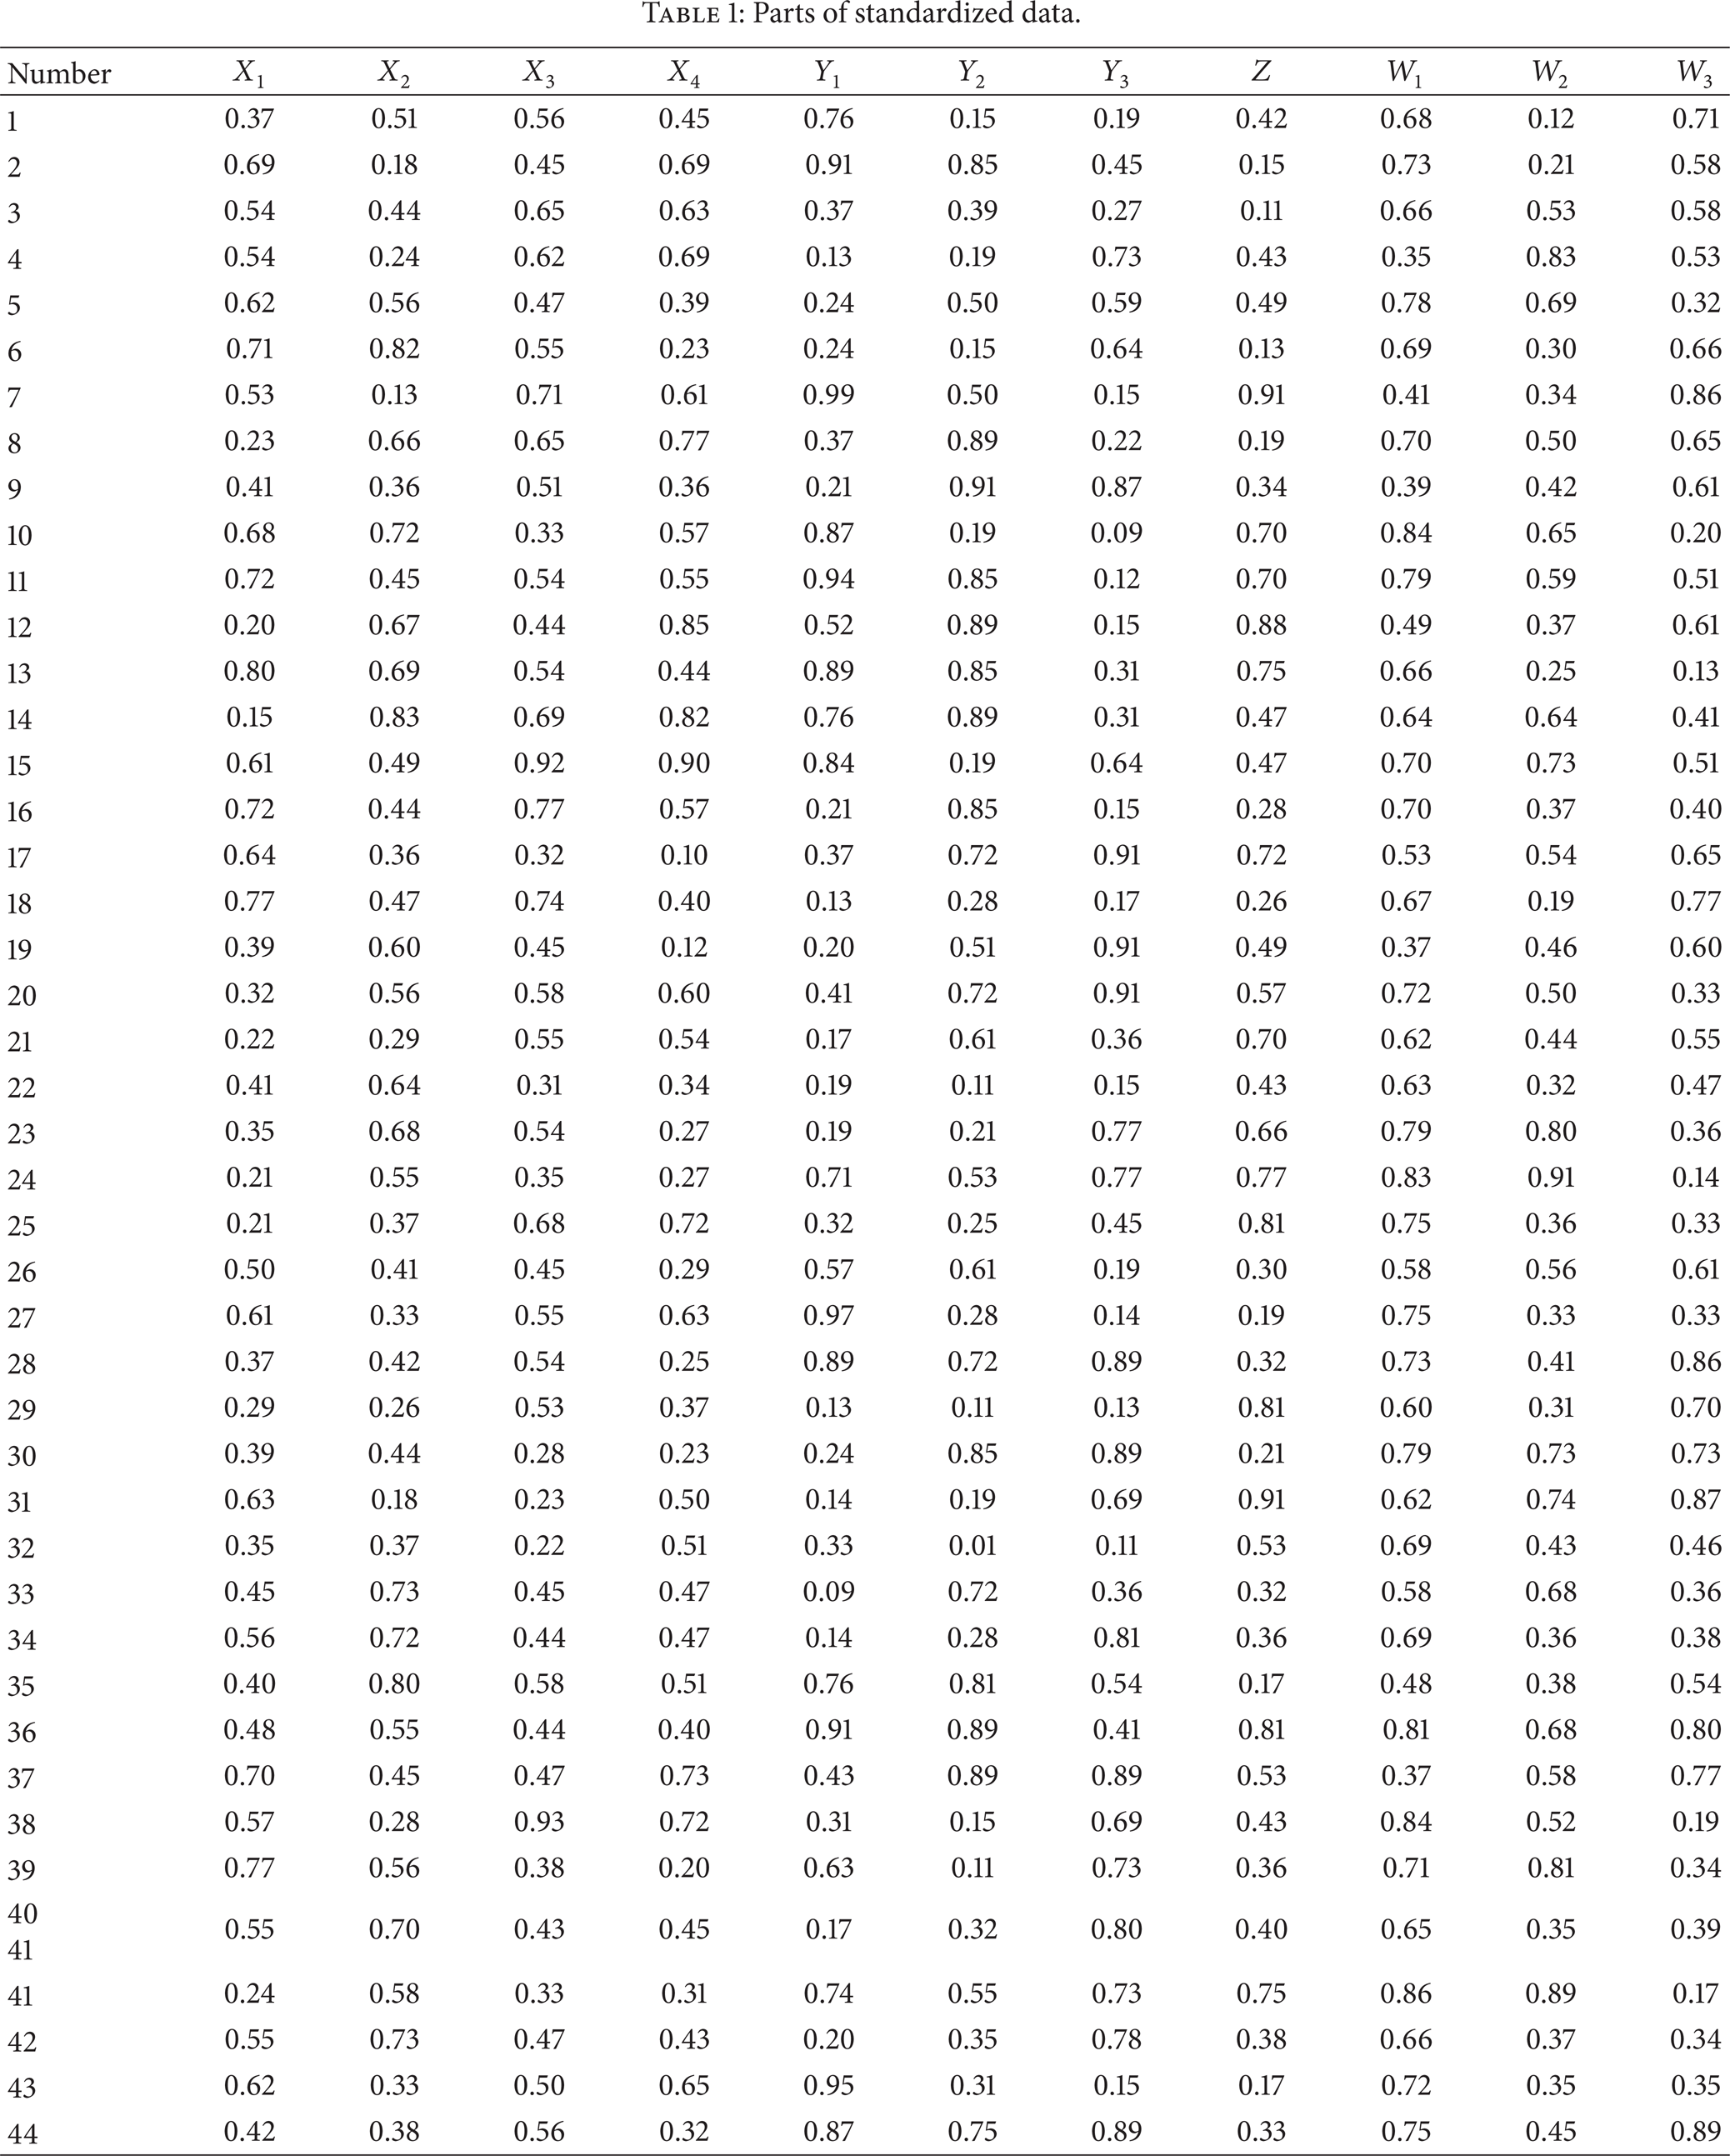
Driver's propensity includes the tests of personality (character), driving psychology, driving emotion, and the calculation of physiological rhythm state. Based on driver's observation values in different tests and the relative difference between drivers, data is standardized by the following formula:
where D Ti is the data after standardization, D Xi is original data, and D Xmin and D Xmax are the minimum and maximum values of original data.
Parts of standardized data are shown in Table 1 and the prediction model of driver's propensity is shown in Figure 3. X1, X2, and X3 are, respectively, the standard test value of adaptation and anxiety, introversion and extroversion, emotionalism and alertness, and coward and resolution; Y1, Y2, and Y3 are, respectively, the standard test value of physical strength, emotion state, and intelligence state. λ1, λ2, and λ3 are, respectively, weights of Y1, Y2, and Y3; Z is the standard value of driving psychology test results; W1, W2, and W3 are respectively the standard test value of calm-excited, happy-angry, and relaxed-nervous.
Parts of standardized data.


The prediction model of driver's propensity.
The prediction formula of driver's propensity is

where dt is the prediction value of driver's propensity, Z is the standard value of driving psychology test results, α is weight of driving psychology, and β is weight of character; X1, X2, and X3 are, respectively, the standard test value of adaptation and anxiety, introversion and extroversion, emotionalism and alertness, and coward and resolution; β1, β2, β3, and β4 are the weight of X1, X2, X3, and X4; λ is the weight of physiological rhythm; Y1, Y2, and Y3 are, respectively, the standard test value of physical strength, emotion state, and intelligence state; λ1, λ2, and λ3 are, respectively, the weight of Y1, Y2, and Y3;η is the weight of emotion state; W1, W2, and W3 are, respectively, the standard test value of calm-excited, happy-angry, and relaxed-nervous; η1, η2, and η3 are, respectively, the weight of W1, W2, and W3.
dt is a decimal between 0 and 1. Combining with the statistical law, dt is divided into five intervals. And the types of driver's propensity can be determined according to the intervals of dt. The results of dt intervals divided and the corresponding driver's propensity are shown in Table 2.
Type division of driver's propensity.

3.3. Model Validation
The prediction method is validated by using the model of feature extraction and recognition. Results are shown in Figure 4. Recognition accuracy A is the prediction value of driver's propensity which is obtained by the simple psychology test and the result of further dynamic recognition. Recognition accuracy B is the result of recognition.

Validation result.
Simulation and validation result is shown in Figure 5. The value 1 is the validation situation of cognitive results applied to simulation in real time. The cognitive results are based on the prediction value of driver's propensity obtained by simple psychology test. The value 2 is the simulation and validation result using the method in this paper.

Simulation and validation results of speed, headway and acceleration.
Results show that the prediction method of driver's propensity is better than the simple psychology test.
4. Conclusions
The initial measurement of driver's propensity directly influences the dynamic feature extraction and recognition. Only considering that driver's propensity is closely related to driving environment, the initial evaluation model can be relatively accurate. Data are obtained through character test and dynamic tests of driving psychology and emotion. Physiological rhythm is calculated by the theory of affective computation. The standard information of driver's physiology and psychology is obtained in real vehicle test. Driver's propensity is predicted by the information and driver's propensity types are divided through weight calculation. Results show that the method in this paper has significant meaning in further dynamic feature extraction of driver's affection.
Conflict of Interests
The authors declare that there is no conflict of interests regarding the publication of this paper.
Footnotes
Acknowledgments
This project is supported by the National Natural Science Foundation of China (61074140), the Natural Science Foundation of Shandong Province (ZR2010FM007 and ZR2011EEM034), and the Young Teacher Development Support Project of Shandong University of Technology.