
Abstract
Based on the decomposition of the evolution processes of the urban expressway capacity after traffic accidents and the influence factors analysis, an approach for estimating the capacity has been proposed. Firstly, the approach introduces the Decision Tree ID algorithm, solves the accident delay time of different accident types by the Information Gain Value, and determines congestion dissipation time by the Traffic Flow Wave Theory. Secondly, taking the accident delay time as the observation cycle, the maximum number of the vehicles through the accident road per unit time was considered as its capacity. Finally, the attenuation simulation of the capacity for different accident types was calculated by the VISSIM software. The simulation results suggest that capacity attenuation of vehicle anchor is minimal and the rate is 30.074%; the next is vehicles fire, rear-end, and roll-over, and the rate is 38.389%, 40.204%, and 43.130%, respectively; the capacity attenuation of vehicle collision is the largest, and the rate is 50.037%. Moreover, the further research shows that the accident delay time is proportional to congestion dissipation time, time difference, and the ratio between them, but it is an inverse relationship with the residual capacity of urban expressway.
1. Introduction
With the acceleration of the urbanization process in China and the rapid growth of the motor vehicle ownership, the supply pressure of existing road network is increasing, and frequent traffic congestion of the local area and traffic safety issues also have become increasingly prominent. As an important part of the urban road infrastructure, the formation of the urban expressway, which meets city internal short-distance and external long-distance traffic demand, will strongly support and promote the reasonable adjustment of urban spatial structures and enhance urban transport accessibility features, fast function, and connectivity features on the whole. Moreover, its transport efficiency not only plays an important promoting role in improving the city's economic development, but also becomes an important measure to alleviate urban traffic congestion. However, sudden traffic accidents on the expressway system will seriously affect the normal operation of urban traffic. The road capacity dropped significantly and the traffic flow was disordered after the occurrence of sudden traffic accident. The sudden traffic accident may also cause traffic congestion of upstream road easily, even cause a number of casualties and property losses, and increase traffic delays and travel time. It will have a great impact on the regional road network. Therefore, the capacity researches of the urban expressway after traffic accident have important significance for providing decision support of timely response to the accident.
In recent years, there have been numerous efforts from the domestic and foreign research institutions and scholars in the field of the urban expressway capacity from different angles. Abroad, the Highway Capacity Manual (2000) which is written by the U.S. Transportation Research Board (TRB) described the urban expressway capacity under normal conditions in detail. After careful modification and improvement for it, TRB published the Highway Capacity Manual (The 2010 version) in 2010. Swedish Capacity Manual published in 1977 also analyzed and studied the urban expressway capacity. In addition to this, abroad scholars researches for the capacity of the urban expressway mainly focused on the influences of the urban expressway capacity [1], weaving, merge capacity and their simulation [2–5], traffic flow characteristics and models [6–8], level of service [9, 10], basic link capacity under bottleneck state [11, 12], travel time prediction model of urban expressway and its feasibility under bottleneck state [13, 14], and traffic control strategies which included on-ramp control [15, 16]. Domestically, the researches on road capacity started late. However, based on foreign advanced theory and the practical situation of the country's roads, domestic scholars and experts carried out a detailed, extensive, and in-depth research for the urban expressway capacity, and had achieved obvious results. For instance, Chai et al. [17] put forward the bus stop capacity calculation method of the urban expressway under the condition of road congestion based on the influence factors of the bus stop capacity. Du et al. [18], Ming-yuan [19], Hai-jun et al. [20] simulated and analyzed the urban expressway capacity and traffic state. Du and Jian [21] estimated highway effective capacity after an unexpected traffic accident. Hong-ping et al. [22] and Yang et al. [23] analyzed influence factors of the urban expressway capacity from the free-flow speed and the number of lanes, respectively. Long et al. [24], Long and Xiao-Guang [25], Ma et al. [26] analyzed and studied the urban expressway off-ramp and on-ramp capacity. Li et al. [27] studied the capacity of the urban expressway shunt, merge area. Zhong et al. [28, 29] and Chen et al. [30] give the recommended values of the ideal capacity, and simulate the capacity of the urban expressway weaving area. Zhang and Yong-Feng [31] improved a better traffic flow model on the basis of the analysis of traffic flow characteristics on the expressway weaving area.
In summary, most work focused on the research of the urban expressway capacity under normal conditions. These researches promote the development of the urban expressway capacity and provide a theoretical reference for urban expressway planning, design, and service level analysis. But due to accident statistic difficulties and other reasons which cause research depth of the urban expressway capacity lowly after traffic accidents, the efficiency of traffic accident rescue and emergency response measures will be directly affected. In view of this, the paper disassembles the evolution processes of the urban expressway capacity after traffic accidents and analyzes influence factors at first. Then, it introduces the Decision Tree ID algorithm and the Traffic Flow Wave Theory and takes the accident delay time as the observation cycle. Finally, it simulates the capacity by the VISSIM simulation software, which quantitatively describes the attenuation characteristics of the urban expressway capacity after traffic accidents. That will provide new ideas for traffic control measures, travel information service, traffic organization, and emergency rescue, which effectively protect safe, effective, and orderly operation of urban roads.
2. The Evolution Processes of the Urban Expressway Capacity after Traffic Accidents
After the occurrence of the accident, the road capacity of the accident point will reduce. When the capacity is less than the upstream traffic low, the upstream vehicles will line up in the event point and continue to extend to the upstream, even extending to the upstream intersection. When the accident is cleared, the road capacity gradually restored and congested traffic flow began to dissipate. Continued congestion time is composed of the accident delay time and congestion dissipation time, as shown in Figure 1. A represents the start of the accident state; B represents the confirmation of the accident state; C represents the arrival of the police; D represents the end of the accident state; E represents the end of the crowded state.

Continued congestion time. Notes: t MC —the accident monitoring and confirmation time; t R —the accident response time; t P —on-site processing time; t S —therecovery time; t A —the accident delay time; t A + t S —continued congestion time.
The evolution processes of the urban expressway capacity after an unexpected traffic accident are divided into three stages that are corresponding to continued congestion time, as shown in Figure 2. C0 represents link capacity (veh/h) of the urban expressway before the accident or after traffic recovery; C1 represents link capacity (veh/h) of the urban expressway before the police arrives; C2 representslink capacity (veh/h) of the urban expresswayunder the condition of accident processing; C3 represents link capacity (veh/h) of the urban expressway under the conditions of traffic recovery.

The evolution processes of the urban expressway capacity after traffic accident. Notes: t1—accident starts, t2—the duration of the accident, t3—accident ends, and t4—congestion ends.
Step I. When an unexpected traffic accident causes the temporary closure of the local lanes, the accident lane capacity plunged to zero, but it will recover until traffic accident is cleared. Meanwhile, the vehicles on the accident lane change original lane to the adjacent lane, and the traffic flow in a certain range is in a turbulent state. The interaction of the vehicles is relatively large, and passable lane capacity is smaller than its normal capacity.
Step II. After the arrival of the police, when the space occupied by rescue vehicles, traffic signs, and other facilities is larger than that of the accident, the capacity is smaller than that before the arrival of the police; that is C2 is slightly less than C1; on the contrary, the capacity is larger than that before the arrival of the police, that C2 is slightly larger than C1. In order to simplify the capacity analysis of Step I and Step II and solve the urban expressway capacity after traffic accidents, C2 is equivalent to C1 here.
Step III. After the end of the accident, because crowded traffic flow caused by traffic accident is not completely dissipated, the urban expressway capacity, which is influenced by traffic composition, speed, and front spacing of crowded traffic flow, is smaller than its normal capacity; that is, C3 is slightly less than C0.
3. The Analysis of the Urban Expressway Capacity after Traffic Accidents
3.1. Influence Factors Analysis
According to the evolution processes of the urban expressway capacity after traffic accidents, analyze and study the evolution factors (what are the factors leading to the evolution of this capacity?). Different from the urban roads under normal circumstances (taking into account influencing factors of the capacity under normal conditions), the influencing factors of the urban expressway capacity after traffic accident have its particularity. In general, it is related to the inherent attributes of traffic accident, road space resource attributes of the accident point, traffic management measures of the accident point, and the accident delay time.
3.1.1. The Inherent Attributes of Traffic Accident
(I) The Accident Types and the Severities. Common accident types in urban road are vehicle anchor, roll-over, fire, rear-end and collision, and so forth. The accident severities include whether there are the casualties, road infrastructures of the accident point are damaged or not, the number and types of involved vehicles, and so forth. The accident delay time and traffic recovery time will vary with different accident types and the severities, and further influence action time of the urban expressway capacity reduction.
(II) The Time and Location of the Accident. The time and location of the accident have a great influence on the urban expressway capacity. If the time is in the peak period, the traffic demand is big, and the mutual interference degree of the vehicles at the accident point will be great, which will further reduce the urban expressway capacity. If the spatial location of the accident is in the intersection, the space of straight vehicles and the vehicles transfer into expressway is very limited. Moreover, the driving directions of each import lane at the intersection are more and traffic flow interweaves with each other, which will also reduce the urban expressway capacity. Other situations can be analyzed through the actual situation.
3.1.2. Road Space Resource Attributes of the Accident Point
(I) The Number of Closed Lanes Near the Accident Point. After the accident, for security requirements and required space of on-site processing, sometimes it is necessary to close one or more lanes, which will greatly reduce the capacity of urban road and lead to traffic congestion and obstruction.
(II) The Length and Width of the Carriageway. The longer the length of the closed lane, the lower travel speed in the lane and lane changing, and that also reduces the capacity of the accident sections. The narrower the width of the carriageway, the smaller the space and travel speed through the accident point, which will also have a certain impact on the capacity of the accident road.
3.1.3. Traffic Management Measures of the Accident Point
(I) The Speed Limitation of the Accident Road. The speed is limited in the unclosed lane. Limited speed can improve its safety and balance traffic low speed and reduce secondary accidents, but its capacity will be reduced.
(II) The Flow Limitation of the Accident Road. After the accident, in order to timely evacuate upstream vehicles and reduce delays, the vehicles of the corresponding import lane at the intersection near the accident point should be prohibited to transfer into the expressway. That can control traffic demand of the accident point and ease traffic pressure, which will increase the urban expressway capacity in a certain extent.
3.1.4. The Accident Delay Time
The accident delay time is related to operating strength, accident types, severities, traffic conditions, and other factors. The stronger the operating strength, the shorter the accident delay time, and its capacity recoveries sooner.
For influencing factors of the capacity of special accident roads, for example, tunnels and bridges, in addition to the above factors, there are other special influencing factors. The capacity of tunnels is related to lighting intensity, traffic signs of the tunnel entrance, and other factors; however, the bridge is related to slope and linear.
3.2. The Calculation of the Accident Delay Time and Congestion Dissipation Time
Taking into account influence factors of the urban expressway capacity after different accident types, the accident delay time will vary. Use the Information Gain Values based on ID algorithm of the Decision Tree to estimate the accident delay time of different accident types on the urban expressway, the formulas are as follows:
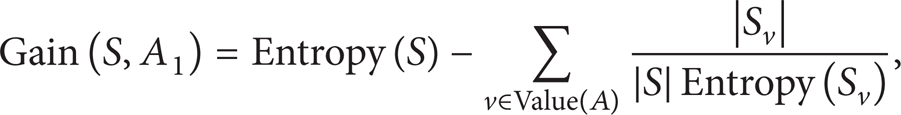
where

S = sample collection; Entropy (S) = information entropy; p(u i ) = probability of Category i; A = property; Value (A) = the collection of the value of the property A; v = a value of the property A; S v = sample collection that the value of the property A is v; |S v | = S v contains sample number.
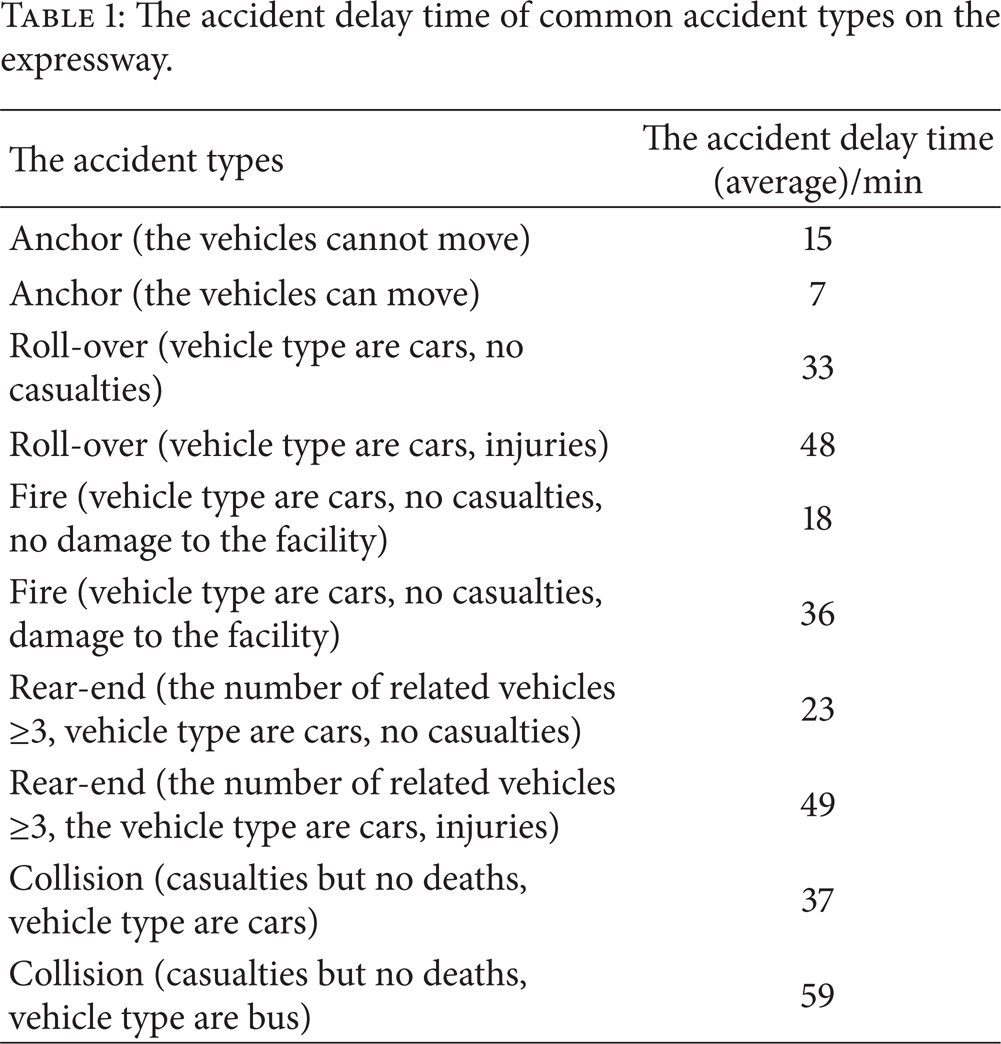
Selecting an urban expressway accident as samples [32], according to above formulas, the accident delay time of common accident types on the expressway is calculated. The results are shown in Table 1.
The accident delay time of common accident types on the expressway.
The dissipation time can be obtained from the Flow Wave Theory. The calculation formulas are as follows:
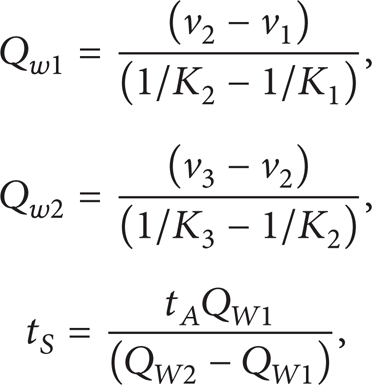
where QW1 = the wave flow of Build-wave; QW2 = the wave flow of evanescent wave; v3, v2, v1 = the speeds of the three kinds of traffic states; K3, K2, K1 = the density of the three kinds of traffic states.
3.3. Theory Analysis of the Capacity
The entire process of the urban expressway from traffic congestion to the dissipation is analyzed through the evolution processes of the urban expressway capacity after traffic accidents, as shown in Figure 3.

The forming process of traffic congestion.
Figure 3 shows that the reciprocal of the ratio (slope) between the accident delay time and cumulative number of vehicles in the time period is the capacity of the accident road. The reciprocal of the ratio (slope) between congestion dissipation time and cumulative number of vehicles in the time period is the recovery capacity (it is slightly less than the actual capacity of the road). This paper discusses the former and assumes that traffic accidents take place on urban expressway sections.
4. The Simulation Model of the Urban Expressway Capacity after Traffic Accidents
According to the theoretical analysis of the urban expressway capacity after traffic accidents, use Vissim simulation software to simulate and estimate the capacity. We obtain corresponding 20 groups output through the 20 groups simulations. Then, use the average value to analyze the results in order to reduce the error. The simulation analysis of the capacity is shown in Figure 4.

The flow chart of simulation analysis of the urban expressway capacity after traffic accidents.
4.1. Road Conditions and Accident Types Settings
The road conditions are divided into road grade, travel direction, whether there is a separation zone, numbers of two-way lanes, lane width, and so forth. The accident types are divided into vehicle anchor, roll-over, fire, rear-end and collision. This paper takes the expressway of Xi'an city as the simulation background. The lane width is set as 3.750 m; unidirectional number of lanes is 3; simulation road length is 720.275 m. This paper takes a closer-left lane as an example to study.
4.2. Traffic Volume Conditions and Driving Behavior Parameters Settings
Traffic volume conditions include traffic composition, the proportion, traffic volume, speed, and so forth. Expectation speed curve of the road under the different road levels is set in accordance with the “urban road design specifications.” But after the accident, the speed will be less than the expectation speed. The distribution function of the car maximum acceleration and expectation speed distribution of the car after traffic accident are shown in Figures 5 and 6.

The distribution function of the car maximum acceleration.

Expectation speed distribution of the car.
On driving behavior parameters settings, forward-looking minimum distance is 0.00 m, and the maximum distance is 250.00 m; back-sight minimum distance is 0.00 m, and the maximum distance is 150.00 m; last time of temporarily distracted is 0.00 seconds, continuous probability is 0.00%; the car following model uses the Wiedemann 74 model; car stop spacing is 2.00 m on average; the additional part of the safe distance is 2.00 m, and multiples part of the safe distance is 3.00 m.
4.3. The Simulation Parameters Settings
The related parameter settings are shown in Tables 2 and 3.
The vehicle classification and conversion coefficient.

Note: the data come from traffic volume investigation and statistics of the Xi'an city expressway; passenger cars (including small trucks), bus (including medium-sized passenger), truck (including big bus, medium-sized trucks and large trucks).
Signal control parameter settings under different accident types.

Because there are no simulation modules of traffic accident in Vissim simulation software, this paper sets up red light on the accident lane to simulate traffic accidents. The signal begins to turn red when the accidents happened, and will turn green until the end of the accident. For the data in Table 3, for example, of the first line data, 2400 s is a signal cycle (green end time) and 1080 s = 180 s + 900 s is red end time. 900 s (15 min) is the accident delay time of the anchor (the vehicles cannot move); 180 s is the buffer time (that is time before the accident occurred), which can reduce the influence of the required time (simulation influence time) from vehicle appearance to the accident point for the simulation results at the beginning of the simulation. It should be larger than the simulation influence time but less than the accident delay time of corresponding accident types. Other situations are similar to this.
In this paper, the output parameter is mainly the number of vehicles.
4.4. The Analysis of the Simulation Results
According to the accident delay time and the Flow Wave Theory (the free flow speed is 80 km/h, and blocking density is 106 vehicle/km), through above parameter settings to change the signal control parameters of traffic simulation, simulate the capacity of vehicle anchor, roll-over, fire, rear-end, and collision. The simulation data results are as shown in Table 4.
The simulation data results.
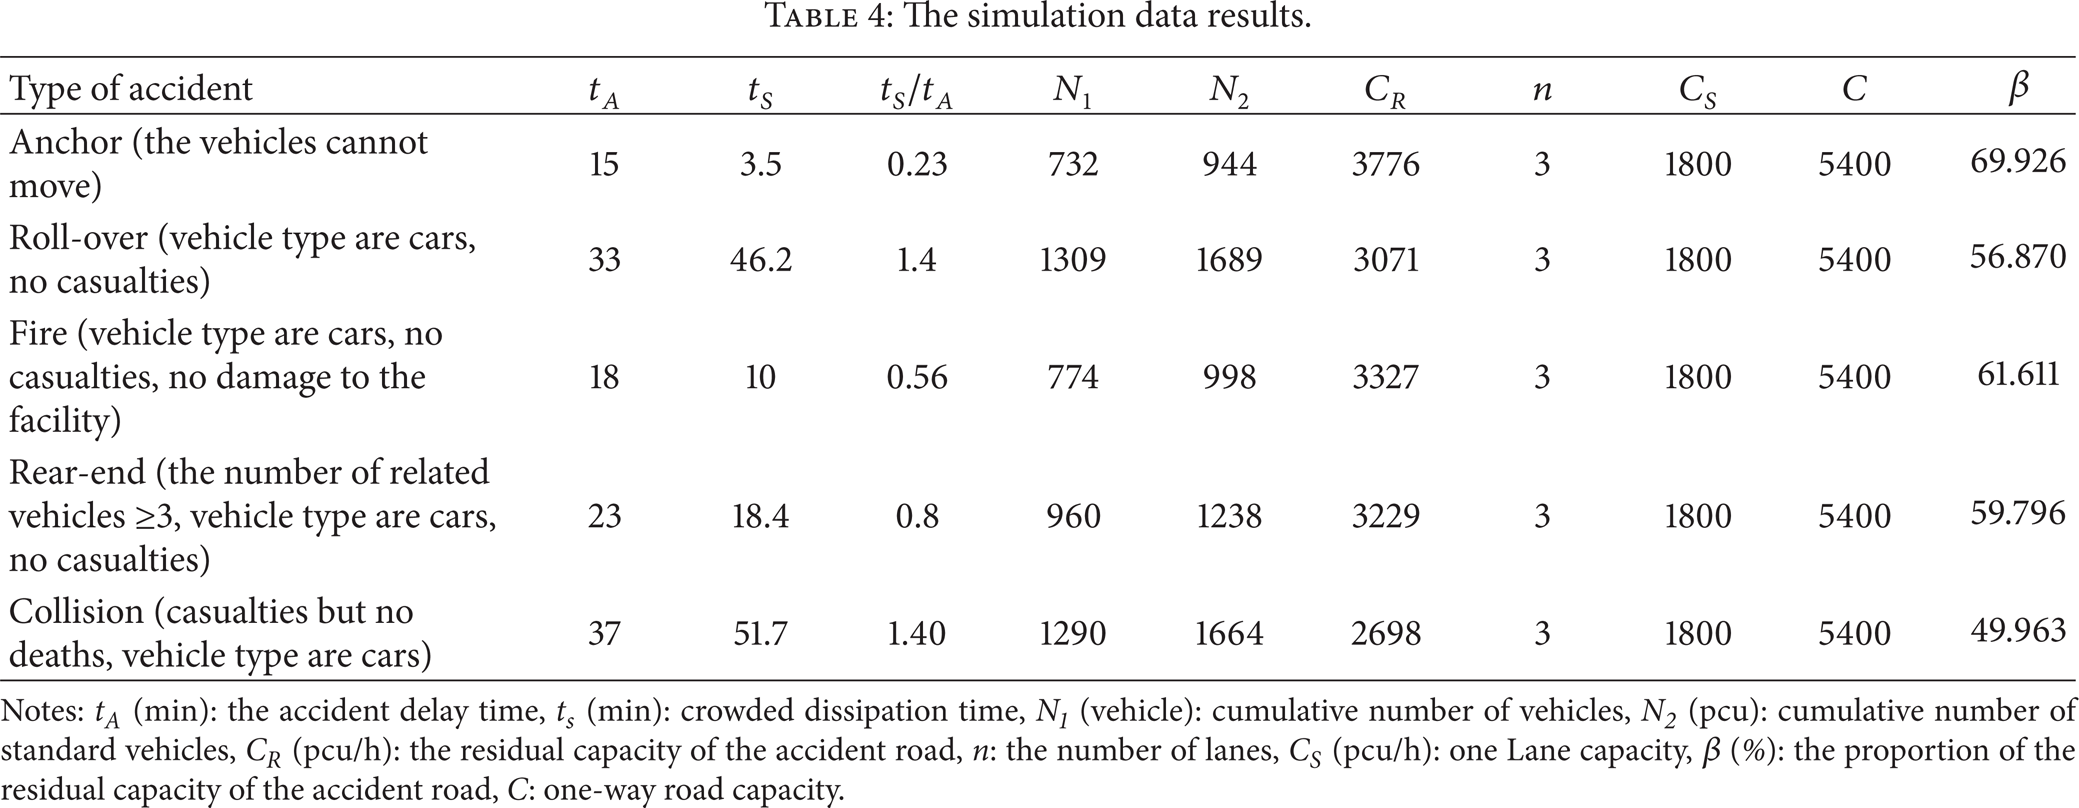
Notes: tA (min): the accident delay time, ts (min): crowded dissipation time, N1 (vehicle): cumulative number of vehicles, N2 (pcu): cumulative number of standard vehicles, CR (pcu/h): the residual capacity of the accident road, n: the number of lanes, CS (pcu/h): one Lane capacity, β (%): the proportion of the residual capacity of the accident road, C: one-way road capacity.
Table 4 shows that the accident delay time and congestion dissipation time of vehicle anchor are the minimum, but the residual capacity of the accident road is the maximum, and the proportion is 69.926%; the accident delay time and congestion dissipation time of vehicle collision are the maximum, but the residual capacity of the accident road is the minimum, and the proportion is 49.963%; the proportion of the vehicle roll-over, fire, and rear-end is 56.87%, 61.611%, 59.796% respectively.
According to the data of the simulation results, we further analyze and research the relationship between the accident delay time, congestion dissipation time, and the residual capacity of the urban expressway comprehensively, as shown in Figure 7.

Congestion dissipation time and the proportion of the residual capacity vary with the accident delay time.
Note. The left axes in Figure 7 are the main axes (min), which represents congestion dissipation time, time difference of congestion dissipation time and the accident delay time; the right axes in Figure 7 are the secondary axes (%), which represents the ratio between congestion dissipation time and the accident delay time, the proportion of the residual capacity on the urban expressway. Abscissa represents the accident delay time (min).
Figure 7 shows that the accident delay time is proportional to congestion dissipation time, time difference of congestion dissipation time, and accident delay time and their ratio, but it is an inverse relationship with the proportion of the residual capacity. With the increasing of the accident delay time, time difference of congestion dissipation time and the accident delay time is negative firstly and decrease constantly, it is positive and increase constantly later. When the accident delay time increased from 15 minutes to 37 minutes, the proportion of the residual capacity dropped by about 20%, but congestion dissipation time increased 48 minutes.
5. Conclusions
The researches of the urban expressway capacity after traffic accident have a very important role in immediate emergency and rescue measures were taken by urban traffic management departments, and the efficiency of emergency rescue reflects the level of city management and emergency response in a certain extent. So, its researches have important significance. Through the attenuation simulation of the urban expressway capacity after traffic accidents, the following conclusions can be drawn.
At first, this paper analyzes the evolution processes of the urban expressway capacity after traffic accidents. Then, it describes the influence factors of the capacity and calculates the accident delay time and congestion dissipation time on the basis of this. According to the forming process of traffic congestion, elaborates theoretical analysis and research of the capacity. Finally, it puts forward the calculation method of the capacity. The calculation method takes the Information Gain Value of the Decision Tree ID algorithm and the Traffic Flow Wave Theory as a theoretical basis, and simulates and studies the capacity by using VISSIM simulation software. The simulation results are almost consistent with the actual situation. It is shown that this method has a certain theoretical significance and practical value, and it can provide decision support for urban traffic management departments to take appropriate response measures.
Through the attenuation simulation of the urban expressway capacity after traffic accidents, the research results suggest that capacity attenuation of vehicle anchor is minimal, and the rate of attenuation is 30.074%; the next is vehicles fire, rear-end, and rollover, the rate of attenuation is 38.389%, 40.204%, and 43.130%, respectively; the capacity attenuation of vehicle collision is the largest, and the rate of attenuation is 50.037%. Through further analysis and research of the relationship between the accident delay time, congestion dissipation time, and the residual capacity of urban expressway, the results are shown in Figure 7, and the curve of congestion dissipation time, time difference of congestion dissipation time and the accident delay time and their ratio have the feature of slow change firstly, the mutation later, the gentle finally.
The accident delay time and the residual capacity of the urban expressway will be very different for different accident types. The ratio between congestion dissipation time and the accident delay time will be affected by the residual capacity: the bigger the residual capacity, the smaller the ratio conversely, the greater. But its quantitative analysis still needs to be studied further. Moreover, different locations and time of traffic accidents have a great influence on the urban expressway capacity, which still needs further research.
Footnotes
Acknowledgments
The authors acknowledge that this paper has been supported by the National Natural Science Foundation of China (Grant no. 51208051) and the Fundamental Research Funds for the Central Universities (CHD2011ZD014).