
Abstract
Experiments are performed in a dense-phase pneumatic conveying system of pulverized coal, and electrostatic signals and coal particle distribution images over cross-section of the pipeline at superficial gas velocities of 5.7 m/s, 6.9 m/s, and 8.1 m/s are obtained through use of electrostatic sensor arrays (ESA) and electrical capacitance tomography (ECT), respectively. In combination with ECT imaging results, the output signals of the ESA are analyzed by FFT and approximate entropy method. Results show that characteristic of particles motion and its change with increasing superficial gas velocity are different in the dense and dilute phase region of the pipe. With increasing the superficial gas velocity, the peak frequency of the electrostatic signal increases linearly in dense-phase region, while that in dilute phase region is nonlinear, implying that the increase of the axial particles velocity is the main dynamic change, while in dilute phase regions, the particles velocity fluctuation in the radial direction cannot be ignored. The ApEn value of the electrostatic signal in dense phase region is larger than that in dilute phase region. When the ApEn value difference of the electrostatic signals is smaller, the pulverized coal particles are better suspended.
1. Introduction
Dense-phase pneumatic conveying system of powder is widely applied in the chemical and industrial processes such as the pulverized coal transport of entrained flow gasifiers in chemical plants and the coal powder injection systems of blast furnaces in steel plants. However, due to the unsteady and complex nonlinear nature of the dense-phase gas-solid two-phase flow in the pneumatic transport pipelines, it is desirable to investigate the particle flow behavior for the optimized design and operation of these dense-phase pneumatic conveying systems. For the investigation into the dense-phase gas-solid flow, on the one hand, the mathematical modeling and numerical simulations for the gas-solid flow are used to predict the particle behavior [1–4]. However, no great progresses in the modeling were made to date because of the randomness and complexity of the dense-phase gas-solid flow. On the other hand the experimental time series such as the pressure, particle concentration, and acoustic emission were obtained from the gas-solid flow system, and nonlinear processing methods including the entropy, Lyapunov exponent, and correlation dimension are employed to extract the instantaneous dynamic behavior of particles [5–8]. Approximate entropy (ApEn) methodas a quantifying method for the randomness inherent in the time series, has been widely used for flow pattern identification in fluidized bed, gas-liquid two-phase flow complexity measure analysis, and fault detection in industrial process [9–11].
When particles are pneumatically transported in the conveying pipelines, charges are generated on the particles due to particles-particles and particles-wall collisions and friction [12, 13]. Based on particle charging, electrostatic technique has been widely applied to particle parameters measurement such as particle velocity and particle size due to its advantages of low cost, simple structure, and being a noncontact, highly sensitive, and robust sensor [14–16]. Recently, the ring-shaped electrostatic sensor has been used to measure particle average velocity and characterize the nonlinear behavior of the particle movement in the dense-phase pneumatic transport system [7, 17]. However, it has the limitations of characterizing the local particles velocity and local motion characteristics of the gas-solid two-phase flow. This is because the output signal of the ring-shaped sensor is the superposition of the charges induced by all the charged particles in the sensing zone of the sensor [18]. In fact, an inhomogeneous particle velocity distribution and the asymmetric structure of gas-solid flow usually exist over the cross-section of the pipe. Therefore it is necessary to measure local particle velocity and motion characteristics for characterizing particle flow characteristics in a gas-solid system. Electrostatic sensor array (ESA), as an improved ring-shaped electrostatic sensor, was proposed to measure gas-solid flow because each electrode of the ESA has its localized sensitive zone [19]. In a sense, by arranging the electrodes in the axial and circumferential directions of the conveying pipeline, the output signals of those electrodes reflect local particle flow behavior of gas-solid flow in time and space. Electrical capacitance tomography (ECT) technology is capable of visualizing the spatial distribution of solid particle and determining solid concentration over the cross-section of a pipe. Up to date, ECT has been used for the visualization and characterization of particle flow [20]. Therefore, multisensor integrations including electrostatic sensor array and electrical capacitance tomography (ECT) system would be more useful for comprehensively understanding the particles behavior of gas-solid two-phase flow system.
The objective of this paper is to investigate the flow characteristics of dense-phase pneumatic conveying system of pulverized coal through electrostatic sensor arrays in conjunction with ECT. The sensitivity distribution characteristics of the electrostatic sensor arrays are firstly analyzed using finite element method and experimentally verified by the full pipe particle flow and quarter particle flow in a gravity-fed flow rig. On a dense-phase pneumatic conveying system of pulverized coal, electrostatic signals and coal particle distribution over cross-section of the pipeline in three experimental cases are then obtained, respectively, by electrostatic sensor arrays and ECT system. FFT and approximate entropy methods combined with ECT images are applied to reveale the relationship between the particle characteristics and the frequency spectrums and approximate entropy of the output signals of electrostatic sensor arrays.
2. Electrostatic Sensor Arrays
A schematic of the electrostatic sensor arrays is shown in Figure 1. It mainly consists of eight arc-shaped electrodes evenly distributed along the circumference of the pipe, two grounded guard ring electrodes, one grounded metal screening to resist electromagnetic interference, and one dielectric pipe to isolate the electrode. Mathematic model of the ESA has been introduced in the literature [19]. Due to the complex 3D electrostatic field distribution of ESA, it is difficult to derive an analytical solution to its mathematical model. The recent availability of various electromagnetic field calculation software packages in conjunction with fast computing equipment has made it possible to calculate the electrostatic field. In the work presented in this paper, Ansoft (Maxwell 3D Field Simulator) is utilized to calculate the induced charge on the electrodes of the ESA.

Schematic diagram of the 8 electrode electrostatic sensor arrays.
Five typical flow streamlines denoted by a, b, c, d, and e in Figure 2 are selected to represent the axial sensitivity distribution of the ESA. The flow streamlines are uniformly located on the dielectric pipe's diameter passing through the center point of the electrodes 1 and 5. In the numerical simulations and experiments, the inner radius of the dielectric pipeline is 10 mm, and thus the spacing between the five streamlines equals 2 mm. The EAS model consists of eight electrodes with the length of 10 mm and width of 6 mm. When a unit point charge moves in a streamline, eight independent induced charge values on the eight electrodes of the ESA can be obtained simultaneously by calculating electrostatic field, and each electrode has its own sensing zone. But the eight electrodes have the same sensing field distribution because of the axial symmetric distribution of the ESA. Therefore if the sensitivity distribution of one electrode is calculated, those of the other electrodes of the ESA can be obtained by rotation.

Typical flow streamlines in the ESA with 8-electrodes.
Figure 3 shows the variation of the sensitivity with the axial coordinate z for different streamlines. Figure 4 shows the sensitivity distribution of the electrode 1 at the central cross-section (z = 0). From Figure 3 and Figure 4, it can be seen that the sensitivity of each electrode is three-dimensional and is inhomogeneous over the cross-section and along the axial direction of the pipe. The electrode has higher sensitivity at z = 0, and the sensitivity decreases with increasing |z| in the same streamlines. The rapid change in the sensitivity occurs when the unity point charge moves along the streamlines (d, e) close to the electrode. However the streamlines a, b, and c contribute much less to the induced charge on the electrode. As shown in Figure 4, the sensitivity in the red area near the electrode 1 is larger and decreases with the increasing distance from the electrode. The sensitivity in the blue area is only a tenth of that in the red area. This implies that the charged particles nearby the electrode make the most significant contributions to its output, and thus the sensing field is quite localized around the electrode. The local sensitivity distribution indicates that the ESA can give some information on gas-solid flow distribution.

Variation of the sensitivity with the axial coordinate in different streamlines.

Sensitivity distribution over the central cross-section of ESA.
3. Approximate Entropy Method
Pincus proposed the approximate entropy (ApEn) methodfor the analysis of random time series [21]. Now it has been widely used to quantify the randomness inherent in time series. The computation process of ApEn for a time series {x(i)} with the length of N is as follows.
Step 1. Embedding vector X(i) is created, and it contains m consecutive values of x

where m is the embedding dimension.
Step 2. The distance d[X(i), X(j)] between two vectors X(i) and X(j) is defined as

Step 3. For eachi, 1 ≤ i ≤ N – m + 1,

where r is the tolerance deviation. C i m (r) denotes the probability that the distance d[X(i), X(j)] between two vectors X(i) and X(j) is less than rwhen X(i) is taken as the center. The average of C m (r) is then defined by
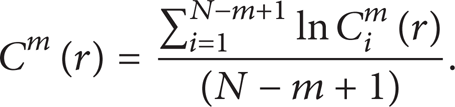
Step 4. Increase the embedding dimension m to m + 1, and repeat Step 1 to Step 3. We have

Step 5. C m (r) and Cm + 1(r) denote the probabilities of the template matching for mand m + 1 points, respectively. Therefore ApEn is defined by

In practice, N is a finite scalar, and so the ApEn can be approximated as

From (7), it can be seen that the ApEn value varies with the embedding dimension m and similar tolerance r. The larger ApEn value indicates that the time series is more complex and irregular.
4. Experimental Setup
A schematic diagram of the dense-phase pneumatic conveying system of pulverized coal at high pressure is shown in Figure 5. High-pressure gas supplied from the buffer tank is divided into the pressurizing gas, the fluidizing gas, and the supplement gas. The feeding hopper adopts the bottom-fluidization and top-discharge arrangements. Pulverized coal in the feeding hopper is fluidized by the fluidizing gas and enters the conveying pipeline through an accelerating segment located in the hopper. Finally the coal particle flow reaches the receiving hopper. The rate of each gas is measured by a metal tube variable-area flow meter, and the fluctuation of solid mass flow rate is monitored by the load cells. Both the feeding hopper and the receiving hopper have a capacity of 0.648 m3. The transport pipeline section consists of 45 m of Φ10 mm bore stainless steel pipeline. The gas pressure in the buffer tank is kept at 4 Mpa. The transported material is pulverized lignite coal. The coal properties are summarized in Table 1. The transportation gas is CO2.
Properties of lignite coal particles.


Schematic of a dense-phase pneumatic conveying system of pulverized coal at high pressure.
Figure 6 shows a photograph of the integrated sensor including ESA and ECT. The integrated sensor head and electrodes arrangement of the ECT and the ESA is shown in Figure 7. The electrodes were tightly mounted on a quartz glass tube with length of 200 mm and diameter of 10 mm. The ECT consists of eight electrodes with the length of 100 mm and width of 6 mm, a multichannel signal conditioning, data acquisition circuit, and image reconstruction program. The ESA has the same size parameters as those in Section 2. The output signals of the conditioning circuit of the ESA were sampled by a PCI9112 acquisition card and then stored in a computer. Sampling frequency is 1000 Hz.

Integrated sensors including ESA and ECT.

Integrated sensor head.
5. Results and Discussions
5.1. Gravity-Fed Particle Flow Experiments
Figure 8 shows a photograph of a gravity-fed flow rig. Particles from the hopper first enter the pipeline and then pass the head of the integrated sensor by gravity. During experiments, the quarter flow and full pipe flow were achieved through vertical pipe and inclining pipe at an angle of 45°. Particles used in the experiments were glass beads with the diameter of 1 mm.

Gravity-fed flow rig.
The energies of the eight electrostatic output signals of the ESA for quarter flow and full pipe flow were calculated, and the ECT images were acquired in three consecutive seconds. Figure 9 shows the signal energy of the quarter flow on the eight electrodes and the ECT reconstruction images. It can be seen from Figure 9 (a) that the grey value of the area close to the electrodes 3 and 4 is larger, implying that the particle concentration in the area is higher. The corresponding signal energy of the electrodes 3 and 4 is larger than that from the other six electrodes (in Figure 9 (b)). This verifies that the sensing zone of the electrode of the ESA is localized, and the electrode has higher sensitivity close to it. Figure 10 shows the signal energy of full pipe flow on the eight electrodes of the ESA and the reconstruction images of the ECT. Compared with Figure 9, the energy distributions from eight electrodes for the full pipe flow fluctuate around a mean value of 2.2, although the signal energy of the electrode 8 is smaller than that of the other seven electrodes for the reason that the particle concentration near the electrode 8 is low during experiments. Therefore it can be concluded that the output signals of the ESA effectively reflect the particle distribution over the cross-section of the pipe.

ECT images and electrostatic signal energy distribution for quarter flow (the electrode positions of the ESA are shown in Figure 2).

ECT images and electrostatic signal energy distribution for full pipe flow.
5.2. Pneumatic Conveying Experiments of Pulverized Coal
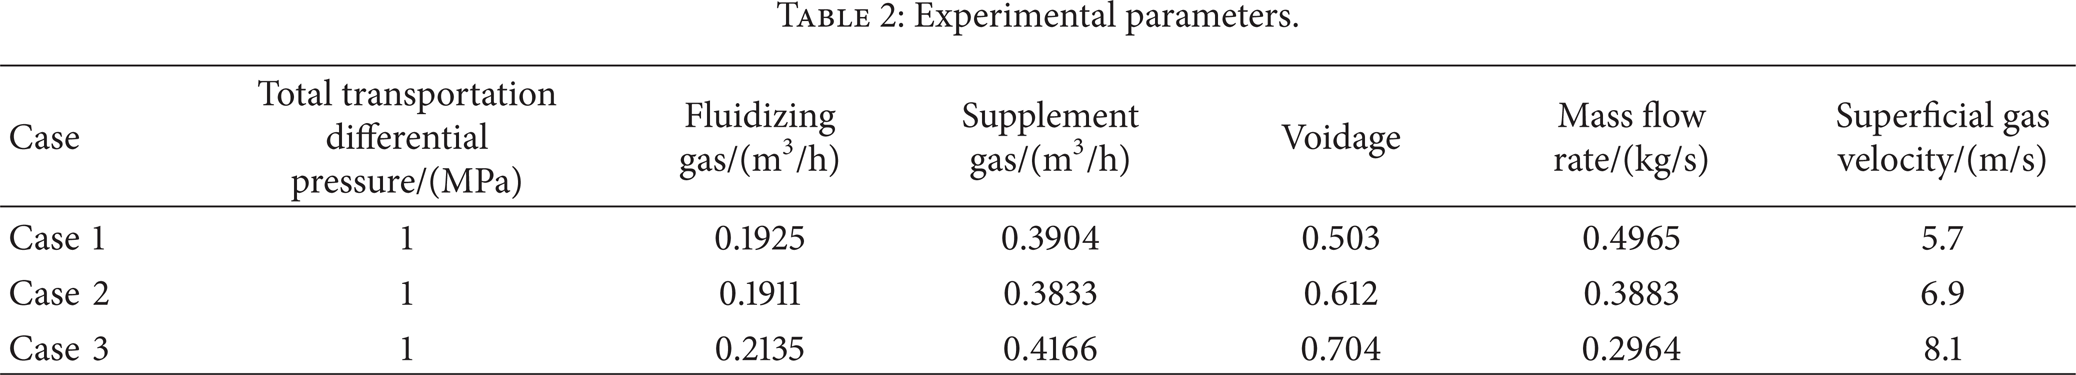
Experiments on the dense-phase pneumatic conveying system of pulverized coal are performed. Experimental parameters are listed in Table 2. Raw differential pressure signals and mass signals in three cases are shown in Figure 11. It can be seen from Figure 11 that in three cases the coal mass in the receiving hopper has a good linear decrease, and its correlation coefficient is more than 0.9. The differential pressure fluctuations are smooth over a period of stable transport time (50 s–250 s).
Experimental parameters.

Variation of differential pressure fluctuations and coal mass with time in three cases.
In a horizontal pneumatic conveying pipeline, the pulverized coal is dense in the bottom and dilute in the top of the pipe due to gravity. Figure 12 shows the particle distribution images over the cross-section of the pipe in the three cases. It can be seen that coal particle concentration decreases, and particle distribution becomes homogeneous with increasing superficial gas velocity. From the ECT images and the average coal concentration over the cross-section of the pipeline (in Figure 13), the pulverized coal distribution and average coal concentration vary slightly with time, and thus particles conveying continuity are all in good conditions in the three cases. Especially in the case 3 with the larger superficial gas velocity, coal particles are totally suspended and homogeneous. Therefore ECT technique can distinguish particle distribution over the cross-section of the pipe, which mainly reflects the characteristics of macroscale particles distribution. However, ECT is not suitable forcharacterizing particles motion in micro scale.

ECT images in the three cases.

Average coal concentration over the cross-section of the pipeline in the three cases.
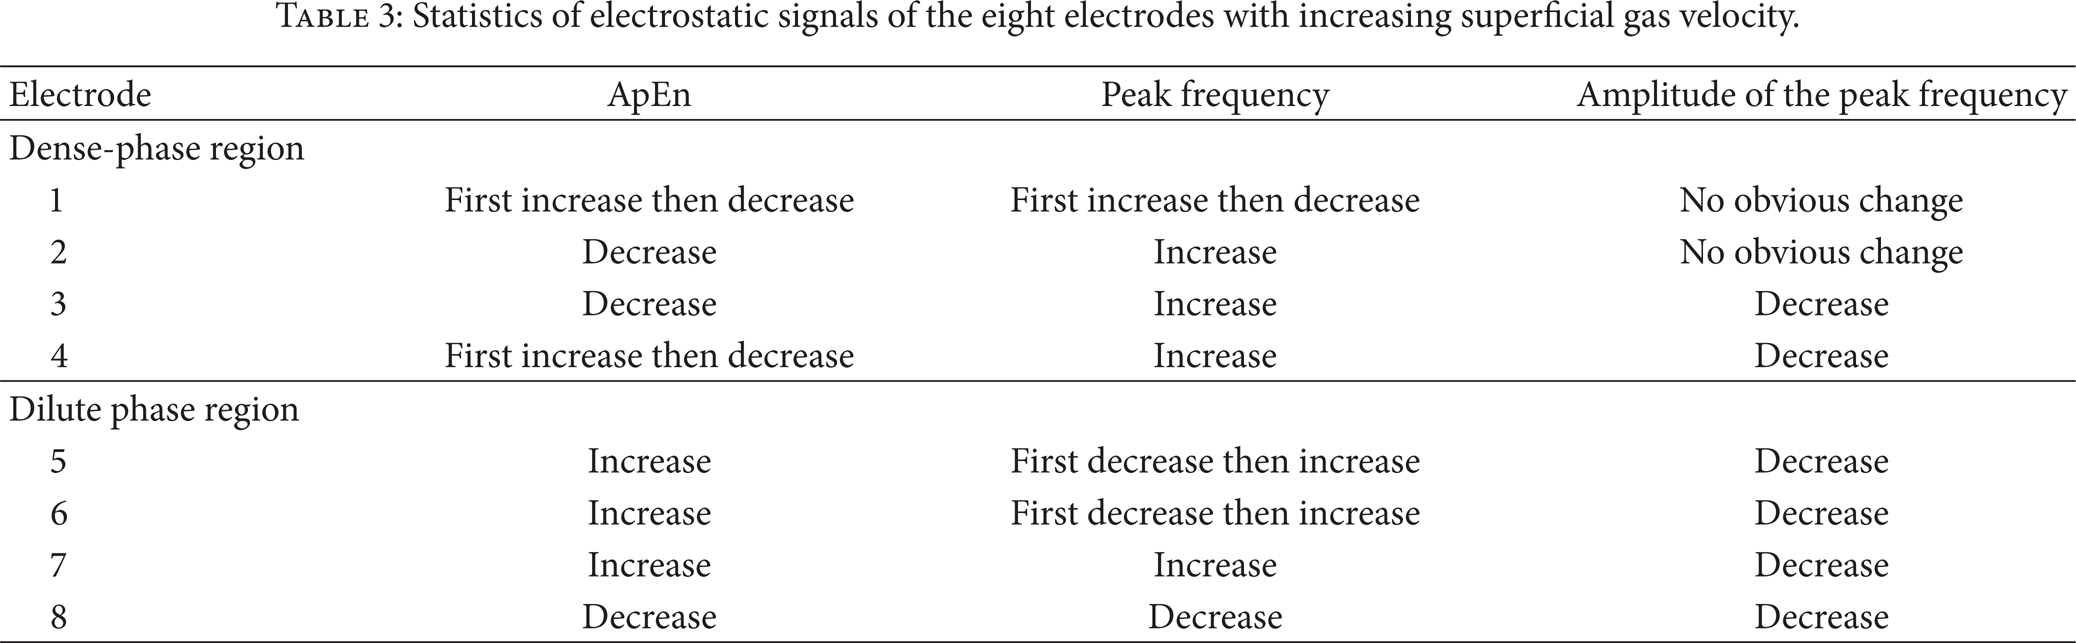
Figures 14 and 15 show the peak frequencies and ApEn value of the eight electrode output signals of the ESA in three cases with different superficial gas velocities, respectively. The variations of ApEn value, peak frequency, and peak amplitude of the electrostatic signals with increasing superficial gas velocity are summarized in Table 3. It can be seen from Table 3 that the peak amplitudes generally decrease with increasing superficial gas velocity. The larger charge quantity contributes to the bigger amplitude of the output signal in frequency domain [16]. Collision number increase in a certain degree will lead to the increase of the particles charge quantity. As the superficial gas velocity is increased, the particles concentration decreases, and the particle-particle collision number decreases. So the particle charge decreases. However, ApEn value and peak frequency have nonlinear relations with superficial velocity. Compared with the particle distribution images shown in Figure 12, the electrodes 2 and 3 are in dense-phase region, the electrodes 6 and 7 are in dilute phase region, and the electrodes 1, 4, 5, and 8 are in the border region. From Table 3, it can be seen that the ApEn values and peak frequencies on the electrodes 1, 4, 5, and 8 are poorly comparable. This is because the particle flow varies randomly between dense-phase and dilute phase in the border region. Therefore the features in the frequency domain and ApEn values of the output signals on the electrodes 2 and 3 and the electrodes 6 and 7 are used to analyze and describe the particle motion characteristics in dense-phase region and dilute phase region.
Statistics of electrostatic signals of the eight electrodes with increasing superficial gas velocity.

Peak frequencies of eight-electrode electrostatic output signals of the ESA.

ApEn of eight electrode-electrostatic output signals.
Figures 16 and 17, respectively, show the frequency spectrum of the output signals on the electrodes 2, 3, 6, and 7 in three cases. The peak frequencies are shown in Figure 18. It can be seen that the peak frequencies on the electrodes 2 and 3 increase with the increase of superficial gas velocity. Previous study has proven that the frequency characteristics of the electrostatic sensor output signal are closely related to the charge carried by the particles, the velocity, and distribution of charged particles in its sensing zone [19]. The particles velocity increases with increasing the superficial velocity, and consequently the peak frequency increases [16]. However, the peak frequencies on the electrodes 6 and 7 do not keep increasing, shown in Figure 18. The reason is that the particle distribution and velocity fluctuation in radial direction also exert nonlinear influence on frequency characteristics of electrostatic sensor output signals [16]. In the turbulent flow, particles concentration is inversely proportional to turbulent kinetic energy of particles [22]. When the superficial gas velocity is 5.7 m/s, it is turbulent flow with the Reynolds (Re) number more than 2 × 10⁵. The bigger turbulent kinetic energy of particles means the particle velocity fluctuation in radial direction is stronger. So in dilute phase region, the particle velocity fluctuation in radial direction is more turbulent. Though the particle velocity increase is the main variation with increasing the superficial gas velocity in dilute phase region, the particle velocity fluctuation in radial direction is big enough that it causes an important nonlinear influence on the change of its output signal peak frequency. Therefore, as the superficial gas velocity increases, the increase of the particles velocity is the main dynamic change, while in dilute phase region the particles velocity fluctuation in the radial direction cannot be ignored.

FFT spectrum of the electrostatic signals of the electrodes 2 and 3 for three superficial gas velocities.

FFT spectrum of the electrostatic signals of the electrodes 6 and 7 for three superficial gas velocities.

Peak frequencies of electrostatic signals of the electrodes 2, 3, 6, and 7 for three superficial gas velocities.
The randomness and complexity of particles motion in the dense-phase conveying pipeline could be quantified by the ApEn value. Figure 19 shows the ApEn value of the output signals on the electrodes 2, 3, 6, and 7 in three cases. It can be seen that the ApEn values on the electrodes 2 and 3 are bigger than those on electrodes 6 and 7. As superficial gas velocity increases, the ApEn values on the electrodes 2 and 3 decrease while those on the electrodes 6 and 7 increase. The particle-particle collision frequency in dense-phase region is higher than that in dilute phase region. In fact, the ApEn value of the output signals of the ESA indicates the complexity of the electrostatic signal itself but does not completely refer to the randomness of the particles motion, because the electrostatic signal is influenced by other factors such as the radial and axial gradients of the particles charges and the variation of the particles charge with time. Obviously, particles charge gradient and variation are more random in the dense-phase region. So, in the dilute phase regions the randomness of the electrostatic signals is weaker than that in the dense-phase region, though the particle velocity fluctuation in radial direction makes particles motion complex. While the superficial gas velocity increases, particle concentration in the dense-phase decreases. As a result, the difference of particle movement complexity in dense-phase and dilute phase region is reduced. In addition, compared with ECT images, it is found that when the difference between the ApEn values on the electrodes 2 and 3 and those on the electrodes 6 and 7 are smaller, the suspension property of coal particles is better.

ApEn of electrostatic signals of electrodes 2, 3, 6, and 7 for three superficial gas velocities.
6. Conclusions
The sensitivity of electrostatic sensor arrays (ESA) was investigated and analyzed through use of a finite element analysis software Ansoft Maxwell 3D. Experiments have been performed in a dense-phase pneumatic conveying system of pulverized coal, and electrostatic signals and coal particle distribution images over cross-section of the pipeline at superficial gas velocities of 5.7 m/s, 6.9 m/s, and 8.1 m/s were obtained through use of the ESA and ECT. The FEM modeling results indicated that the sensitivity distribution of the electrostatic sensor array is quite localized around each electrode and thus is mainly sensitive to the particles nearby it. This was also verified by the signals energy distribution of the ESA with eight electrodes under full pipe flow and quarter flow conditions in a gravity-fed flow rig. Experimental results in the dense-phase pneumatic conveying system of pulverized coal illustrated that the frequency domain features and ApEn value of the ESA output signals are useful for distinguishing the particle motion behavior in dense-phase and dilute phase regions of the conveying pipe. As the superficial gas velocity increases, the peak frequency value of the electrostatic signal increases linearly in dense-phase region, while that in dilute phase region is nonlinear. Therefore the increase of the axial particles velocity is the main dynamic change, while in dilute phase region the particles velocity fluctuation in the radial direction cannot be ignored. The ApEn value of the electrostatic signal in dense-phase region is larger than that in dilute phase region. When the ApEn value difference is smaller, the pulverized coal particles are better suspended. Therefore, the frequency domain features and ApEn value of the ESA output signals embody the difference in the characteristics of particles motion and its change rule with increasing the superficial gas velocity in dense-phase and dilute phase regions.
Footnotes
Acknowledgments
The authors wish to express their gratitude to the Special Funds for the National Natural Science Foundation of China (no. 50906012), New Century Excellent Talents at Chinese Universities (NCET-12-0116), and the Major State Basic Research Projects of China (no. 2010CB227002).