
Abstract
Driver sleepiness is a hazard state, which can easily lead to traffic accidents. To detect driver sleepiness in real time, a novel driver sleepiness detection system using support vector machine (SVM) based on eye movements is proposed. Eye movements data are collected using SmartEye system in a driving simulator experiment. Characteristic parameters, which include blinking frequency, gaze direction, fixation time, and PERCLOS, are extracted based on the data using a statistical method. 13 sleepiness detection models including 12 specific models and 1 general model are developed based on SVM. Experimental results demonstrate that eye movements can be used to detect driver sleepiness in real time. The detecting accuracy of the specific models significantly exceeds the general model (P < 0.001), suggesting that individual differences are an important consideration when building detection algorithms for different drivers.
1. Introduction
According to the report of the American National Highway Traffic Safety Administration (NHTSA) [1], the most influential factor in the occurrence of fatal single-vehicle run-off-road crashes is the driver performance-related factor: falling asleep, followed by alcohol use and vehicle speed [2]. In fact, it was found that approximately 20% of all fatal road accidents involved driver sleepiness, varying from 5% to 25% by different countries [3]. Therefore, it is necessary to develop a system which could monitor the physical and mental state of the driver. It should alert at the critical moment when the driver is getting sleepy to prevent accidents.
In the past few years, many researchers have been working on driver sleepiness detection using different techniques. Eye movements variables are the most common measures and have a high success rate [4, 5]. Bergasa et al. combine six parameters, which are calculated percent eye closure (PERCLOS), eye closure duration, blink frequency, nodding frequency, face position, and fixed gaze, using a fuzzy classifier to infer the sleepiness level of the driver [4]. Friedrichs and Yang explored 18 features of eye movements for sleepiness detection. The sequential floating forward selection (SFFS) algorithm was chosen to select the most promising features and results showed that the detection accuracy could reach 82.5% [6].
At present, most research works focus on collecting eye movements data using machine vision. After capturing the video, some techniques, including Hough Transform [7], Landmark Model Matching [8], Haar Algorithm [9], Adaboost [10], Gabor Filter [11, 12], and disparity map [13], are applied to detect the face, eye, or mouth. After localizing the specific region of interest within the image, features such as PERCLOS [4], head angle [14], yawning frequency [15], and blink frequency [16] are extracted using an efficient feature extraction technique, such as Discrete Wavelet Transform [10], Gabor Wavelets [17], Wavelet Decomposition [18], and Kalman Filtering [19]. However, there is less attention on the selection and optimization of characteristic parameters and detection models. A few commercial products, for example, FaceLAB and SmartEye providing camera-based nonintrusive tools for measuring driver physical signals such as gaze, head pose, and mouth activity, are available in the market. In this paper, the location and segmentation of eye were not discussed and the eye movements data were collected by a SmartEye system.
Individual differences have been found in many areas. Wang et al. proposed a self-learning algorithm for driver characteristics based on the recursive least-square method with a forgetting factor adapt to individual characteristics [20]. We developed 13 detection models, which include 1 general model and 12 specific models, to detect driver sleepiness and analyze the effects of individual differences.
2. Experiments
2.1. Participants
A total of 12 participants (4 women and 8 men) aged 23–32 years old (mean = 27.1, std = 2.846), who are most likely to experience sleepiness at the wheel and be involved in sleepy driving crashes [21], took part in this study. All participants were experienced drivers with valid licenses and 3–12 years driving experience (mean = 6.7, std = 2.7101), who drove at least 8,000 km annually. They were free of any sleep disorder and on no medication and recruited via an advertisement in school website.
2.2. Driving Simulator
This experiment was carried out on a high-fidelity driving simulator, as shown in Figure 1, in the Intelligent Vehicle Research Center (IVRC) of Transportation College of Jilin University. This fixed-based driving simulator consisted of a full-size BESTURN B50 vehicle cabin, which is produced by FAW Car Co., Ltd, an image system, a control system, and a sound system. The forward screen was in the front of 3.5 m from the vehicle cabin. The main functions were executed by the previous hardware, controlled by a software system developed by IVRC.

Driving simulator.
2.3. Driving Scenario
A highway scenario was chosen as the driving scenario in this study. The highway scenario is a 133 km long highway of a sampled actual Changping highway located between Changchun and Siping city, with two 3.75-meter-wide lanes in one direction, a 0.5-meter-wide hard shoulder, and a 3-meter-wide isolation belt. Based on the highway design, the posted speed limit was 80–120 km/h. The traffic situation selected in this experiment was only sparse oncoming traffic and no traffic driving in the same direction to induce drivers' boredom and sleepiness.
2.4. SmartEye System
The SmartEye system is a head and gaze tracking system well suited for the demanding environment of a vehicle cabin and flexible to cope with most research projects [22], which was used in this study to collect eye movements data. The SmartEye system (version 5.8) includes four video cameras with two infrared lightings, located on the dashboard on either side of the steering wheel, as shown in Figure 2. This system measures the participant's head pose and gaze direction in full 3D allowing a very large field of view.

SmartEye system.
2.5. Experiments Procedure
Each participant took part in two driving simulation sessions, normal driving session (alert driving session) and sleep deprived session (sleepy driving session). For each participant, it took two days to accomplish the experiment. The two-day test was conducted approximately 2 weeks apart and each participant was informed two days before performing the experiment. Participants were asked to abstain from alcohol and restrict tea and caffeine consumption 12 h before the test.
For the alert driving session, before the test day, participants were allowed to carry on with their daily life activity and instructed to have at least eight hours of sleep (11:00pm–7:00am) in the night. In the test day, participants arrived at the laboratory at 9:30am, and experiment started at 10:00am. Before the experiment, participant's personal information was checked and the requirements of the study and details of the protocol were informed. The alert driving session lasted for 2 hours. In the first 20 min driving, participants completed a practice training session to be familiar with the simulator. The familiar driving data were excluded, and data in the last 100 minutes driving process were recorded as the alert driving data.
For the sleepy driving session, participants were required to maintain a sleep restriction schedule to induce sleepiness. In the night before the experiment, participants were instructed to have only five hours of sleep (1:00am–6:00am). In the test day, participants arrived at the laboratory at 1:30pm, and experiments were conducted between 2:00pm and 4:00pm or till the driver was too sleepy to continue driving. During these time frames, the circadian rhythm shows higher chance of getting sleepy and drivers are three times more likely to fall asleep at these times than at 10:00am or at 7:00pm [23].
In the two driving sessions, participants were asked to drive at their own pace to observe the usual driving rules without exceeding the highway motorway speed limit (in China 80–120 km/h). Each participant was questioned about his/her sleepy level according to the Karolinska Sleepiness Scale (KSS) [24] before and after the driving task. These subjective KSS scores were recorded as the baseline for the researcher to assess participants' sleepy level during the experiment according to the video data.
2.6. Recorded Data
Three types of data were recorded during the experiment:
digital video of the driver's face recorded inside the cabin at 10 Hz;
digital video of the forward scene recorded outside the cabin at 10 Hz;
eye movements data recorded by SmartEye system at 20 Hz.
All of these data were recorded synchronously.
Eye movements are some of the visual behaviors that reflect a person's inattention level [25]. There are several ocular measures to characterize eye movements such as: face position, PERCLOS [26], eye closure duration, nodding frequency, blink frequency [27], and fixed gaze [28], and they were selected as the characteristic parameters for driver sleepiness detection in this study. Eye movements data, which are used for characteristic parameters calculated, collected by the SmartEye system are listed in Table 1.
Eye movements data collected by SmartEye.

3. Data Analysis
3.1. Video Data
The occurrence of sleepy episodes was determined subjectively based on the face video and the forward scene video. The face view video showed when the driver's head behaviors were created, which include eyes closing for longer than normal, slow blink time, touching or rubbing eye area, nodding head, touching face, scratching head, and shifting in seat. The forward scene view video showed if the driver was drifting out of his/her lane or off the road.
The video data of each participant were reviewed, and their sleepy level was scored on the KSS by three researchers. In the reviewed process, three researchers evaluated participants' sleepy level based on the KSS together. At the same time, participants' subjective KSS score, which was evaluated by themselves when starting and finishing the driving experiment, was considered. The driving session was coded and catalogued according to the KSS score, which could make it easy to locate notable points in the data. All datasets were reviewed and coded by the same researchers. The coded episodes information includes SubjectNumber, KSSscore, StartTime, EndTime, and Comment. The video episodes information and their corresponding descriptions are shown in Table 2.
Video episode information and description.

In this research, driver driving state was classified into two categories, alert driving state and sleepy driving state. If KSSscore ≥ 7, driver was in sleepy driving state and if KSSscore ≤ 3, driver was in alert driving state [29].
3.2. Eye Movements Data
Eye movements data were classified into two categories: alert driving data and sleepy driving data according to different driving states classified in Section 3.1.
3.2.1. Blink Frequency
Blink frequency could be calculated according to
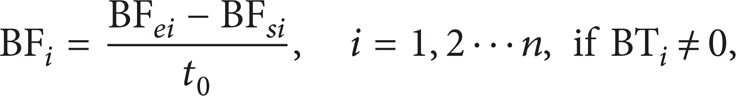
where t0 represents the time window size. BF i represents the blink frequency in the i time window. BF si represents blink times at the start of the i time window from start. BF ei represents blink times at the end of the i time window from start.
3.2.2. PERCLOS
PERCLOS was proposed by Wierwille et al. (1994) [26] first. P80 is a kind of PERCLOS, which represents the percentage of the eyes closed larger than 80% in unit time.
Participant's mean eyelids sizes are calculated according to (2) using the first 100 sets of eye movements data:

where LELM represents the mean size of the left eyelids and RELM represents the mean size of the right eyelids. LEL i represents the size of the left eyelids in ith frame and REL i represents the size of the right eyelids in ith frame.
As is shown in Figure 3, individual differences are important factors on eyelids sizes. To different participants, their eyelids sizes were different. Even to one participant, the left eyelids size was different with the right one.

Mean eyelids sizes.
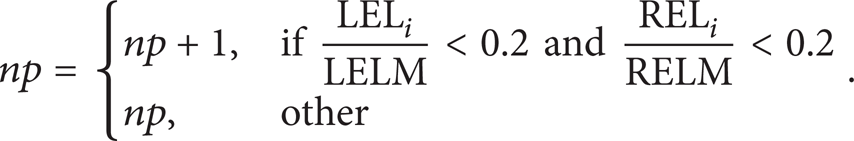
P80 could be calculated according to

where t0 represents the time window and f0 represents the frequency of the eye movements data collected, which is 20 Hz in this paper. np could be calculated according to
3.2.3. Gaze Direction and Fixation Time
Gaze direction and fixation time are the most promising measures to assess driver attention [30]. In order to monitor driver state based on gaze direction and fixation time, fixation region should be divided first. Fixation region was divided into two categories, normal fixation region (NFR) and other fixation regions (OFR). Gaze direction (GD) could be calculated according to (5) and fixation time (FT) could be calculated according to (6):


where FT1 represents the time interval when the driver fixates NFR and FT0 represents the time interval when the driver fixates OFR.
4. Detection Model
4.1. Support Vector Machine (SVM)
First proposed by Vapnik [31], SVM is based on the statistical learning technique and can be used for pattern classification and inference of nonlinear relationships between variables. This method has been successfully applied to the detection, verification, and recognition of faces, objects, handwritten characters and digits, text, speech, and speakers, and the retrieval of information and images [30].
4.2. Model Training
The “LIBSVM” Matlab toolbox [32] was used to train and test SVM models; LIBSVM is currently one of the most widely used SVM softwares. Linear, polynomial, and radial basis functions (RBF) and sigmoid are the four basic kernels. The RBF can nonlinearly map samples into a higher dimensional space, which can handle the case when the relation between class labels and attributes is nonlinear. At the same time, the RBF can reduce numerical difficulties and tends to obtain more robust results than other kernels, such as polynomial. Furthermore, compared to the polynomial kernel, the RBF has less hyperparameters which influence the complexity of model selection [33, 34]. Therefore, the RBF was chosen as the kernel function for the SVM models.

where x i and x j represent two data points and γ is a predefined positive parameter. There are two parameters for the RBF kernel C (the penalty parameter) and γ, and it is not known beforehand. In order to improve the model prediction performance, grid-search is recommended to identify good (C, γ) using cross-validation (CV). LIBSVM provides a tool to check a grid of parameters, and CV accuracy was obtained for each parameter setting. When the highest CV accuracy returns, (C, γ) are selected to the model.
As is shown in Section 3, after extracting eye movements character parameters, four indicators structured the input vector X, including P80, blink frequent (BF), gaze direction, and fixation time X = [P80, BF, FT0, FT1].
Driver sleepiness affects driver behavior in a subtle, inconsistent manner, which can be easily washed out by individual differences. Thus, SVM model was trained for each participant and a general model was developed as a comparison. There were a total of 13 sleepiness detection models developed in this paper, 12 specific models for the corresponding participants and 1 general model. We randomly selected 100 training instances, 50 instances in alert state and 50 instances in sleepy state, from each participant. The general model was developed using the 100 training instances, including 8 instances, 4 alert instances and 4 sleepy instances, that were selected from each participant's training instances and 4 instances that were randomly selected from the remaining of training instances.
4.3. Experimental Results
After all the models were developed, they were tested with the remaining data from the corresponding participants and with the same combination. The detecting accuracy is shown in Figure 4.

SVM models detecting accuracy.
As shown in Figure 4, the performance of the specific models, which were developed for the corresponding participants, are better than the general model, which was developed for all participants. The specific models detected driver sleepiness with 85.41% accuracy (std = 6.96%); the mean accuracy for the general model was 72.23% (std = 9.07%). Paired sample t-test was used to compare different levels of the detecting results between the specific models and the general model. The detecting accuracy of the specific models significantly exceeded the general model (t(11) = 6.724, P < 0.001). The difference between different individuals goes beyond the difference caused by sleepy driving, meaning that a general detection model is not suitable for all drivers.
5. Discussion and Conclusion
Eye movements variables have proven to be the most effective indicators for driver sleepiness detection. Blink frequency, PERCLOS, gaze direction, and fixation time are used in this paper to detect driver sleepiness. Eye movements data are collected by a SmartEye system from a high-fidelity driving simulator study. 12 participants (4 women and 8 men) take part in this experiment. Digital video of the driver's face and the forward scene is recorded during the driving process, and participant's sleepy level is evaluated by three researchers based on the video data. 13 sleepiness detection models, which include 12 specific models for the corresponding participants and 1 general model, are developed based on eye movements variables using support vector machine. The mean accuracy for the general model is 72.23%, which demonstrates that eye movements can be used to detect driver sleepiness in real time. While, the detecting accuracy of the specific models significantly exceeds the general model (P < 0.001). It shows that individual differences are an important consideration when building detection algorithms for different drivers.
The sleepiness detection models are developed based on eye movements variables using four features; more features should be considered in the future. Furthermore, the eye movements data are collected from a driving simulator with realistic hardware. It is critical that a field study of real-world driving should be conducted to assess the validity.
Footnotes
Acknowledgments
This research was supported partly by Doctoral Study Special Research Foundation of Higher Education (no. 20110061110036), International Cooperation Projects of Jilin Science and Technology Department (no. 20130413056GH), and Talent Development Project of Jilin Province (no. 801121100417).