
Abstract
This paper presents a novel data validation algorithm for wireless sensor network. We applied qualitative methods such as heuristic rule, temporal correlation, spatial correlation, Chauvenet's criterion, and modified z-score as algorithms for validating sensor data samples for faults. Performance of the algorithms is evaluated using real data samples of WSNs prototype for environment monitoring injected with different types of data faults such as out-of-range faults, struck-at faults, and outliers and spike faults. Results show heuristic rule, temporal correlation, spatial correlation, chauvenet's criterion, and modified z-score method sit at different point on accuracy, no single method is perfect in detecting different types of data faults and reports false positives when sensor data samples contain different types of data faults. Selected effective methods such as heuristic rule, temporal correlation, and modified z-score are applied successively to data set for detecting different types of data faults but report false positives due to masking effects and increased fault rate. Finally we propose a novel data validation algorithm that uses novel approach in applying heuristic rule, temporal correlation, and modified z-score to data set for detecting different types of data faults. Compared to other methods, the proposed novel data validation algorithm is effective in detecting different types of data faults and reports high fault detection rate by eliminating false positives.
1. Introduction
Wireless sensor networks (WSNs) include sensor nodes from few to several hundred that can be deployed in remote distributed geographical environment to sense phenomenon and transmit it to base station for performing scientific studies, analysis, and decision making. WSNs has unlimited potential for creating revolution in the area of environment management, industrial process automation, transportation, crisis management, precision agriculture, medical care, defense surveillance, smart buildings and smart cities. Many real time deployments [1–4] show that data samples collected from WSNs are prone to be faulty due to internal and external influences, such as environment effects, limitations of resources, power problems, hardware malfunctions, software problems, and network problems, security attacks, and [5–7]. In Ni et al. [8, Table v] the anothers specify different types of data faults and their possible causes. Here we summarize data fault types that we consider in this paper.
Out-of-range faults: sensor data samples that deviate significantly from expected range of values are called out-of-range faults. Out-of-range faults represent sensor values that are physically not possible in the deployed region. Struck-at fault: series of data samples with little or no variation for a period of time greater than expected are called struck-at faults [8]. Data is frozen or remains to a given value. It can be within or outside the expected range of values. Struck-at fault is also called constant fault. Outliers: outliers are isolated data samples that deviate significantly from other members of the sample but appear within the expected range of values. Spike fault: with spike fault, the rate of change in gradient of data samples over period of time is much greater than expected. It occurs in combination of at least few successive data samples [8].
Presence of faults in WSNs data samples may lead to wrong analysis and bad decisions and may cause catastrophic loss of money, time, or even human life. Moreover presence of faulty samples in transmitted data dissipates WSNs energy. Hill et al. [9] found that each bit transmitted in WSNs consumes about as much as power as executing 800–1000 instructions. In WSNs communication is more costly than computation [9, 10], therefore it is important for sensor nodes to validate data [11] and filter out faults in sensed data samples before sending it to base station or users. Presently heuristic rule, temporal correlation, spatial correlation, and statistical methods are commonly used for detecting data faults but no single method is perfect in detecting different types of data faults [12] and reports false positives when data set contains different types of data faults.
In this paper we propose a novel data validation algorithm for detecting different types of data faults. Performance of algorithms is evaluated using data samples of WSNs prototype for environment monitoring injected with different types of faults such as out-of-range faults, struck-at faults, outliers, and spike faults. Compared to other existing methods, the proposed novel data validation algorithm is effective in detecting different types of data faults and reports high fault detection rate by eliminating false positives.
The remainder of this paper is organized as follows: Section 2 introduces state of art study in WSNs data fault detection methods. Section 3 describes data validation scenarios for WSNs using distributed, centralized, and hybrid fault detection strategies. Section 4 proposes data validation algorithms for WSNs. Section 5 describes evaluation of algorithms. Section 6 provides results and analysis. Finally, Section 7 concludes the paper.
2. State of the Art
This section summarizes state of the art in WSNs data fault detection methods. Zhang et al. [13] provides comprehensive overview of existing outlier detection techniques for WSNs. The techniques include statistical based approach (e.g., Gaussian based model), nearest neighbor based approach, clustering based approach, classification based approach (e.g., Bayesian belief network model), and spectral decomposition based approach. Statistical methods like Chauvenet's criterion test [14], z-score [15], and modified z-score [16] are also used for detecting data faults in WSNs. Sharma et al. [12] explored four qualitative methods for detecting data faults in WSNs: rule-based method uses domain knowledge to develop heuristic rule for detecting data faults. Estimation method (e.g., Linear Least-Square Estimation (LLSE) method) uses spatial correlation among neighboring sensor values for detecting data faults. Time series analysis method (e.g., Autoregressive Integrated Moving Average (ARIMA) method) uses temporal correlations among data samples collected by same sensor node for detecting data faults. Learning based method (e.g., Hidden Markov Models (HMMs) [17]) uses training data sets for detecting data faults. Sharma et al. [12] found that no single method is perfect in detecting different types of data faults and suggested that two or more methods can be applied in sequence for detecting different types of data faults. Branisavljević et al. [18] also pointed out that data fault detection should not relay on just one method and some of the selected methods have to be applied successively for detecting different types of data faults.
3. Scenario
Jurdak et al. [6] suggested distributed, centralized, and hybrid fault detection strategies for WSNs. We have used active sensor process (ASP) [19] to specify WSNs fault detection strategies.
3.1. Distributed Strategy
Sensor node with limited memory and processing resource apply data validation algorithm to examine limited amount data samples for faults before sending it to base station. Refer to Section 4 for data validation algorithms. Distributed strategy is illustrated in Figure 1 and specified as follows:

Distributed detection strategy.
Sensor node performs data collection process until a constant time (t); then it performs data validation process. In data collection process, sensor node senses data x at regular time interval and appends it to array in local memory. Data validation processes apply algorithm (refer to Section 4 for data validation algorithms) to check data samples for faults. If status of data is likely good then data is send to base station or user mobile phone, else data is discarded. The process repeats at regular time interval.
Suppose that sensor node needs to send average of sensed values to user mobile phone; then sensor node computes average using data samples whose status is likely good. The process is specified as follows:
3.2. Centralized Strategy
Base station with relatively high memory and processing resource applies data validation algorithm to examine data arrivals over several hours or days for faults. Centralized fault detection strategy is specified as follows:
Sensor node senses data x and sends it to base station at regular time interval. Base station performs data receiving process until a constant time (t) then it performs data validation process. Base station receives data samples from sensor node and appends it to array in database. Data validation process applies data validation algorithm to check data samples for faults and updates status of data in database.
3.3. Hybrid Strategy
Hybrid strategy is illustrated in Figure 2. In hybrid strategy both sensor node and base station apply data validation algorithm to validate WSNs data samples for faults. Sensor node applies data validation algorithm to check its data samples for faults and only valid data is forwarded to base station. Hence wastage of power used in communications of erroneous data samples is avoided.

Hybrid detection strategy.
On receiving data samples from sensor nodes, the base station stores the data samples and applies data validation algorithm to check data samples for faults and only valid data is forwarded to users. This helps in filtering erroneous data samples caused by network problems. Sensor node process is specified as follows:
Sensor node senses data x at regular time interval and appends it to array in local memory. After certain time (t) sensor node applies data validation algorithm to check data samples for faults. If status of data is likely good, then data is sent to base station; else data is discarded. The base station process is specified as follows:
→
Base station performs data receiving process until a constant time (t); then it applies data validation algorithm to check data samples for faults. If status of data is likely good, then data is sent to users; else data is discarded.
4. Algorithms
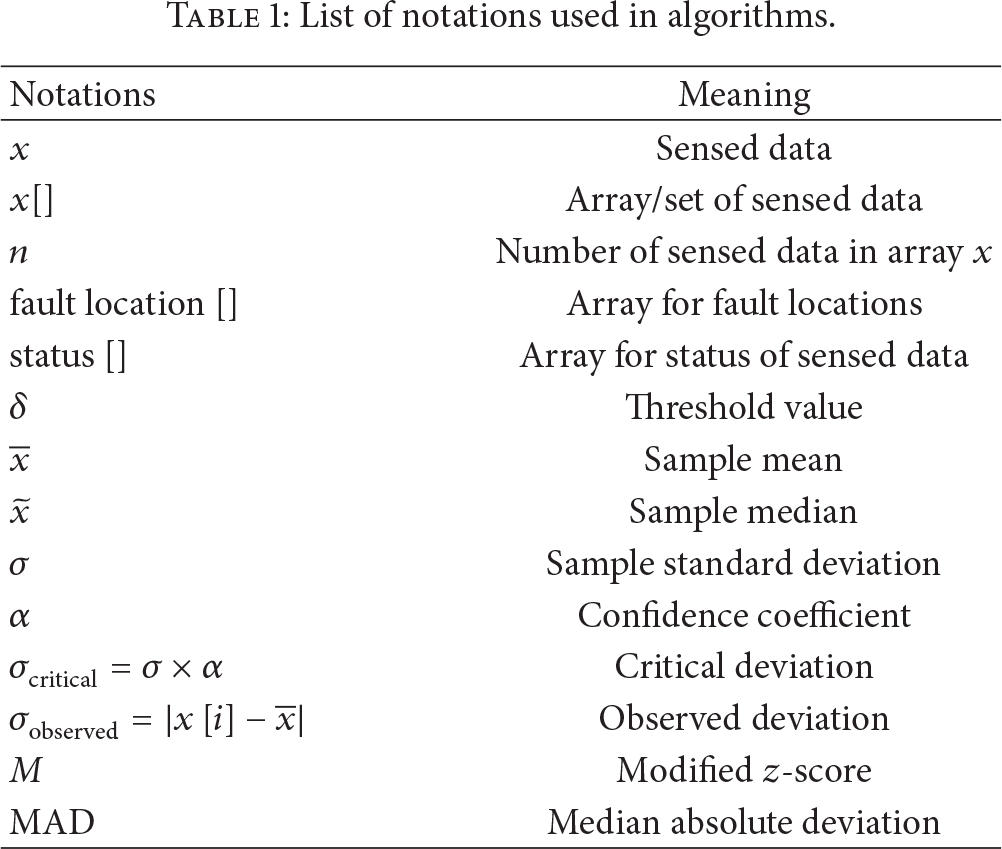
This section summarizes algorithms for validating sensor data samples. Table 1 illustrates list of notations used in the algorithms. Qualitative method such as heuristic rule, temporal correlation, spatial correlation, Chauvenet's criterion, and modified z-score method are applied for validating WSNs data samples.
List of notations used in algorithms.
In Algorithm 1, heuristic rule is used to check WSNs data samples for faults. If sensed data x is within threshold limit (
for if then status else status fault location end if end
In Algorithm 2, temporal correlation is used among data samples collected by same sensor node to check data samples for faults. If difference among successive data samples remains zero for multiple instances then the data samples are in struck-at faults.
for if then fault location else status status end if end for if then status else status status end if end
In Algorithm 3, spatial correlation is used among data samples of neighbor sensor nodes to check data samples for faults. Let us consider sensor node
for if then status else status fault location end if end
In Algorithm 4, statistical method (Chauvenet's criterion [14]) is used to check WSNs data samples for faults, where
Chauvenet's criterion confidence coefficients [20].

for if then status else status fault location end if end for if then status else status end if end
In Algorithm 5, statistical method (modified z-score [16]) is used to check WSNs data samples for faults. Sample median (
for
if then status fault location else status end if end for if then status else status end if end
In Algorithm 6, succession of selected methods such as heuristic rule, temporal correlation, and modified z-score method are applied to data set for detecting different types of data faults. Heuristic rule is used for detecting out-of-range faults, temporal correlation method is used for detecting struck-at faults, and modified z-score method is used for detecting outliers and spike faults.
//out-of-range faults are detected using heuristic rule for if then status else status end if end //struck-at faults are detected using temporal correlation for if then fault location else status status end if end for if then status else status status end if end //outliers & spike faults are detected using modified z-score for if then status end if end for
if then status else status end if end
In Algorithm 7, a novel approach is used in applying heuristic rule, temporal correlation, and modified z-score to data set for detecting different types of data faults. In step 1, heuristic rule is applied to data set for detecting out-of-range faults. If sensed data x is outside the threshold limit (
//step 1 for if then status else status //step 2 if then status fault location else status end if end if end for if then status else status status end if end //step 3 for if if then status end if end if end for
if then status else status end if end
5. Evaluation
Figure 3(a) shows the developed WSNs prototype for environment monitoring with two sensor nodes. The two sensor nodes are deployed in real environment and data samples are collected over one month. Figure 3(b) shows hardware components used in sensor node. Sensor node is developed by integrating MG 811 carbon dioxide (CO2) sensor [22], MQ 7 carbon monoxide (CO) sensor [23], LM 35 temperature sensor [24], Sy-sh-220 humidity sensor [25], XBee trans receiver [26], and GSM (global system for mobile communication) with ARM7 LPC2148 microcontroller [27]. Maxell CR 2032 3V lithium coin cell battery provides uninterrupted power supply to sensor node. Sensor node senses environmental phenomenon such as carbon-dioxide (CO2), carbon-monoxide (CO), temperature, and humidity values in deployed location and sends it to base station. Sensor node is programmed in embedded C using Keil platform [28]. XBee transceiver connected with RS 232 port is used at base station for receiving data from sensor nodes and data is stored in the form of tables with time stamps. Novel data validation algorithm discussed in Section 4 is used in sensor nodes and base station to check sensed data for fault and only valid data is forwarded to users. Algorithms in Section 4 are evaluated using temperature sensor data set (size 10 to 1000 samples) of WSNs prototype for environment monitoring injected with different types of data faults such as out-of-range faults, struck-at faults, outliers, and spike faults. Minimum and maximum possible temperature in the deployed region are set as threshold limit for validating temperature sensor data. Let the threshold limit (

(a) WSNs prototype for environment monitoring with two sensor nodes. (b) Hardware components used in sensor node.
Case 1.
Data set with 30% out-of-range faults.
Case 2.
Data set with 30% stuck-at faults.
Case 3.
Data set with 10% outliers and spike faults.
Case 4.
Data set with 30% data faults which include 10% out-of-range faults and 20% outliers and spike faults.
Case 5.
Data set with 40% data faults which include 20% out-of-range faults and 20% outliers and spike faults.
Case 6.
Data set with 50% data faults which include 20% out-of-range faults and 30% outliers and spike faults.
Case 7.
Data sample set with 60% data faults which include 20% out-of-range faults and 20% struck-at faults, 20% outliers and spike faults.
Fault detection rate (FDR) and false positives are used as metrics for evaluating performance of the algorithms. Fault detection rate (FDR) is the ratio between numbers of correctly detected data faults and total number of data faults. Faulty data misclassified as normal data is called false positives.
6. Results and Analysis
Figure 4 illustrates results of Algorithm 1 in Cases 1 to 7. FDR of Algorithm 1 is 100% in Case 1, 0% in Case 2, 0% in Case 3, 33% in Case 4, 50% in Case 5, 40% in Case 6, and 33% in Case 7. Result in Case 1 shows that Algorithm 1 is effective in detecting out-of-range faults and the results in other cases show; presence of struck-at faults; outliers and spike faults are not detected by Algorithm 1.

Figure 5 illustrates results of Algorithm 2 in Cases 1 to 7. FDR of Algorithm 2 is 0% in Case 1, 100% in Case 2, 0% in Case 3, 0% in Case 4, 0% in Case 5, 0% in Case 6, and 33% in Case 7. Result in Case 2 shows that Algorithm 2 is effective in detecting struck-at fault and the results in other cases show presence of out-of-range faults; outliers and spike faults are not detected by Algorithm 2.

Figure 6 illustrates results of Algorithm 3 in Cases 1 to 7. FDR of Algorithm 3 is 100% in Case 1, 0% in Case 2, 100% in Case 3, 100% in Case 4, 100% in Case 5, 100% in Case 6, and 66% in Case 7.

Result in Case 2 shows that presence of struck-at faults is not detected by Algorithm 3 and the results in other cases show that Algorithm 3 is effective in detecting out-of-range faults and outliers and spike faults. Communication and computation cost for Algorithm 3 will be high compared to other algorithms because it depends on neighboring node data samples for detecting faults.
Figure 7 illustrates results of Algorithm 4 in Cases 1 to 7. FDR of Algorithm 4 is 33% in Case 1, 0% in Case 2, 100% in Case 3, 0% in Case 4, 0% in Case 5, 0% in Case 6, and 0% in Case 7. Result in Case 1 shows that Algorithm 4 is not effective in detecting out-of-range faults. Result in Case 2 shows that presence of struck-at faults is not detected by Algorithm 4. Results in Cases 3 and 4 shows that Algorithm 4 is effective in detecting outliers and spike faults. Result in Cases 5, 6, and 7 shows increase in fault rate and presence of other data faults affects Algorithm 4 in detecting outliers and pike faults. Algorithm 4 is effective in detecting outliers and spike faults in absence of out-of-range faults. Limitation of Algorithm 4 is that the detection of outliers and spike faults is based on mean and standard deviation which can be inflated by few or even single data sample having extreme value. Thus it may cause a masking effect [29, 30]; that is, less extreme outliers go undetected because of the most extreme out-of-range faults.

Figure 8 illustrates results of Algorithm 5 in Cases 1 to 7. FDR of Algorithm 5 is 100% in Case 1, 0% in Case 2, 100% in Case 3, 100% in Case 4, 100% in Case 5, 40% in Case 6, and 66% in Case 7. Result in Case 1 shows that Algorithm 5 is effective in detecting out-of-range faults. Result in Case 2 shows presence of struck-at faults is not detected by Algorithm 5. Result in Cases 3, 4, and 5 shows that Algorithm 5 is effective in detecting outliers and spike faults. Result in Cases 6 and 7 shows increase in data faults rate affects Algorithm 5 in detecting outliers and spike faults. Results shows that Algorithm 5 performs better than Algorithm 4 in detecting outliers and spike faults.

Figure 9 illustrates results of Algorithm 6 in Cases 1 to 7. FDR of Algorithm 6 is 100% in Case 1, 100% in Case 2, 100% in Case 3, 100% in Case 4, 100% in Case 5, 40% in Case 6, and 66% in Case 7. Result in Cases 1 to 5 shows that Algorithm 6 is effective in detecting out-of-range faults, struck-at faults, and outliers and spike faults. Result in Cases 6 and 7 shows that increase in data faults rate affects Algorithm 6 in detecting outliers and spike faults. Increase in fault rate affects FDR of modified z-score method; however it does not affect FDR of heuristic rule and temporal correlation method. Compared to Algorithms 1 to 5, FDR of Algorithm 6 is better but reports false positives in Cases 6 and 7.

Results show that Algorithms 1 to 5 report high false positives when data set contains different types of data faults. Presence of more false positives in transmitted data set may increase communication cost and dissipates WSNs energy. Using single fault detection method may have less computation cost but is not effective in detecting different types of data faults; therefore in Algorithm 6 selected effective methods are applied to data set in succession for detecting different types of data faults which increased FDR compared to Algorithms 1 to 5 but Algorithm 6 reports false positives in Cases 6 and 7 due to masking effect and increased fault rate.
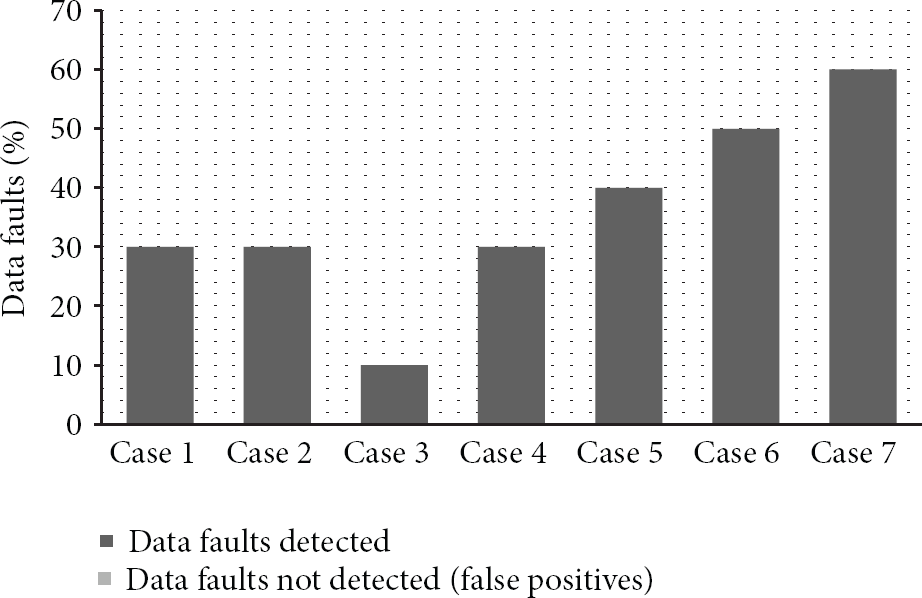
To overcome the limitations of other algorithms, a novel approach is used by Algorithm 7 in applying the selective methods to data set for detecting different types of data faults. Figure 10 illustrates results of Algorithm 7 in Cases 1 to 7. FDR of Algorithm 7 in Cases 1 to 7 is 100%. In Case 1 FDR of Algorithm 7 is 100% better than that of Algorithm 2 and 33% better than that of Algorithm 4. In Case 2 FDR of Algorithm 7 is 100% better than that of Algorithms 1, 3, 4, and 5. In Case 3 FDR of Algorithm 7 is 100% better than that of Algorithms 1 and 2. In Case 4 FDR of Algorithm 7 is 33% better than that of Algorithm 1, 100% better than that of Algorithm 2, and 33% better than Algorithm 4. In Case 5 FDR of Algorithm 7 is 50% better than that of Algorithm 1, 100% better than Algorithms 2 and 4. In Case 6 FDR of Algorithm 7 is 40% better than Algorithm 1 and 100% better than that of Algorithm 2 and 100% better than that of Algorithm 4, and 40% better than that of Algorithms 5 and 6. Figure 11 compares results of all seven algorithms in Case 7. In Case 7 FDR of Algorithm 7 is 66% better than that of Algorithm 1 and 66% better than that of Algorithm 2, 33% better than that of Algorithm 3, 100% better than that of Algorithm 4 and 33% better than that of Algorithm 5, and 33% better than that of Algorithm 6. Results show that Algorithm 7 performs better than other algorithms when the data set contains different types of data faults. Compared to other algorithms, the proposed novel data validation algorithm (Algorithm 7) reports high fault detection rate by eliminating false positives; therefore communication cost for Algorithm 7 will be less than other algorithms. Due to multiple methods used in Algorithm 7 the computation cost will be higher compared to other algorithms; however in WSNs cost for computation is much less than communication [9]. Similar results are reported for the carbon-dioxide (CO2), carbon-monoxide (CO), and humidity sensor data set of size 10 to 1000 samples.
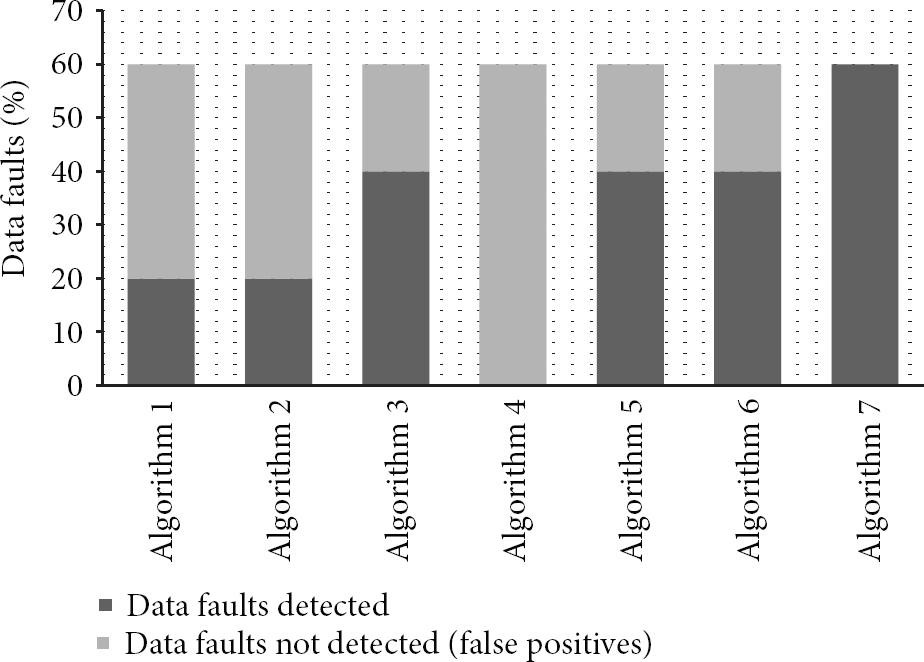
Comparison of results of algorithms in Case 7.
7. Conclusion
Data validation is an essential process that improves WSNs dependability. In this paper we presented WSNs prototype for environment monitoring in distributed, centralized, and hybrid fault detection strategy using a novel data validation algorithm. We evaluated the performance of qualitative methods such as heuristic rule, temporal correlation, spatial correlation, Chauvenet's criterion, and modified z-score method using data samples of WSNs prototype for environment monitoring injected with different types of data faults such as out-of-range faults, struck-at faults, and outliers and spike faults. Fault detection rate and false positives are used as metrics for evaluation. Results show heuristic rule, temporal correlation, spatial correlation, chauvenet's criterion, and modified z-score method sit at different point on accuracy, no single method is perfect in detecting different types of data faults and reports false positives when data set contains different types of data faults. We applied selected effective methods such as heuristic rule, temporal correlation, and modified z-score to data set in succession for detecting different types of data faults which increases FDR but still reports false positives due to masking effects and increased fault rate. Finally we propose a novel data validation algorithm that uses a novel approach in applying heuristic rule, temporal correlation, and modified z-score to data set for detecting different types of data faults. Compared to other methods, the proposed novel data validation algorithm is effective in detecting different types of data faults and reports high fault detection rate by eliminating false positives. Therefore the proposed novel data validation algorithm is desirable to apply at sensor nodes and base station to effectively eliminate different types of data faults.
Footnotes
Acknowledgments
The authors are thankful to the management of Aarupadai Veedu Institute of Technology-Vinayaka Missions University for the partial financial support provided in the development of WSNs prototype for environment monitoring which helped to come out with this research work.