
Abstract
Turbulent Taylor-vortex flows over regularly spaced square ribs mounted on a rotating inner cylinder surface were investigated using direct numerical simulations (DNSs) for a Reynolds number of 3200 (based on the inner-wall velocity and the gap width between two cylinders) in an apparatus with an inner-to-outer radius ratio of 0.617, while varying the streamwise interval of the ribs. We examined the flow and pressure fields around each rib, focusing on the recirculation zone, the frictional drag coefficient, and the pressure (form) drag. Our results for the Taylor-Couette flows were compared to DNS for plane Poiseuille flows over ribbed surfaces performed by Leonardi et al. (2003). We determined the qualitative consistency between them with respect to the roughness effect, which depends significantly on the rib interval, but the rate of increase in the flow resistance was remarkably dampened by roughness in the present flows. Taylor vortices remaining over roughened cylinder surfaces were found to induce quick pressure recovery behind each rib, leading to less pressure drag and an enhanced backflow in the recirculation zone.
1. Introduction
Turbulent flows over rough surfaces are often encountered in practice. For example, atmospheric and ocean flows occur over rough surfaces and, in an engineering context, most industrial pipes and ducts are not smooth, especially at high Reynolds numbers. Roughness geometry is generally known to cause a large flow resistance. In some industrial applications, roughness elements are applied to enhance heat transfer, even at the expense of drag augmentation. Similarly, in the living world, sharkskin has roughness in the form of riblets that contribute to drag reduction. That is, roughness geometries can seriously influence (favorably or unfavorably) performances of practical applications. From this perspective, the prediction of roughness effects on various different flows is important.
A number of studies addressing this issue have been performed over a long period and have attracted great interest in many industrial applications, for example, [1–5]. A flow accompanied by a separation and a reattachment would significantly affect frictional and pressure drags and would complicate heat transfer and fluid mixing. Therefore, the majority of fundamental investigations in the literature have been performed for a rather canonical flow, that is, Poiseuille flow (hereafter, PF) in a plane but ribbed channel. For instance, Krogstadt and Antonia [6] experimentally demonstrated that the surface geometry significantly affected the turbulent characteristics: Wanget al. [7] investigated the physical process of separated flow in a square channel roughened with periodically transverse ribs on one wall. Many numerical studies [8–12] have been carried out on PF in ribbed channels by means of direct numerical simulation (DNS) or large-eddy simulation (LES). We particularly wished to undertake a comparative study of the present DNS results and those of Leonardiet al. [10], who investigated turbulent PF through transverse square bars attached to one wall. They reported that the ratio of the streamwise interval of ribs (λ) to the rib height (h) was an important parameter for determining the relationship between the flow resistance and the surface roughness. We compile here a database of DNS including a few experiments, as listed in Table 1. However, there have been few studies on the roughness effect for turbulent flows in curved channels and, to the authors' knowledge, there has never been any parametric DNS study on a turbulent Taylor-Couette flow (TCF) with regular roughness elements (other than DNS for stepped cylinder [13, 14]).
Compiled data.

OCF, open channel flow; PF, plane Poiseuille flow; TCF, Taylor-Couette flow. The Reynolds number Reδ is based on the inlet free-stream velocity for each smooth-wall case and δ, which means either the boundary-layer thickness (for OCF), the channel half width (for PF), or the whole gap between cylinders (for TCF). The numbers with † are based on the bulk mean velocity and δ. The ratios among the roughness height h, the roughness interval λ, and the reattachment length Lre are also shown.
As is well known, TCF occurs when fluid is contained between two concentric independently rotating cylinders and often provokes Taylor vortices due to Coriolis instability when the inner cylinder rotates at relatively high speed [15, 16]. The Taylor vortex has a size comparable to the cylinder gap and induces significant momentum transfer in the radial direction. Numerous studies on the statistics and structures of turbulent Taylor-vortex flow (between smooth cylinders) are available in the literature dated as early as Coles [17], Barcilonet al. [18], and as recently as Dong [19], van Hout, and Katz [20]. Hence, it is of interest to determine any modulation of the turbulent Taylor-vortex flow by rough surfaces and its influence on the roughness effects. Recently, Matsumoto et al. [21, 22] executed measurements of the flow resistance in TCF with inner cylinders roughened by either regular or irregular elements. They demonstrated a significant increase of the flow resistance that was dependent on the height and interval of roughness elements.
In this study of TCF with roughened inner cylinders, the skin-friction drag and the pressure (form) drag were determined for a range of λ/h. We prepared five different inner cylinders that had square ribs of the same shape but a different number of these ribs. The roughness effects on the flow resistance were investigated, also taking account of influences of the Taylor vortex.
2. Flow System and Numerical Procedure
2.1. Problem Definition and Test Conditions
The flows we consider here are fully developed turbulent Taylor-Couette flows over a roughened inner-cylinder surface. In the Taylor-Couette flow system, the fluid is enclosed between two coaxially rotating cylinders with radii R1 and R2 for the inner and the outer cylinders, respectively. The gap width between the cylinders is denoted as d. We limit our present study to the case where the outer cylinder is at rest, while only the inner cylinder is rotating at a constant angular velocity ω. Several transverse ribs acting as roughness blocks are installed on the inner-cylinder surface at regular intervals in the circumferential direction. The configuration with respect to one of the present test cases is schematically illustrated in Figure 1, showing the coordinate system and a case where four ribs are located at θ = 0°, 90°, 180°, and 270°. The cross-section of the rib is in the shape of a square, being h × h with h = 0.1d, when mapped to the Cartesian coordinates. In this study, the simulations were carried out in a cylindrical coordinate system: that is, the circumferential (or streamwise), radial (wall-normal), and axial (spanwise) directions are described by θ, r, and z, respectively, and the velocity components in each direction are represented by u, v, and w.

Configuration of Taylor-Couette flow and coordinate systems.
The radius ratio between the cylinders is represented by

and the aspect ratio is of

The previous ratios were chosen to compare with another DNS [23] for smooth cylinders under the same conditions. Here, L z denotes the length of the computational domain in the z direction. The present value of Γ is expected to accommodate at least two Taylor-vortex pairs or four individual vortices, on the basis of an experimental result [24] showing that the spanwise wavelength of the Taylor vortices in the present condition would be 2.29d. The computational domain size and the grid numbers are summarized in Table 2. Since the ribs were mounted axisymmetrically with respect to the axis of rotation, only one half or a quarter of the entire annular domain is considered. The periodic boundary conditions are imposed in the θ and z directions on the assumption that the flow field should theoretically be either periodic or homogeneous in those directions if a given computational domain is large enough compared to inherent turbulent structures. Nonslip and nonpenetration boundary conditions were applied to the walls including the ribs.
Computational condition.

We examined five different numbers of ribs installed on the inner cylinder. Each inner cylinder had either 2, 4, 8, 12, or 16 convex roughness elements, which were in the same shape of a square configuration and arranged at uniform intervals in each case: see Figures 2 and 3. We named each of those test cylinders as an “Rn,” where n means the number of ribs. For example, the test cylinder labeled as R4 has four ribs on the inner cylinder. Strictly, it should be noted that the width of upper surface of the rib is about 6% longer than that of the bottom, since the circumferential grid size is altered depending on the radial location because of the cylindrical coordinate.

Rib patterns.

Geometry of a rib on an inner cylinder.
2.2. Numerical Method
The fluid is assumed to be incompressible and Newtonian. The governing equations for the fluid motion are the equation of continuity

and the Navier-Stokes equation

where

and

For the spatial discretization of governing equations, the finite difference method was adopted on a staggered grid. The central difference scheme with 4th-order accuracy was employed in the θ and z directions, while one of 2nd-order accuracy was applied in the r direction. Equations (3) and (4) were decoupled by the fractional step method. Time advancement was carried out by the 2nd-order Adams-Bashforth method, but the 2nd-order Crank-Nicolson method was used for the viscous term in the r direction. The Poisson equation for pressure correction was solved in the Fourier space using fast Fourier transforms, and a tridiagonal solver was employed for the radial direction. In order to mimic solid bodies of roughness elements installed on the inner cylinder, the direct-forcing immersed boundary technique [25, 26] was applied on the surface and inside of the roughness elements. This approach allows the solution of flows over complex geometries without the necessity of body-fitted grids. Figure 4 shows a magnified view of grids around the cylinder and a rib. The uniform grids were used in the θ and z directions, while the density of the computational mesh was not uniform with more resolution near the edge of rib and wall boundaries, as shown in Figure 4.

Magnified view of computational grids with emphasis on a rib, viewed from the spanwise direction.
The simulation was conducted at a Reynolds number fixed at
where U w is the inner-wall velocity, corresponding to R1ω. This Reynolds number and the radius ratio η = 0.617, characterizing the flow state of a Taylor-Couette flow, are equivalent to those in DNS performed by Bilson and Bremhorst [23] for the additional advantage of code verification. These conditions were reasonable, because turbulent flows accompanied by Taylor vortices with/without roughness of the inner cylinder are of interest in this work. The onset of turbulent Taylor vortices is a function of the Reynolds number, the radius ratio, the aspect ratio, and even the initial condition. For instance, according to a flow map reported by Anderecket al. [16], the onset occurs at Re ≈ 1370 (for η = 0.883 with a stationary outer cylinder). We expected that the present Reynolds number would be large enough for flows to be turbulent. The first (or preliminary) test case in the present study was run in smooth-surface cylinders. The primary results considered here were the existence of Taylor vortices and the vortex wavelength, which were identified from visual inspection of the velocity field. Generally, the vortex wavelength was expected to be approximately equal to 2d or slightly larger. As shown in Figure 5, we have actually confirmed the presence of four Taylor vortices, that is, a turbulent Taylor-vortex flow, in our simulations under the previous conditions. Although not demonstrated here, various statistical quantities that were obtained for the smooth surface were in excellent agreement with the DNS database of Bilson and Bremhorst [23], showing that the present numerical code was verified successfully.

Visualization of Taylor vortices by isosurface of vorticity: red, ωθ = 0.5; blue, ωθ = – 0.5.
3. Result and Discussions
3.1. Flow Field around Ribs
Figure 6 shows the streamlines averaged in time and in the homogeneous spanwise (z) direction for the present rib-roughened TCF obtained after the flow reached a statistically steady state. In the figures, the full length of each entire computational domain in the streamwise direction is presented, but in the radial direction only the lower half of the domain is visualized. We now introduce an alternative coordinate y (= r – R1) ∈ [0, d] as the wall-normal distance from the inner cylinder surface. The contour represents the magnitude of the local mean velocity U in the streamwise direction: hereafter, capital-letter symbols such as U and P denote respective averaged values. In addition, x (= R1θ) will be used as the streamwise coordinate, instead of θ. In this figure, we can confirm several features characterizing flows over a bluff body such as the separations from the leading and trailing top edges of the body, the recirculation zone behind the body, and the secondary vortex in the upstream corner of the body. The separated flow, which emanates from the leading top edge of a rib, is deflected away from the relevant rib and reattaches to the inner-cylinder surface. The reattachment length Lre, defined as a streamwise distance from the downstream face of the rib to the reattachment point, is found to increase with increasing rib interval λ: in the cases of R8, R4, and R2, Lre = 3.8h, 4.3h, and 5.0h, respectively. Since U of the approaching flow to a sparsely located rib increases compared to that for densely-located ribs, the ascending motion of flow separated from the leading edge would also be enhanced. This motion gives rise to a thickening of the recirculation zone behind the rib. As for very short intervals of ribs (R12 and R16), the reattachment does not occur on the cylinder surface but on the vertical facing wall of the next rib, resulting in the formation of a cavity flow between the two ribs. In such cases, owing to the recirculation zone, the streamwise mean velocity is negative above the entire length of the cavity wall and there is no reattachment point. In consequence, as seen in Figure 6, the contour of U exhibits fewer significant streamwise variations in the flows over successive dense cavities (for R12 and R16).

Mean streamlines and contour of mean streamwise velocity in the x-y plane.
The mean reattachment length Lre in each case is determined by averaging in time and z with respect to all ribs on the cylinder, as given in Figure 7 and also in Table 1. Also shown are results obtained by simulations and experiments for different flow geometries, that is, backward-facing steps and plane channels roughened by various cross-sectional shapes of ribs. A comparison of those results indicates that Lre for the present Taylor-Couette flow is relatively short. This tendency is in good agreement with the result of Yanget al. [14], who examined TCF with backward-facing steps using DNS with a body-fitted grid system. They remarked that the shortening of Lre for TCF should be attributed to the curvature effect. In order to elucidate this causation further, we here discuss the pressure distribution and its relationship to the reattachment length. Mean-pressure distributions on the inner-cylinder surface with emphasis on the recirculation zone are shown in Figure 8. Here, the pressure is a mean value that is averaged in time and the z direction and is assumed to be zero at (x, y) = (0,0). Several results for PF [2, 3, 10] are also plotted for comparison. In all cases shown in the figure, the pressure quickly recovers from a low (or negative) value just behind the rib, especially, in a downstream region of x/h = 1.5–6. It can be clearly seen that the pressure recovery is significantly augmented in the present cases of TCF. This implies that the shortening of reattachment length for TCF is caused by the strong adverse pressure gradient behind each rib. Figure 9 shows a typical snapshot of pressure distribution on the inner-cylinder surface. The local pressure has a minimum value near the center of the recirculation zone and a maximum value in front of the leading vertical wall of rib. Large pressure differences are observed at spanwise positions where in-flow motions are induced by counterrotating Taylor vortices. It is interesting to note that the pressure recovery in the region downstream of each rib is also significant because of an enhanced momentum transfer by the in-flow motion. Although the out-flow motion might induce a lowering of the near-wall pressure, this out-flow contribution clearly seems insignificant relative to the in-flow. In the smooth-cylinder case (not shown in figure), the roll cell of Taylor vortices has provided high and low pressure regions alternating in the spanwise direction with an amplitude of ± 0.1. From examining these findings, we here draw conclusions that the Taylor vortex in TCF has encouraged the pressure recovery behind each rib, the reduction of pressure by the out-flow motion has been degraded by the presence of ribs, and these phenomena have led to a strong adverse pressure gradient (downstream of each rib) and the shortening of the reattachment length.

Mean reattachment length for various flow geometries. For abbreviation, see Table 1: TBL, turbulent boundary layer.

Distribution of mean pressure along the bottom surface of the cavity region behind a rib. The pressure is normalized by kinetic pressure Pc, kinetic = ρU c 2/2 at the channel center of y = 0.5d.

Contour map of instantaneous pressure in a θ-z (or x-z) plane at y = 0.0015d from the inner-cylinder surface for R8 (λ/h = 12.7). Isolines representing negative values are shown with broken lines. The main flow direction is from left to right. The schematic diagram illustrates a mean secondary flow, that is, pairs of Taylor vortices, occurring between the cylinders.
Figure 10 shows the mean streamwise velocity in the recirculation zone, that is, at x = Lre/2 of each case. For R12 and R16 (without reattachment on the bottom surface), the length of the clearance gap between neighboring ribs is given as Lre. The velocity is normalized by the channel-centerline velocity U c averaged also in the streamwise direction: thereby, the value of U/U c at y = 5h may deviate from the unity. In the core region far from the wall, U/U c is reasonably increased by decreasing the number of ribs. On the other hand, this dependency on the number of ribs (or the rib interval λ) becomes negligible in y/h < 1, where the velocity profiles are found to be scaled well with the present normalization. The magnitude of maximum backflow velocity is around 40% of the reference velocity for the present TCF, whereas that for OCF reveals a smaller magnitude of 10% [4] even under the comparable condition in terms of h/δ. This large difference in the backflow velocity must be caused by the (previous-mentioned) strong adverse pressure gradient occurring in TCF, although the Reynolds-number dependency might also be responsible for that. In the following sections, we will discuss variations of pressure and frictional drags, taking account of the quick-pressure-recovery effect.

Mean streamwise velocity at the midway point in the streamwise extent of each recirculation zone.
3.2. Drag Factors
Prior to the quantifying details of modulations observed in the turbulent characteristics, we estimate the magnitudes of drag factors. Over a segment with the streamwise extent of λ, the contributions of the skin-friction drag (C f ) and the pressure (form) drag (C p ) to the total drag coefficient (C d ) are defined by the following equations:


Here,
Figure 11 shows the dependence of C d on the rib interval normalized by the rib height. The vertical axis represents the coefficient ratio of C d /Cd, smooth, where Cd, smooth is the value obtained for the smooth-surface counterpart, being equivalent to the frictional drag because there is no form drag. In this figure, a DNS result on PF [10] and an experimental result on TCF (for η = 0.939) [22] are plotted for comparison. Leonardiet al. [10] reported that, in the plane channel flow, the maximum drag was obtained at λ/h = 7, downstream of which the drag decreased monotonically with increasing λ. In contrast, for λ/h < 7, the drag was increased linearly as a function of λ/h. In this linear regime, the flows were observed to make cavity flows between the ribs without reattaching to the bottom wall surface, as in the present case of R12. According to our result on TCF, the λ-dependency of the drag coefficient shows quite a similar trend, but the peak location shifts to λ/h = 13 and the magnitude of C d /Cd, smooth decreases by about a third. In addition, a good agreement with Matsumotoet al. [22] can be confirmed. Note that, although their measurements were carried out on TCF with rib-roughened inner cylinders, some important parameters were inconsistent with the present conditions: for example, Re = 54000, η = 0.96, and h/d = 0.2 in [22].

Drag coefficients normalized by the smooth values as a function of rib interval.
In order to gain some insight into the mechanism of the drag variation with λ, let us decompose it into C f and C p . Figure 12 shows that there are two distinct regimes for both components: C f and C p exhibit either minimum or maximum value with a single peak, at which each trend alters to an upward/downward monotonic tendency. For 0 < λ/h < 6, C f seems to decrease as λ/h increases, while beyond λ/h = 7, C f increases slowly as λ/h increases, showing a remarkable consistency with the results on PF [10]. (Strictly speaking, the rib interval that minimizes C f for TCF is not clearly determined by the present results.) On the other hand, λ/h that maximizes C p is obviously changed between PF and TCF, and the magnitude of C p is less than 60% of that for PF at the same λ/h. These variations in C p should also be attributed to the enhanced pressure recovery behind rib in TCF. Since C p ≫ C f , the variations in C d are practically the same as those observed in C p .

Drag coefficients of total C f + C p (half-filled symbols), pressure C p (filled symbols), and friction C f (open symbols), as a function of rib interval.
3.3. Local Skin-Friction Drag
Figure 13 shows streamwise distributions of the local skin-friction drag, which is defined as (9) but not averaged in θ. The channel-flow DNS data [3, 10] are also presented. In an upstream region of – 3 < x/h < – 1, a negative C f is intensified near the rib, because of the presence of a secondary vortex in the upstream corner of the rib. Irrespective of the flow configuration, the local C f agree reasonably well with each other in this region. The local C f has a peak at the leading top edge of the rib (x/h = – 1), at which there exists a separation point. This peak value is increased with increasing λ/h, because the approaching flow velocity at the rib height becomes large for longer λ/h. In the region immediately downstream of the rib, the local C f becomes largely negative value, because of the backflow induced by the recirculation zone. This negative peak for each present case is pronounced compared to those for the plane channel flows. As previously described (cf. Figures 9 and 10), the backward flow for TCF is enhanced by the strong adverse pressure gradient. Consequently, the local C f changes more drastically behind the rib in TCF. After the reattachment point (at which C f = 0), the local C f attains a constant value more rapidly than in the rib-roughened PF. Comparisons between the result by Leonardiet al. (λ/h = 11) [10] and of R8 and between Leet al. (λ/h = 30) [3] and R2 demonstrate large differences around the reattachment point.

Local skin frictional coefficient for different values.
In terms of local C f , there exist noticeable discrepancies between TCF and PF in the recirculation zone and around the reattachment, as remarked previously. This implies that the skin-friction drag as well as the pressure drag should be affected by the flow geometry characterized by the curvature and Coriolis instability. Hence, there still remains a possibility that the good accordance in C f between TCF and PF, observed in Figure 12, might be either doubtful or accidental.
3.4. Force Balance in the Cavity Region
In this section, we focus on the force balance with respect to the cavity region bounded by consecutive roughness elements: see Figure 14, in which the cavity region can be defined as

The term on the left-hand side of this equation corresponds to the difference of pressures exerted on vertical faces of the rib; the first and second terms on the right-hand side represent the viscous shear stress at the rib height and at the bottom surface, respectively, and the last term is the Reynolds shear stress integrated at the rib height. Here, an overbar and a prime denote an averaged and a fluctuating component, respectively. Note again that both U and P are averaged quantities. After dividing by λ and nondimensionalization by U w and d, (11) is rewritten as
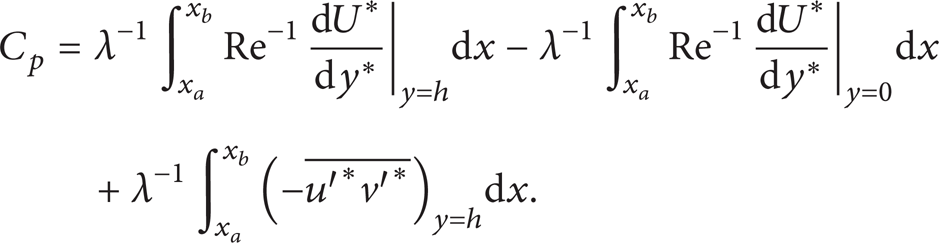
Accordingly, the pressure drag can be related to balance with three stresses.

Conceptual diagram of force balance with respect to the cavity region.
Pressure profiles along the upstream- and downstream-side vertical walls of the rib are shown in Figure 15. The pressure is calibrated as zero at the bottom-downstream corner of the rib, the same as with Figure 9. While the pressure remains constant on the downstream-side rib surface, it decreases for y/h > 0.7 on the upstream side. The pressure in the upstream side increases with increasing λ/h, since the velocity of the approaching flow to the rib increases. Figure 16 (a) shows the streamwise distribution of Re−1(dU/dy)y = h. The velocity gradient increases dramatically near the leading edge of the rib, since the velocity is accelerated by flow contraction. At a sufficiently large distance from the trailing edge of the rib (x/h > 10), Re−1(dU/dy)y = h approaches a constant approximate to the value for a smooth surface, so that its relevant integral term in (12) decreases when x/h increases. As for Re−1(dU/dy)y = 0, Figure 16 (b) shows behaviors that are similar to those of local C
f
presented in Figure 13. The Reynolds shear stress of

Distribution of mean pressure on the rib surface as a function of y. The pressure is normalized by kinetic pressure Pc, kinetic at the channel center of y = 0.5d.

Distributions of shear stress: (a) viscous shear stress at the rib height, (b) viscous shear stress on the bottom surface of the cavity region, and (c) Reynolds shear stress at the rib height.
To evaluate the accuracy of the present analysis, we compared two values for the pressure-drag coefficient C p , which were separately obtained from either (10) directly or (12) on the basis of the force balance in the cavity region. We have confirmed that the previous approach using (12) is sufficiently applicable to our study and there is residual error of less than 7%.
Based on these results, we discuss the effect of the rib interval on each drag factor (see Figure 17). The first term on the right-hand side of (12) is practically independent of the rib interval, so that the magnitude of its contribution is almost the same, irrespective of λ/h, but almost negligible relative to that of the Reynolds-shear-stress term. The second term contributes to an increase in C p when the rib interval is shorter than 15h. On the other hand, in the case of λ/h > 15, this term gives rise to a decrease in C p . The trend of the third term (the Reynolds-shear-stress term) changes clearly, depending on λ/h, in particular, at λ/h = 13. However, its contribution to C p is maintained at high values throughout a wide range of λ/h. From these results, it may be concluded that the pressure drag is balanced mainly with the Reynolds shear stress, but its dependency on the rib interval is attributed to the rib-interval dependency of the frictional drag on the bottom surface (at y = 0).

Dependence of each drag component on rib distance.
4. Conclusion
We studied turbulent Taylor-vortex flows between two concentric cylinders, the inner one of which was roughened with transverse ribs with a regular interval λ. The inner cylinder with a radius of R1 was rotated at a constant angular velocity of ω, while the outer cylinder with a radius R2 was stationary. By parametric research by means of direct numerical simulation, we investigated the effect of the rib interval on the flow field around the rib and the flow resistance. We tested five different test cases, varying the number of ribs on the inner cylinder, while the cross-section shape of each rib and the parameters of the Reynolds number and the radius ratio were fixed: Re = (R1ω(R2 – R1)/ν) = 3200 and η = R1/R2 = 0.617. The present results for the Taylor-Couette flows were compared with those for various flow geometries, such as Poiseuille flows through rib-roughened plane channels, to elucidate the effects of flow curvature and Coriolis instability characterized by the Taylor vortex on the statistical quantities.
The most important conclusion drawn from this research is that the increment in the pressure (form) drag due to roughness is dampened as a result of the strong adverse pressure gradient behind each rib, which is enhanced by the in-flow motion of the Taylor vortices. In a Taylor-Couette flow under the present conditions, turbulent Taylor vortices that elongates in the circumferential direction would occur for a smooth cylinder: we actually observed their presence in the flow field and moreover they also existed in the cases of rib-roughened inner cylinders. The Taylor vortices induced significant momentum transfer into the near-wall region and encouraged pressure recovery in the downstream region of ribs. The adverse pressure gradient became strong relative to that in the plane channel flow, yielding a shortening of the reattachment length and an intensification of the recirculation. These phenomena were more pronounced as the rib interval was extended. The distributions of the local frictional drag C f and the mean streamwise velocity U, in conjunction with the mean streamlines indicate that, for λ/h ≥ 13, the ribs are isolated, since the size of the recirculation zone no longer depends on λ/h. The maximum C p occurred at λ/h = 13 when the reattachment on the bottom wall took place immediately upstream of the subsequent rib. For λ/h < 13, the separated flow reattached directly to the downstream rib, giving rise to a recirculation zone like a cavity flow between two ribs. Similar to the case of plane channel flow, the total drag in the present flows was contributed almost entirely by the pressure drag. However, this contribution, that is, the pressure-drag coefficient C p , was decreased by about a third compared to that in the channel flow. The value of C p depended on λ/h, so it can be concluded that λ/h was a key parameter even for the Taylor-Couette flow. The insight into the component of the pressure drag was obtained by equalization of various stresses in the cavity region. The pressure drag was mainly affected by the Reynolds shear stress at the rib height, while the viscous shear stress by the mean flow at the same height was negligible.
Finally, the present simulations were conducted using one basic procedure (with h fixed and λ varied stepwisely), one radius ratio η = 0.617, and one axial length Γ = 4.58, for the rotating inner cylinder and the stationary outer one. Changing the parameters or the procedure will, to a greater or lesser extent, affect the magnitudes of the drag factors and their dependencies on roughness characteristics, possibly producing other flow states that may show qualitative differences in the influence of organized turbulent structures on drag enhancement/reduction.
Footnotes
Nomenclature
Acknowledgment
The present simulations were performed with the use of NEC SX-9 at Cyberscience Center in Tohoku University.