Near-field ultrasonic phased array theory is researched and utilized in the carbon-fiber wing box to identify the damage in the structure. Near-field ultrasonic phased array based structural health monitoring is researched to overcome the limitation of the far-field ultrasonic phased array in monitoring scope. The time delay of the theory and the process of the damage identification method are researched in detail. The recognition result is shown in a mapped image. The proposed method is applied in carbon fiber-reinforced polymer (CFRP) wing box to monitor the load in the structure. The experimental results show that the near-field ultrasonic phased array based structural health monitoring method is effective to identify the load position in the structure.
1. Introduction
Lamb wave can propagate a long distance in plate-like and shell-like structures [1, 2]. Hence, the structural health monitoring (SHM) [3–9] based on Lamb wave has emerged as a promising technique by using piezoelectric (PZT) actuators/receivers to generate/receive the signals for monitoring the structural damage. Ultrasonic phased array based structural health monitoring [10–15] can control the Lamb wave beam steering to scan the structure in a certain direction to identify the damage in the structure by controlling the time delay of transmitting and receiving for each PZT element in the PZT sensor array. Previous researches on ultrasonic phased array were carried out under the condition of the monitoring target in the PZT sensor array far-field [16–19]. In this condition, the monitoring method cannot exactly identify the damage of the structure in PZT sensor array near-field area. For the far-field ultrasonic phased array structural health monitoring, the Lamb wave beams connecting the PZT sensors with the monitoring target are parallel each other. But in the near-field, the Lamb wave beams from PZT elements to monitoring target are not parallel with each other. They focus on the monitoring target. The formulas used in the far-field ultrasonic phased array based structural health monitoring become invalid in near-field ultrasonic phased array.
In this paper, the near-field ultrasonic phased array based structural health monitoring is researched. The time delay used in near-filed ultrasonic phased array and the damage identification process using near-field ultrasonic phased array theory are researched. The damage identification result is shown on a mapped image. The proposed method is verified by experiments on the wing box and the results show that it is effective to identify the damage position of structure.
2. Near-Field Ultrasonic Phased Array Theory
Near-field ultrasonic phased array principle is shown in Figure 1. The PZT linear sensor array consists of M PZT elements with each PZT element acting as a transmitter and receiver. The PZT elements in the array are equally spaced at the distance d. The coordinate system origin is set to the most left point of the PZT sensor array and the 0° direction is consistent with the alignment of the PZT sensor array. The coordinate in cartesian coordinate system of ith PZT element is , where .
Near-field ultrasonic phased array theory.
The near-field ultrasonic phased array principle is applied to generate and receive Lamb waves. For a near-distance point , the rays connecting the point P with the sensors are focused on the point P. Coordinate system origin is acted as a reference point. For the ith PZT element, the distance fromthe point P to the sensor will be shortened by
The signal from the ith PZT element will arrive at point P quicker than the point P to coordinate system origin by
where c is the Lamb wave speed traveling in the structure.
The total signal received at point P will be
where is the amplitude attenuation coefficient in signal emission process, represents excitation signal, and is the time due to the travel distance between the coordinate system origin and the point P. Here, wave-energy conservation is assumed.
If the PZT elements are not excited simultaneously, but with specific time delays for each PZT element, the total signal received at point P will be
According to the principle of reciprocity, the receiving process is consistent with exciting process under the same conditions. The point acts as a new wave source reflecting the signal to all the PZT elements. The signal arrives the ith PZT element quicker by . Its expression is
where is the amplitude attenuation coefficient in signal reception process. represents the signal that the point P received.
Hence, with specific time delays for the ith PZT element, the signal that reached the PZT element will be
The total signals received from the beam-steering of θ will be
where is the amplitude attenuation coefficient.
The signal amplitude increases times in comparison with a single PZT element. The signal-to-noise ratio (SNR) is enhanced. The beam steering of Lamb wave is controlled well to the desired directions by near-field ultrasonic phased array theory.
Assume that damage exists at angle and distance R in the structure. The signals scan the structure in increasing angles θ and the PZT elements receive the largest reflection signal from the damage when .
By analyzing the signal in the damage direction, the distance R of the damage can be calculated as
where τ is the time of arrival of the signal in the damage direction.
In time delay equation (2), there are five parameters. They are the distance r, angle θ, PZT element number i, PZT element spacing d, and Lamb wave speed c. The PZT element number i is predefined. PZT element spacing d is related to the arrangement of the PZT sensor array. Once the arrangement is fixed, the spacing d is known. Lamb wave speed c in carbon-fiber box structure is determined by experiment. Both the distance r and the angle θ are unknown. So the time delay of the near-field ultrasonic phased array theory is not only related to the angle θ, but also related to the distance r. In the near-field ultrasonic phased array structural health monitoring implementation process, the distance r and the angle θ in equation (2) need to be controlled simultaneously. In the angle monitoring range and the distance monitoring range , the step of the angle θ is 1° and the step of the distance r is 1 mm. Every angle and distance are corresponding with a time delay. And every time delay is added to response signal to get delayed signals in different distances and in different angles. The signals at the same angle and the same distance are cumulated to get the synthetic signal in a special angle and distance. The angle where the signal of the max amplitude lies in is the polar angle of the damage, and the polar radius of the damage is calculated from the signal that damage lies in.
4. Experimental Research
4.1. Experimental System
Experiment is conducted on a carbon fiber composite wing box to verify the theoretical results. The experimental system is shown in Figure 2. Figure 2(a) is the photo of the experimental system that includes the carbon fiber composite wing box, loading device and CDLG-1 high-precision S-typed pull pressure sensor, and the experimental setup. The main material of wing box is carbon fiber-reinforced polymers (CFRP). Figure 2(b) is the schematic drawing of the wing box that gives a specific size of every part of the structure. The dimension of the structure is . One side of the structure has strengthened T-shaped stringers. There are threaded holes in the structure. The structure consists of 22 layers and the layer thickness is 0.12 mm. The upper and lower boards are interlayer plates and the ply sequence is [45°/−45°/0°/−45°/0°/45°/90°/45°/90°/−45°/0°/0°/−45°/90°/45°/90°/45°/0°/−45°/0°/−45°/45°]. The T-shaped stringer consists of 10 layers and the layer thickness is 0.12 mm. The ply sequence of the T-shaped stringer is [45°/−45°/0°/90°/0°/0°/90°/0°/−45°/45°]. The blue oval marked region in Figure 2(b) is the experimental area for near-field phased-array principle based load monitoring in structure. The load is used in the experiment to simulate the damage in the structure. Figure 2(c) is the loading device and CDLG-1 high-precision S-typed pull pressure sensor. The experimental setup includes integrated scanning system, multichannel switch, terminal block, regulated power supply, and signal generator. The integrated scanning system includes industrial personal computer, data acquisition card, and charge amplifier. Its details are described in [20]. The regulated power supply can provide the power for S-type pull pressure sensor. The experimental specimen of using near-field phased-array method to monitor the load location in the structure is shown in Figures 2(d) and 2(e). Figure 2(d) is the photo of the structure that shows the layout of the PZT sensor array in the structure. Figure 2(e) is the schematic drawing of Figure 2(d). There are 11 PZT elements in PZT sensor array, that is, arranged in linear array with 1 cm spacing. The diameter of each PZT element is 8 mm and its thickness is 0.48 mm. The coordinate system origin is set to the most left point of the PZT sensor array and the 0° direction is consistent with the alignment of the PZT sensor array. The load location in the structure is (92°, 5.8 cm) and the payload is 35 Kg.
Experiment system.
4.2. Experimental Verification and Analysis
The excitation signal is narrowband modulation sine signal. Its waveform is shown in Figure 3. The amplitude of the signal is 7 V. The central frequency is 50 KHz. The number of wave peak is 5. The time of arrival of the excitation signal is 0.064 ms.
Excitation signal.
Because of the anisotropy of composite material, the Lamb wave speed travelling in the CFRP wing box in different directions is different. The wave speed in CFRP wing box structure gotten by the experiment is shown in Figure 4.
The speed of Lamb wave in CFRP wing box.
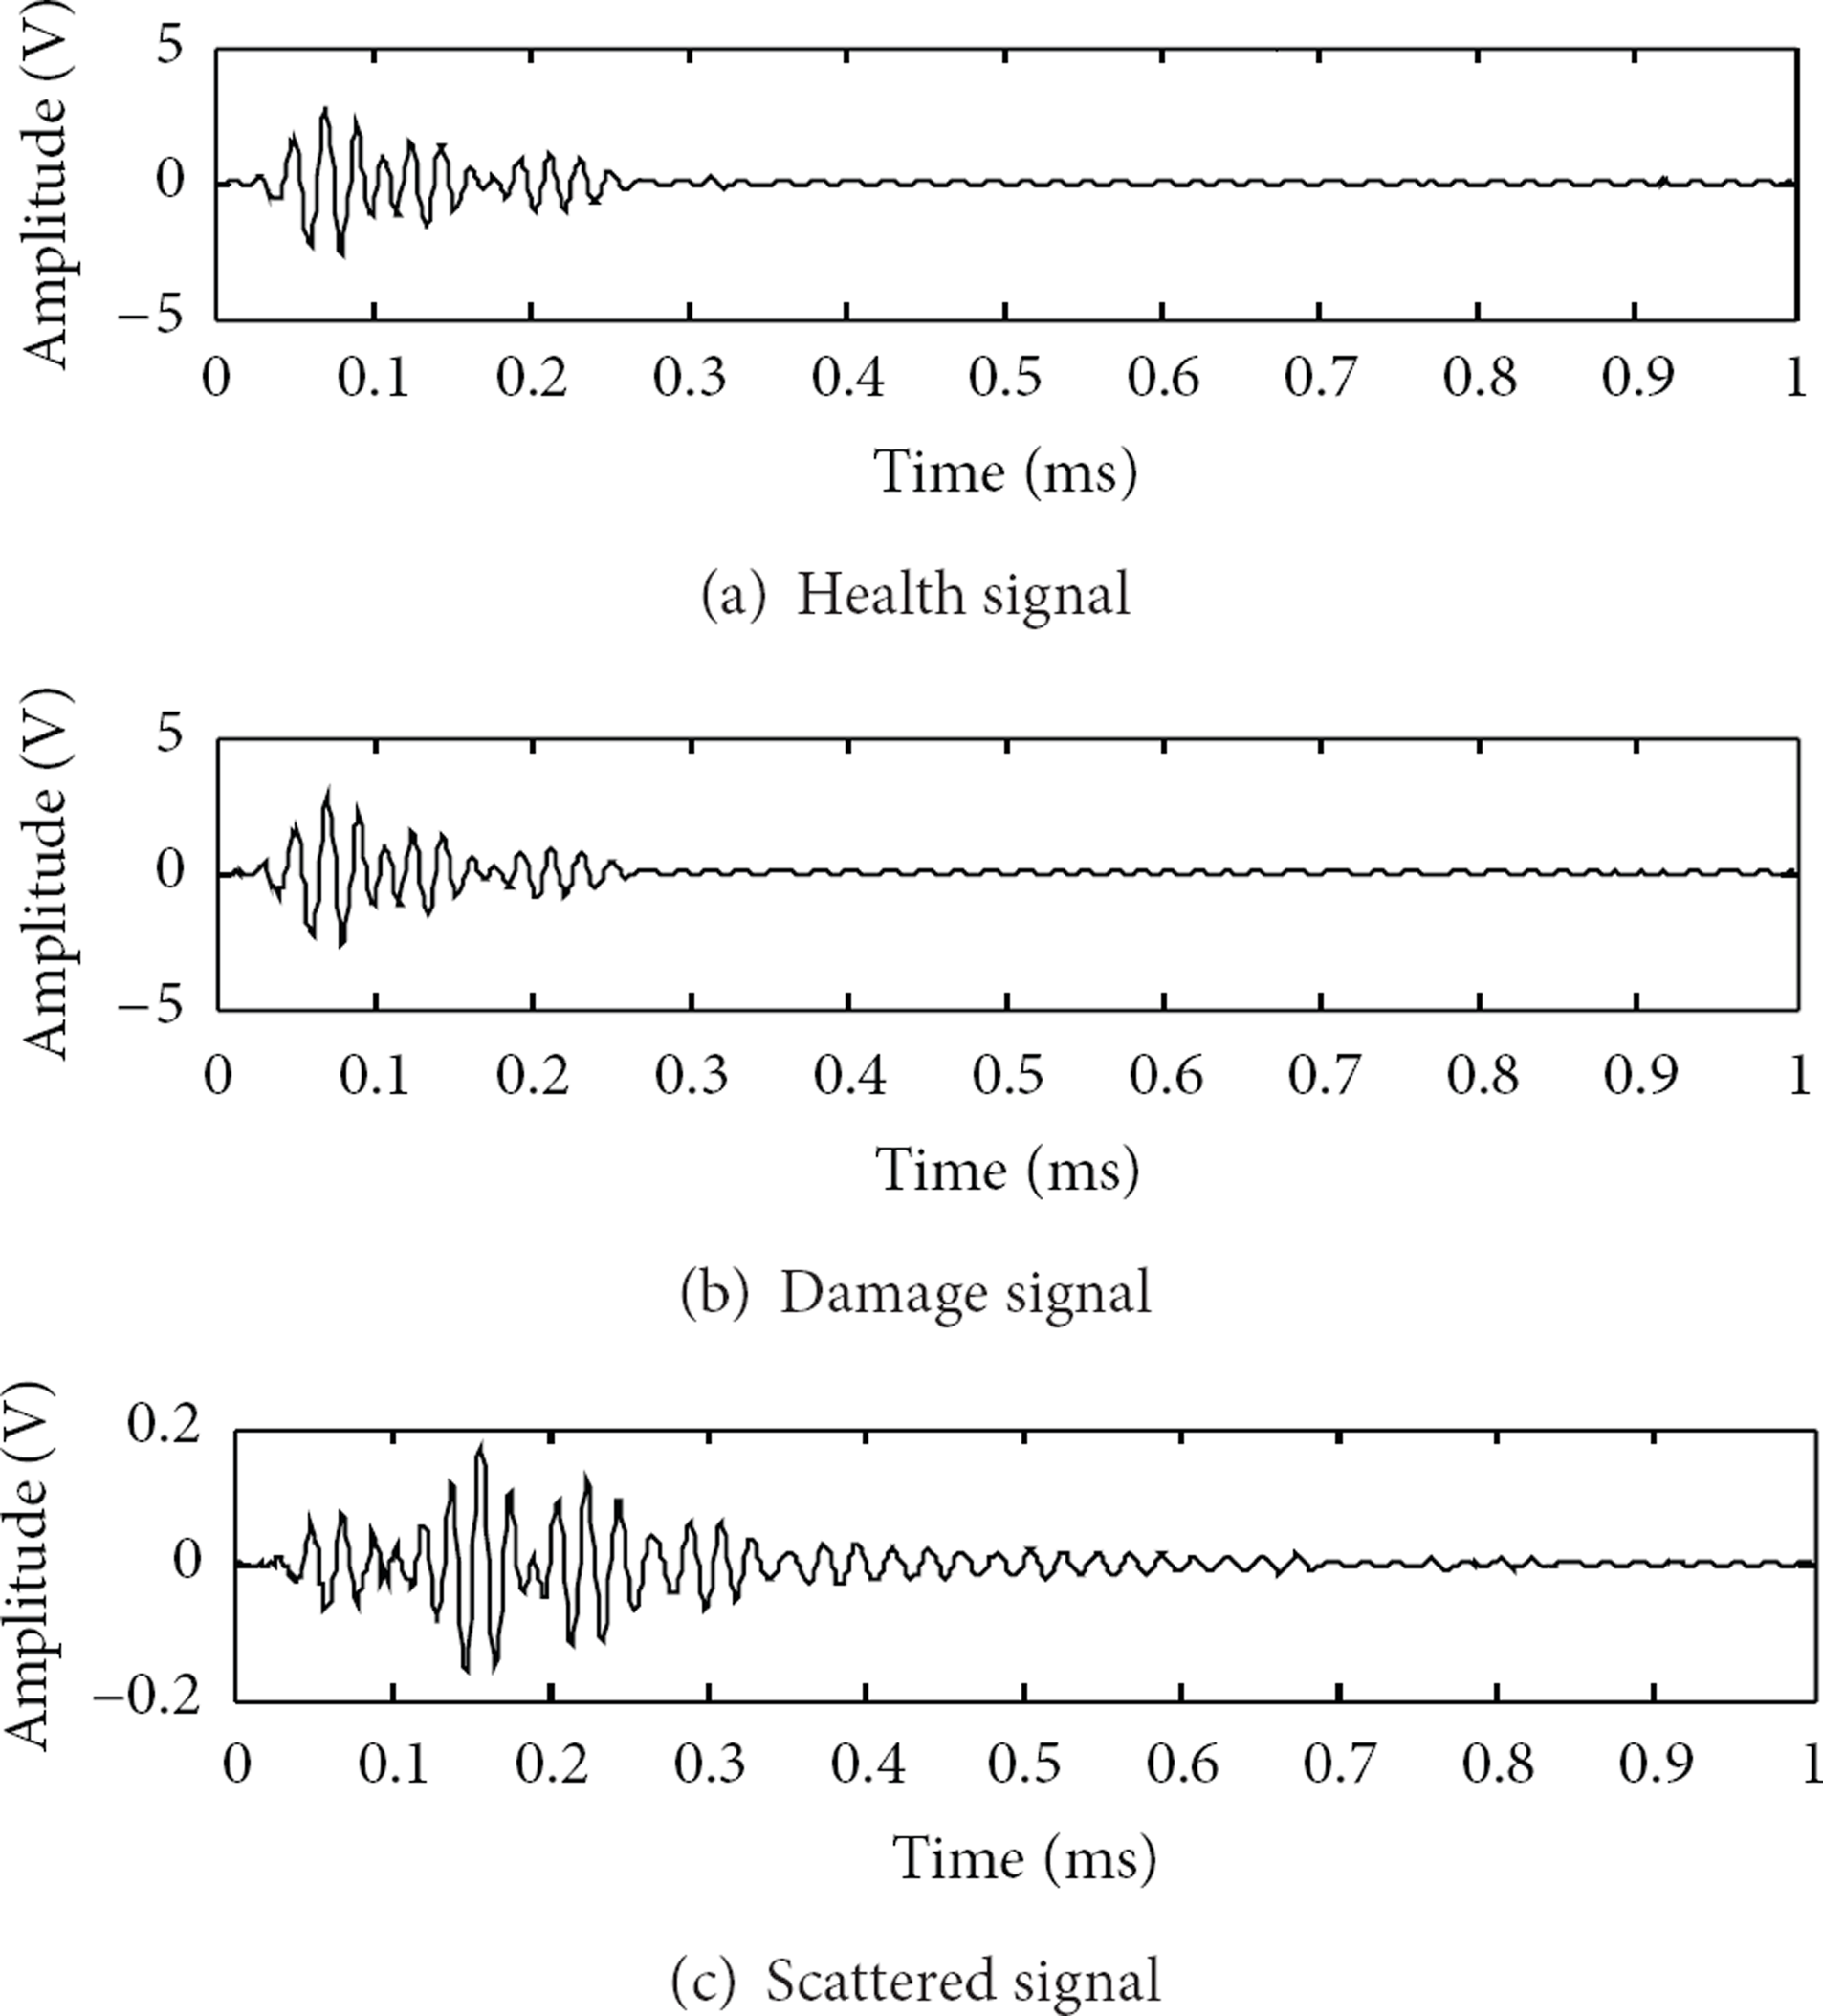
Each element in PZT sensor array can act as both transmitter and receiver because of its piezoelectric effect. The sensing signal is collected in round-robin pattern. In turns, one PZT sensor is the transmitter to generate the excitation signal and the others are receivers to collect the sensing signals. The next PZT sensor in the array becomes transmitter and the process is repeated. Thus, a total of signals are collected in each direction. Data acquisition is carried out to get the sensing signals collected in structural health state and in structural damage state, respectively. The sensing signals collected in structure health state is named health signal and the sensing signals collected in structure damage state is named damage signal. The health signal acts as a reference signal and the damage signal is compared with the reference signal to get the damage scattered signal. The sensing signals and the damage scattered signal in the angle of 0° in which the sensor 0 is actuator and the sensor 1 is receiver are shown in Figure 5. The damage scattered signals are caused by the damage in the structure. That is to say, the damage scattered signals can explain whether the structure is healthy or not. The energy of the signal caused by damage is weak and it is aliasing in other signals.
The health signal damage signal and scattered signal.
The damage scattered signals are processed with the time delay at interval of 1° in the angle and at interval of 1 mm in the distance to get delayed signals at each angle-distance. For example, the time delay in the distance of 1 mm and in the angle of 0° for actuator 0 and transducer 1 is ms which means that the signal moves to the right 0.0081 ms. The Lamb wave speed in carbon-fiber wing box in direction of 0° used in the expression is 1235.3 m/s, which is gotten from Figure 4. This time delay is added to the corresponding scattered signal (Figure 5(c)) to get the delayed signal, which is shown in Figure 6.
The delayed signal.
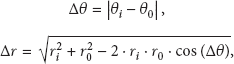
All the delayed signals at the same angle-distance are cumulated to get the synthetic signal. Figure 7 is the max amplitude of the synthetic signals at every angle-distance. The synthetic signal amplitude is compared with the max amplitude of all signals to get its relative amplitude. The angle where the signal of the max amplitude lies in is the polar angle of the damage and the polar radius of the damage is calculated from the signal that damage lies in. Figure 8 is the normalized synthetic signals in the angle where the synthetic signal with max amplitude lies in. These signals are described on distance-direction two-dimensional plane in the gray form to get a mapped image. The horizontal axis and vertical axis of the mapped image represent the horizontal and vertical coordinates of the monitoring scope. The pixel value of each point in the mapped image is corresponding to the normalized amplitude of the signal point. The mapped image of damage identification is shown in Figure 9. The monitoring scope is not a semicircle, because the experimental specimen is anisotropic CFRP. That is to say, in every direction of the structure, the signal collection points are equal, but the wave speed in different directions is different. Therefore, the monitoring distances in different angles are different. The max amplitude of the mapped image (Figure 9) is the damage location of the structure. The location of identification damage is (89°, 5.78 cm). The location of the actual damage is (92°, 5.8 cm). Their angle error is 3° and the distance error of two points between identification damage and actual damage is 0.3 cm. The angle error is the absolute difference between two angles. The distance error is calculated by the law of cosines. They are expressed as
where is the angle error, is the distance error, is the angle of identification damage location, is the angle of actual damage location, the distance of identification damage location, and is the distance of actual damage location.
The max amplitude of synthetic signals.
The synthetic signals.
The mapped image of the near-field ultrasonic phased array.
5. Summary and Conclusions
The near-field ultrasonic phased array theory based structural health monitoring is researched to overcome the limitation of the far-field ultrasonic phased array theory in monitoring scope. This method controls the beam steering by controlling the time delay of the signals to focus on the structure and to detect the damage in the structure. The proposed method is verified by the experiment on CFRP wing box. The results show that the method is effective to identify the damage position of structure. In addition, the damage in the test structure was clearly presented by the mapped image.
Footnotes
Acknowledgments
This work is supported by National Natural Science Foundation of China (Grant No. 51305211), Nanjing University of Information Science and Technology Research Start-up Foundation (Grant No. 20100385), and Industry-Academia Cooperation Innovation Fund Projects of Jiangsu Province (Grant No. 2012s028).
References
1.
LeeB. C.StaszewskiW. J.Lamb wave propagation modelling for damage detection: i. two-dimensional analysisSmart Materials and Structures2007162, article 32492592-s2.0-3394716053010.1088/0964-1726/16/2/003
2.
ZhangX. Y.YuanS. F.LiuM. L.Analytical modeling of lamb wave propagation in composite laminate bonded with piezoelectric actuator based on mindlin plate theoryJournal of Vibroengineering201214416811700
3.
LonkarK. P.JanapatiV.RoyS.ChangF. K.A Model-assisted integrated diagnostics for structural health monitoringProceedings of the 53rd AIAA/ASME/ASCE/AHS/ASC Structures, Structural Dynamics and Materials ConferenceApril 2012Honolulu, Hawaii, USA114
4.
QiuL.YuanS. F.ZhangX. Y.WangY.A time reversal focusing based impact imaging method and its evaluation on complex composite structuresSmart Materials and Structures201120102-s2.0-8005353539210.1088/0964-1726/20/10/105014105014
5.
CaiJ.ShiL.YuanS. F.ShaoZ.High spatial resolution imaging for structural health monitoring based on virtual time reversalSmart Materials and Structures20112052-s2.0-7996065278710.1088/0964-1726/20/5/055018055018
6.
De OliveiraM. A.FilhoJ. V.Structural health monitoring based on AR models and PZT sensorsIEEE Sensors Journal20121410.1109/ICSENS.2012.6411334
7.
BaptistaF. G.FilhoJ. V.InmanD. J.Sizing PZT transducers in impedance-based structural health monitoringIEEE Sensors Journal2011116140514142-s2.0-7995545050110.1109/JSEN.2010.2098865
8.
WangQ.YuanS. F.Baseline-free imaging method based on new PZT sensor arrangementsJournal of Intelligent Material Systems and Structures20092014166316732-s2.0-7034959418410.1177/1045389X09105232
9.
SunY. J.YuanS. F.WangB. F.Research on using extreme value theory to recognize damage in structural health monitoring for composite materialsChinese Journal of Astronautics2007285136613702-s2.0-40749117662
10.
American Society of Nondestructive TestingAmerican Nondestructive Testing Manual (Ultrasonic)1996Shanghai, ChinaWPC
11.
YanF.RoseJ. L.Guided wave phased array beam steering in composite platesProceedings of the Health Monitoring of Structural and Biological SystemsMarch 2007San Diego, Calif, USA2-s2.0-3564901368810.1117/12.716109
12.
MalinowskiP.WandowskiT.TrendafilovaI.OstachowiczW.A phased array-based method for damage detection and localization in thin platesStructural Health Monitoring2009815152-s2.0-5854909453310.1177/1475921708090569
13.
SrinivasanG.MahapatraD. R.ChakrabortyN.Ultrasonic guided wave characterization and damage detection in foam-core sandwich panel using PWAS and LDV8348Health Monitoring of Structural and Biological Systems2012San Diego, Calif, USA110Proceedings of SPIE10.1117/12.917598
14.
EngholmM.StepinskiT.Adaptive beamforming for array imaging of plate structures using lamb wavesIEEE Transactions on Ultrasonics, Ferroelectrics, and Frequency Control20105712271227242-s2.0-7865038368510.1109/TUFFC.2010.1745
15.
GiridharaG.RathodV. T.NaikS.Roy MahapatraD.GopalakrishnanS.Rapid localization of damage using a circular sensor array and lamb wave based triangulationMechanical Systems and Signal Processing2010248292929462-s2.0-7804941790710.1016/j.ymssp.2010.06.002
16.
PurekarA. S.PinesD. J.Damage detection in thin composite laminates using piezoelectric phased sensor arrays and guided lamb wave interrogationJournal of Intelligent Material Systems and Structures2010211099510102-s2.0-7795433657010.1177/1045389X10372003
17.
YuL. Y.BottaiS. G.GiurgiutiuV.Shear lag solution for tuning ultrasonic piezoelectric wafer active sensors with applications to lamb wave array imagingInternational Journal of Engineering Science201048108488612-s2.0-7795626572610.1016/j.ijengsci.2010.05.007
18.
GiurgiutiuV.Development and testing of high-temperature piezoelectric wafer active sensors for extreme environmentsStructural Health Monitoring2010965135252-s2.0-7795853137510.1177/1475921710365389
19.
KimD.PhilenM.Guided wave beamsteering using mfc phased arrays for structural health monitoring: analysis and experimentJournal of Intelligent Material Systems and Structures20102110101110242-s2.0-7795432182510.1177/1045389X10372816
20.
QiuL.YuanS. F.On development of a multi-channel PZT array scanning system and its evaluating application on UAV wing boxSensors and Actuators A200915122202302-s2.0-6474911448110.1016/j.sna.2009.02.032