
Abstract
An Euler-Euler two-fluid model incorporating a developed momentum transfer empirical coefficient is developed to study the particle dispersion behaviors of dense gas-particle flows in gas-fluidization reactor. In this model, the four-way couplings among gas-particles, particle-gas, and particle-particle collisions are fully considered based on kinetic theory of granular flows and an improved smooth continuous drag coefficient is utilized. Gas turbulent flow is solved by large eddy simulation. The particle fraction, the time-averaged axial particle velocity, the histogram of particle fluctuation velocity, and the wavelet analysis of pressure signals are obtained. The results are in good agreement with experimental measurements. The mean value and the variance of axial particle velocity are greater than those of radial particle velocities. Particle collision frequencies at bubble vibrant movement regions along axial direction are much higher than those of radial direction and attenuated along height increase. Low-frequency component of pressure signal indicating the bubble movement behaviors in the center of reactor is stronger than wall regions. Furthermore, the negative values represent the passed bubble and positive peak values disclose the continuous motion of single bubble.
1. Introduction
Circulating fluidized beds (CFB) have been widely applied in the chemical industry due to their practical applications, such as riser, downer, and gas-fluidized bubble bed [1]. The efficiency of systems relies primarily on their hydrodynamic behaviors, especially for particle dispersion behaviors. Thus, a better understanding of the dynamics of fluidized beds is the key problem to improve the efficiency and scale-up laboratory, which can be achieved through numerical simulation due to the rapid development of computer hardware technique. Except the traditional experimental measurement approach, the computational fluid dynamics (CFD) a powerful tool for the better understanding of physical phenomena involved in the gas-particle fluidization system [2, 3].
Generally, mathematical simulation of gas-particle bubbling fluidized bed can be divided into the Euler-Euler two-fluid model and Euler-Lagrange discrete particle model. In the Eulerian-Lagrangian approach, numerous discrete particles are tracked and interparticle collisions are simulated using a hard-sphere or a soft-sphere model. In the framework of two-fluid model, particles and gas are described as interpenetrating continua and the two sets of conservation equations for mass, momentum, and energy are numerically solved. The Eulerian-Eulerian models require closure laws for particle interactions, interaction between gas and particle phases to close the system of equations, which are generally a set of models, either physical or empirical correlations. Comparing these two approaches, due to the huge computation consumption for discrete particle model in industry application, two-fluid model has successfully applied. So far, the most popular theory for closing particle-particle collision is the kinetic theory of granular flow (KTGF), firstly proposed by Gidaspow [4, 5]. It is analogous with the kinetic theory of gases and the macroscopic behavior of particle phase is described by the equations that account for the energy associated with particles arising out of collisions and fluctuating motions of the particles. The kinetic and collision momentum transfer due to particle collisions can be modeled as a function of the local particle concentration and the fluctuating motion of the particles. Ding and Gidaspow 1990 [6] firstly proposed the concept of granular temperature to indicate particle collisions, which is defined as
Besides the effects of particle and particle collision, the other very important factor on gas-particle two-phase turbulent flow behavior is the momentum transfer process between gas and particle phases. This kind of transfer behavior can be typically represented by drag force. Due to the fact that it is difficult to get an accurate value restricted to different Reynolds numbers and packing fractions, as well as in terms of homogeneity, monodispersity, and sphericity of the particles, a large number of the gas-solid drag forces have some limitations due to empirical relations from the measurments. Although the relations by Ergun and Orning [27], Wen and Yu [28], and Giblaro et al. [29] have been the most widely used, there is at present no real consensus as to what the most accurate prediction for the drag force is at given Reynolds numbers and packing fraction. Thus, so far, all correlations are all based on experimental data. In order to assure these correlations more accurately in theory, Huilin et al. 2003 [17] introduced a weighted average two-scale switch function to prevent the discontinuous behaviors when solid volume fraction is less than 0.2. Beetstra et al. 2007 [30] proposed a drag force model based on the kinetic theory of granular flows and lattice Boltzmann data for monodisperse and bidisperse systems. Even if these corrections have successfully got better results in specified cases, they should be further validated for wide applications.
As we have known, the motion of bubbles can produce the pressure fluctuations and the amplitude of the pressure fluctuations is definitely related to the particle dispersion behaviors. Successfully, wavelet analysis approach has identified the multiscale frequency wave components for bubble upward and downward movements with different particle dispersion behaviors. Van Der Schaaf 1998 [31] demonstrated that the pressure fluctuations in a gas-solid fluidized bed could be partitioned into a fractional Brownian motion (FBM) and Gaussian white noise (GWN), caused by the jet and the formation of the small bubbles near the distributor. He et al. 1997 [32] indicated that the upward moving compression waves originate from the formation and coalesce of gas bubbles, and downward moving compression waves are caused by gas bubble eruptions at the fluidized bed surface. Lu and Li 1999 [33] found that the peak frequency of these signals can represent the bubbling frequency, and the average peak value can represent the bubble size. Although many models have been developed to describe these behaviors, a valid method to process the pressure fluctuation signals is to be further developed and validated.
To date, considering the effects of gas-particle moment transfer represented by transfer coefficient coupling KGFT theory and wavelet analysis of pressure fluctuation approaches on dense particle dispersion behaviors in bubble fluidized bed have never been reported. Compared to RANS approach using LES, the instantaneous flow information of two phases and coherent structure of particle dispersion only can be provided in detail rather than the RANS. In this study, coupled with LES, KGFT, and improved transfer coefficient model, as well as wavelet analysis approach, are used to study the particle hydrodynamics and transport characteristics.
2. Conservation Equations of Two-Phase Turbulent Flows
2.1. Governing Equations
The continuity equations, representing the mass conservation for gas and solid phases, respectively, can be written as follows:
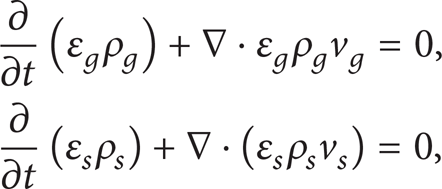
where v is the velocities, ρ is densities, and ε is the volumetric fractions of gas and solid phases, respectively. Subscript g is gas phase and s is solid phase. In relation to single-phase continuity equation, the above equations differ by the presence of the phases volumetric fractions. It is defined as follows:
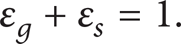
The momentum equations for gas and solid phases, respectively, can be written as follows:
In (3), P g is the thermodynamic pressure, β is the interface drag coefficient between gas phase and particle phase, τ g is the gas phase viscous stress tensor, S g, g is the gravity source term of gas phase, μ g is the dynamic viscosity and assumed to be constant and is set equal to 1.8 × 10⁻⁵, g is gravitational accelerations, I is the unit tensor, subscript lam is the laminar flow, and t is the turbulence flow.
2.2. Closure for Stress Equations
The Newtonian rheology and the Stokes hypothesis are assumed for both gas phase and particle phase; the viscous stress tensor of gas and particle phase are computed as follows:

The gas is assumed to be incompressible and has a constant density. Gas turbulent flow is solved by large eddy simulation; that is, the larger-scale eddy is directly solved by Navier-Stokes equations and the smaller-scale eddy is modeled by subgrid scale model. The traditional Smagorinsky's [34] eddy viscosity has a problem that there is an overlarge eddy viscosity dissipation at wall. In this paper, empirical corrected model presented by Yuu et al. 2000 [35] is utilized; it is as follows:

2.3. Particle Temperature Equations
The conservation equation of particle fluctuating energy or translational granular temperature is given as follows:

where k s is the conductivity coefficient of granular temperature:

The translational fluctuation energy dissipation rate is

The particle pressure is

where θ is the particle temperature and e is the restitution coefficient of particles.
The particle dynamic viscosity is simulated as follows:

where d s is the particle diameter and g0 is the radial distribution function at contact particle:

where ε s, max is the particle maximum volume fraction at random packing.
The particle bulk viscosity with the effective coefficient of restitution is computed as follows:

2.4. Momentum Transfer between Gas and Particle Phases
In order to couple the momentum transfer between gas and particle phases, a model for the drag force is required. Ergun and Orning [27], Wen and Yu [28], and Giblaro et al. [29] have presented some correlations based on the experimental results, but there still are some limitations in theory. Although Beetstra et al. 2007 [30] established a drag force model based on the kinetic theory of granular flows and lattice Boltzmann data for monodisperse and bidisperse systems, it still should be further validated for applications. In this paper, based on the Huilin et al. 2003 [17] smooth function when solid volume fraction is less than 0.2 and the McKeen and Pugsley 2003 [36] experimental results, a modified momentum transfer coefficient is presented.

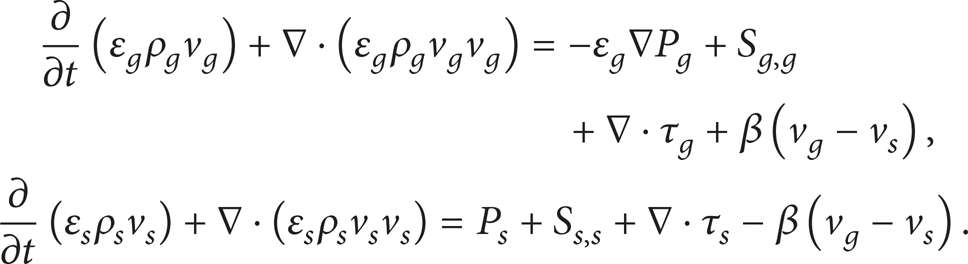
where C D is the interface drag coefficient for a single particle in an infinite medium, calculated by:
The Reynolds number Re based on the particle mean diameter d s is a function of the particle sphericity φ s :

The final sooth function is

3. Numerical Strategy, Experiments Setup and Boundary Conditions
3.1. Numerical Strategy
The aforementioned governing equations are discretized using the finite differences approach with second-order upwind scheme and solved by point relaxation technique. Continuity equations are in the form of implicit format and momentum equations are discretized over a staggered mesh. In the momentum equations, the convective terms are treated explicitly and all other terms are treated implicitly. The two-dimensional computational mesh is uniform staggered grid. Scalar quantity parameters such as the volume fraction of particles, density, and turbulent kinetic energy are stored at the main grid points. Staggered grid scheme is used and the velocity components are solved at the volume surfaces. A guessed pressure field is initialized for simulation start and the velocities are calculated from the momentum equations. The particulate phase continuity equation is solved using the updated velocities to compute the particulate phase volume fraction. The gas phase volume fraction is then computed. By using the gas volume fraction, the updated velocities the gas phase mass residue from continuity equation for gas phase is computed, which is used as a convergence criterion. For convergence, the gas pressure is corrected in each cell at a time until convergence is attained or the number of iterations exceeds an inner iteration limit (a number of iterations for one cell at a given time). The computations proceed until the entire computational domain is covered. At the end of such a computational sweep, if a pressure adjustment was necessary in any of the cells, the procedure is repeated until simultaneous convergence in all the cells is obtained.
3.2. Experimental Setup and Boundary Conditions
Experimental setup is chosen from Peltola et al. 2010 [37]. The detailed geometry dimension, gas and particle property parameters are seen in Figure 1 and Table 1, respectively. Height of initial particle packing is set equal to 110 mm. Values of the volume fractions of particles at the inlet are set to 0.4 and of initial jet velocity to 27.5 m/s. At the outlet, the pressure was set to 1 atm. Cartesian coordinate system is used with 40 cells uniform computational mesh in radial direction and 150 cells uniform in axial direction. Cell flag and characters computational cells are shown in Table 2 and Figure 2.
System geometry and properties.

Type and flag of cells.


Schematic of two-dimensional bubble gas-fluidized bed.

Computational cells.
3.3. Boundary Conditions
At the wall, no slip condition is applied, in which the gas tangential and normal velocities were set to zero, and the normal velocity of particles was also set at zero. Pressure boundary condition is set to the zero for the normal gradient of pressure at the inlet and outlet. Velocity boundary condition is to provide the superficial gas velocity at the inlet cell and used to the free slip condition at the outlet profile. For temporal integration was used a fixed time step equal to 1 × 10⁻⁵ s based on the CFL stable criteria and the simulation running time is 25 seconds. The turbulent kinetic energy and its dissipation rate are taken by empirical expressions. The fully developed flow conditions of two-phase are taken at the outlet. At the wall, no slip condition is used for gas phase velocity and gas Reynolds stress are determined via production term including the effect of wall function for near wall grid nodes.
4. Results and Discussion
In order to assure the accuracy of the simulation, the grid independence test for sensitivity of computed axial particle velocity distributions to spatial grid sizes is carried out. Here, coarse (75 × 20 axial by radial), medium (150 × 40), and fine (300 × 80) mesh grids are used in simulation process. Results indicated that the velocity distributions have similar trends along both axial directions, especially for medium and fine grids. So, we choose the medium grid size scheme for the simulations in order to achieve good accuracy within manageable computation time. In the meantime, the validation with experimental data also carried out for the statistical time-averaged axial particle velocity, which is defined by the dimensionless time between 100 and 500, is determined as the sample of instantaneous velocity and is expressed by

The simulated results of the 0.8 m height are validated by experimental data (see Figure 4). We can see that the predicted results are in good agreement with experimental results from the literature [37]. So, this model and code in this paper have been accurately validated.
Figure 3 shows the bubbles movement behaviors in bubble gas-fluidized bed at 0.5 s, 2.0 s, 4.0 s, 8.0 s, 20.0, and 25.0 s, respectively. The bubble can be defined by the instantaneous local high porosity of particles. Two kinds of bubble behaviors named the faster and the slower are identified as the halation layer around bubble, which is composed of motion circulation gas between bubble and environments. It would be affected by the bubble rising velocity. When bubble rising velocity is greater than gas gap velocity between bubble and environment, it is called the halation bubble. However, if bubble rising velocity is too fast to lead to the decrease of halation layer, the most of gas has to circulate inside bubble. When gas gap velocity is larger than bubble rising, the gas in halation layer will penetrate the bubble; it is called non halation bubble.

Validation of axial particle velocity and experimental data (h = 0.8).

Bubbles movement behaviors in bubble gas-fluidized bed.
When the higher jet gas passed through the interior reactor, the stronger interaction between gas and particle phases occurred. Then, particles located at the jet inlet position are pushed upward. Thus, the local porosity will rapidly increase and the whole system begins to form the unstable stage in the gas-particle system. Once the stable system was lost, the rapidly increasing porosity is produced. At the bottom of bubble, the flow pressure is less than other positions of bubble. It leads to drive particles around bubble entered into the inner space of bubble. Thus, bubble had to leave the jet position and begin to move toward bed top surface and to grow gradually. Result of this kind of motion and development is to produce the individual bubble. When it reaches up to the top surface of bed, it will be broken up. Becaues of motion effects of bubble, they lead to the drastic collision of particles and accelerates the mixed process of particles. So, particle dispersions gradually become vigorous and the particle dispersions of gas-particle system shows on the intensely heterogeneous. From these figures, they clearly show the formation, the movements and the breakup of the bubbles, the movement and circulation of particle flows and dispersion and the interaction of gas and particle phases. Some useful information, is higher particle temperature due to particle collisions, the higher porosity due to bubble movement and two-phase turbulent behaviors, and so forth.
Figures 5, 6, and 7 show the distributions of instantaneous concentration of particles at three different heights of 0.4 m, 0.8 m, and 1.2 m and at r/R of 0.25 and 0.73, respectively. The distribution of the computed concentration of particles shows uniformity in the bubbling fluidized bed, except for low values in the bubble burst region. The concentration of particles is high near the walls and in the center regime of the bed. It is low between the center and the walls. Near the bed surface, the concentrations of particles become low in the center of the bed. So, the uniformity and nonperiodicity are the main characters of particle dispersions.

Distributions of instantaneous particle concentrations (h = 0.4 m).

Distributions of instantaneous particle concentrations (h = 0.8 m).

Distributions of instantaneous particle concentrations (h = 1.2 m).
Figures 8, 9, and 10 show the distributions of particles velocity histogram at axial and radial directions at three different heights of 0.4 m, 0.8 m, and 1.2 m and at r/R of 0.25, 0.47, and 0.73, respectively. We can see the distributions of the mathematical expectation and the variance of particle velocity in radial and axial direction. Mathematical expectation represents the mean value of the random variables and the variance is the fluctuation intensity of random variables. At the height of 0.4 m, the mean values at axial direction are both less than radial directions with different radial positions. But the variance values at axial direction are larger than radial directions. With respect to the those of heights of 0.8 m and 1.2 m, they have the same trend compared to those of 0.4 m. As for the axial direction at the three heights, the mean and the variance at r/R of 0.47 and 0.72 and the middle of the 0.8 m have largest values, while at the bottom height of 0.4 m, they have the largest values at r/R of 0.25. As for the radial direction at three heights, the mean and the variance at all of r/R of 0.47 and 0.72 have the larger values than those of at r/R of 0.25. So, the larger particle collisions are often formed at the more uniform gas-particle fluid system.

Distributions of particle velocity histogram at axial and radial directions (h = 0.4 m).

Distributions of particle velocity histogram at axial and radial directions (h = 0.8 m).

Distributions of particle velocity histogram at axial and radial directions (h = 1.2 m).
To further understand the nonlinear particle dispersion behaviors, nonuniform and multiscale turbulent flows are very important to optimize design and operation for gas-fluidized bed. To great extents, the complexity degrees are all represented by particle concentration and pressure fluctuations. Figures 11, 12, and 13 show the distributions of the wavelet analysis of pressure fluctuations at axial and radial directions at three different heights of 0.4 m, 0.8 m, and 1.2 m and at r/R of 0.25, 0.47, and 0.73, respectively. The primary pressure signal are provided in these figures, where d (i = 1,8) stand for the detailed information of primary signals and a (i = 1,10) are the approximation of signals. Results showed that the higher frequent components gradually disappeared with increasing scale and the lower frequent components are finally lost, which indicated that wavelet analysis could be stopped at the 8th layer. Pressure drops will be affected due to the variation of particle concentration or gas velocity. In the gas particle bubble fluidized bed, pressure drop have different frequencies for time behaviors. The higher frequency is mainly caused by the particle fluctuation and the lower frequency is bubble movements. In other word particle fluctuation can be considered as the higher-faster frequent components and bubble is the lower-slower frequent components.

The wavelet analysis of pressure fluctuation (h = 0.4 m).

The wavelet analysis of pressure fluctuation (h = 0.8 m).

The wavelet analysis of pressure fluctuation (h = 1.2 m).
As seen from these figures, regarding the same radial positions at three heights, the components fluctuations at the scale of the d1, the d2, and the d3 at height of 0.4 m will last a longer time than those of at 0.8 m and 1.2 m, in which small scale with the higher frequent component is a function of time. Particle fluctuation is a kind of the higher frequency and bubble is a kind of the lower frequency. It indicated that the random particle fluctuation will be attenuated with the height increase. As for the different radial positions at the same height, the component signal at d7 is obvious, where the peak values are larger than others. In addition, larger scale shows that the lower frequency of pressure fluctuation will be changed with the time development and the higher frequency of pressure fluctuation bubble reflected the bubble movements. At near-wall region, the bubble movements in the center bed are more vigorous. The variation of peak means the alternative formation of bubble and particle movement, where negative peaks represent the bubble passing and positive peaks are the continuous passing of the single bubble.
5. Conclusions
The instantaneous and statistical particle dispersions, the nonlinear hydrodynamic characteristic, multiscale flow regions, and heterogeneous characteristics in complex dense gas-particle flow system are obtained using developed Euler-Euler two-fluid model, an improved momentum transfer empirical coefficient, and wavelet analysis methods, as well as LES for solving the gas turbulent flows, which can be considered to be a novelty research approach for this study. The most important conclusions are as follows.
Particle collision frequencies at bubble vibrant movement regions along axial direction are much higher than those of radial direction and attenuated along height increase.
Representing bubble movement, low frequency components of pressure signal in the center of reactor regions are stronger than wall regions.
In wavelet analysis results, the negative values represent the passed bubble and positive peaks are the continuous motion of single bubbles.
Footnotes
Nomenclature
Acknowledgment
The authors sincerely appreciate the financial support of Projects of National Natural Science Foundation of China under the Grant no. 20906014.