
Abstract
In order to meet the high requirements of the control strategies for an effective and accuracy control-oriented model, a mean value model for a turbocharged diesel engine has been developed on the Matlab/Simulink. And then the error sources leading to the simulation inaccuracy have been analyzed comprehensively and two sets of experiments for model calibration and validation have been designed. Then a model calibration process and a model validation process have been proposed, with which the developed model is well calibrated and validated against the two sets of experimental data. Especially, for the compressor model calibration, an improved Jensen and Kristense method has been introduced to interpolate and extend the compressor maps. And turbine efficiency observer is designed for the rectification of turbine maps. At last, the calibration and validation process and improved methods and observer for turbocharger are verified and evaluated.
1. Introduction
The growing complexity of engine control systems results in the extensive use of model-based V cycle for the control systems development. As for the engine modeling, different model complexities are created for different applications [1–3]. The mean value engine modeling approach is a widely used method by many researchers [4–6] because of, its capability of not only observing engine operating states such as pressure, temperature, mass flow, and torque but also capturing engine transient response. Importantly, its advantage of quick simulation speed that cannot be compared with by other modeling methods such as filling and emptying method or cylinder-by-cylinder method facilitates its application in control systems design.
In mean value model (MVEM), engines are assumed to work continuously and to ease simulations [6, 7]. The time scale of MVEM is often up to one engine revolution. It neglects the discrete cycle of the engine and assume that all processes and effects are spread out over the engine cycle [7]. The reciprocating behavior is captured by introducing delays between cylinder-in and cylinder-out effects [8] and fast engine process such as combustion or flow through valve is simplified using amount of empirical relationships and steady-state maps. Consequently, the heavy use of empirical formulas and steady-state maps in MVEM led to the great dependence of MVEM's accuracy on quantity of experimental data.
While the control systems development requires a much more accuracy model and lots of subparts such as EGR or VNT have been introduce to diesel engine, the model accuracy directly influences the possibility of control system development. And the calibration and validation of a fast-running MEVM with sufficient accuracy are quite important and necessary for control applications.
There are amount of publications describing control-oriented models of engines and powertrain systems for the development of different control systems; only few, however, provide information about methods for model parameters calibration, validation and the whole process which can be generalized. For example, He [9] proposed a mean value diesel engine model and approximate simulation results using design of experiments (DOE) and neural networks. Whereas no detailed calibration and validation process were proposed, just some typical simulation results were compared with experimental data and the model calibration which is the quite critical way to obtain model parameters was never mentioned. Same problems existed in [10]. As for the research of validation and calibration process, Livshiz et al. [11] considered a mean value powertrain model for engine torque control design phases and validated it under various operation conditions. However, the validation was mostly focused on the powertrain system and also no parameters calibration methods and validation process for the engine were carried out.
In particular, few of these publications about MVEM validation of diesel engine provided information about methods of turbocharger calibration. As the turbocharger introduced substantial coupling between the engine exhaust and engine intake side and both in the compressor and in the turbine, thermal effects play an important role [8]. So turbocharger model has a tremendous impact on the accuracy of MVEM. Generally, turbocharger data are measured on dedicated test benches, where all the necessary boundary conditions can be set [12] and the turbocharger data is usually obtained from suppliers. However, the problem is that surge line usually is not measured since determining surge on a test bench is a difficult task. Moreover, usually compressor characteristics at low rotational speeds are not measured because they present only a small region in the map, but the measurement is quite difficult, whereas in this small region the mass flows and pressure ratios are small, which leads to large relative errors [8]. And the operating range on the engine can always extend to this region. As for the turbine maps, it is very difficult to achieve maps from suppliers. And even if these maps are achieved, they cannot reflect the complex fluctuation of diesel engine conditions since the map's data is from dedicated test bench. So complex approaches are required for the extrapolation of compressor maps and for the improvement of turbine maps.
Usually the standard linear interpolation method is adapted, but they fail to produce reasonable results outside of region where experimental data is available and does not result in sufficient accuracy models because of the nonlinear nature of turbocharger characteristics. Several methods for map fitting are presented by [7, 12–14] based on the consideration of the nonlinear nature. However, none of them verified the accuracy of these methods in the validation of diesel engine with turbocharger. Particularly, while the fitting of turbine map is the most difficult task in modeling a turbocharger, few publications mentioned the validation of turbine map which greatly affects the accuracy of MVEM with turbocharger.
Therefore, these challenges and questions addressed above motivate my research. And this paper focuses on the calibration and validation process for MEVM of a turbocharged diesel engine, and specifically an improved method based on Jensen and Kristense method is proposed for the calibration and validation of turbocharger. First, a MEVM for a DEUTZ V-6 turbocharged diesel engine is built based on the Matlab/Simulink. Thus, through a thorough analysis of the modeling theory and model error sources, two sets of test bench experiments which are for model calibration and validation, respectively, have been designed and experimental data are achieved and processed. Second, an original MEVM calibration process is proposed, with which every submodel of the diesel engine are calibrated; importantly, an improved method is applied on the calibration of compressor maps and a turbine efficiency observer is designed as well for calibration of the turbine maps. Last, an original MEVM validation process is carried out, with which the diesel engine model without turbocharger model is validated against experimental data. And the turbocharger model is affixed with the validated diesel engine model to validate the whole MVEM and to confirm the validity of proposed calibration and validation process as well as the new methods and turbine efficiency observer. The conclusion is given in the end.
2. Model Description
The mean value model is built in this paper by using the DEUTZ V-6 turbocharged diesel engine as a prototype engine. And the Matlab/Simulink is used as the tool to build it for the sake that Simulink can connect with the HIL conveniently to estimate the control strategies online. And the diesel heating system is divided into five subsystems which are the intercooler, intake manifold, cylinder, exhaust manifold, and the turbocharger. Detailed descriptions of these submodels are given in the following section.
2.1. Intercooler Model
In order to increase the simulation speed, the intercooler is modeled as a simple steady-state model which uses the intercooler efficiency obtained from experimental data to calculate the outlet temperature of it:

where Tim is the intake manifold temperature (K) and Tc, out is the outlet temperature of compressor (K). The coolant temperature Tcoolant is the constant value of 80°C. And intercooler efficiency
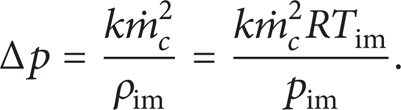
The drop pressure (2) is assumed to be a function of mass flow where k is the intercooler friction factor [2, 8] and can be obtained from experimental data. pim is the intake manifold pressure (pa) and
2.2. Intake Manifold Model
Volume change of the intake manifold has a great impact on the performance of the engine gas path; therefore, the dynamic effects of the intake manifold should be considered during modeling. As the typical temperature variations in the intake manifold model are small on an absolute scale, it is assumed that the heat transfer effects in the intake manifold are neglected and the mass flow compositions are kept constant. Then the first order differential equation (1) is derived for the intake manifold from the first law thermodynamics and the ideal gas law [8]. Moreover, the air mass flow into the cylinder (

2.3. Cylinder Model
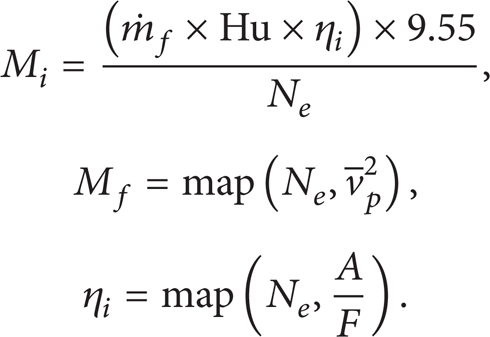
The mean indicated that torque M
i
is calculated based upon steady-state map in the following, where the friction torque M
f
is obtained on a data map based on the engine speed N
e
and the piston mean speed
And then the engine rotational dynamic model is derived from Newton's second law as follows:

where J e is the inertia of crankshaft (kg·m2) and φ is the crank angel.
2.4. Exhaust Manifold Model
The exhaust manifold model assumes that the exhaust manifold volume does not change and the gas components are maintained constant. Therefore the exhaust mass flow rate is proposed to be the summation of the fuel flow rate and air flow rate with appropriate delays. And the exhaust temperature is calculated by adding the delayed intake manifold temperature and the engine temperature rise (temperature difference between exhaust and intake manifold) and it is based on the data map related to the air-fuel ratio and engine speed. Then the pressure in the exhaust manifold is empirically determined as
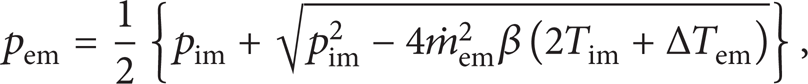
where pim is the intake manifold pressure and Tim is the intake manifold temperature. ΔTem is the temperature rise and
2.5. Turbocharger Model
The turbocharger model consists of the compressor, the turbine, and the turbocharger rotor. And the steady-state compressor mass flow data and efficiency data are obtained from the manufacturer as a map related to the turbocharger speed and pressure ratio. As the turbine data is very difficult to obtain from the manufacturer, its efficiency is fitted as a map based on the test bench experimental data.
The outlet temperature of the compressor Tc, out and the torque required to drive the compressor M c can be calculated by isentropic thermal efficiency relationships:

where the N tc is rotor speed (r/min), π c is compressor pressure ratio, ω tc is the rotor speed (rad/s), and η c is the efficiency.
The turbine torque M t that is produced by the exhaust gas can be calculated by using the isentropic efficiency as follows:

where

3. Model Calibration and Validation
In the model-based control system development, the accuracy of model has a significant impact on the application of it. As is described in Section 2, the MEVM built in this paper has proposed lots of assumptions about the engine physical processes. Moreover, this model depends on amount of experimental data, fitting formula, and steady-state maps which would impact the accuracy of the model to a certain extent. As a result, the model validation is absolutely needed to obtain a high accuracy MEVM.
In this paper, a DEUTZ V-6 diesel engine is the prototype of the MEVM, so the test bench is constituted mainly based on the DEUTZV-6 diesel engine and the NI data collection system. Then the model validation is carried out by using these experimental results from this test bench.
3.1. Analysis of Error Sources
Before the validation, the analysis of error sources which would lead to the model inaccuracy is very necessary and this will increase the efficiency of model validation. Error sources leading to model inaccuracy can be divided into four parts as follows.
Modeling Error. By considering control requirements for the model, some engine submodels and physical processes have been simplified or ignored during the modeling to improve the model computing speed, and this will decrease model accuracy. So the modeling error should be analyzed first and optimized during the validation.
Error from Fitting Maps and Empirical Formulas. As is discussed above, for the purpose to get a high computing speed, some characteristics of the engine are described by some maps from steady-state experiments. And some engine processes are illustrated with some empirical formulas. These maps and empirical formulas would lead to the model error during the simulation. So the maps and formulas should be calibrated and revised through the validation.
Coupling Resulted from Interrelated Parameters. During the cosimulation of engine and turbocharger, these submodels connect with each other, and then the output of one submodel would be the input of the next submodel, which means that the error of one submodel would have impact on the submodels connected with it. In particular, the turbocharger introduces substantial coupling between the engine exhaust and intake side, and this coupling directly influences the model accuracy.
Errors Caused by Differences in Experimental Conditions. During the experiment on the test bench, there are always some fluctuations of environment temperature and pressure as well as the coolant temperature. The model error results from these fluctuations should also be analyzed and optimized during the validation so that the MEVE with high accuracy can be achieved at last.
3.2. Design of Experiment
Firstly, based on model theory analysis and model error resources above, these parameters which need to be calibrated can be categorized as in Table 1.
Parameters for the model calibration.
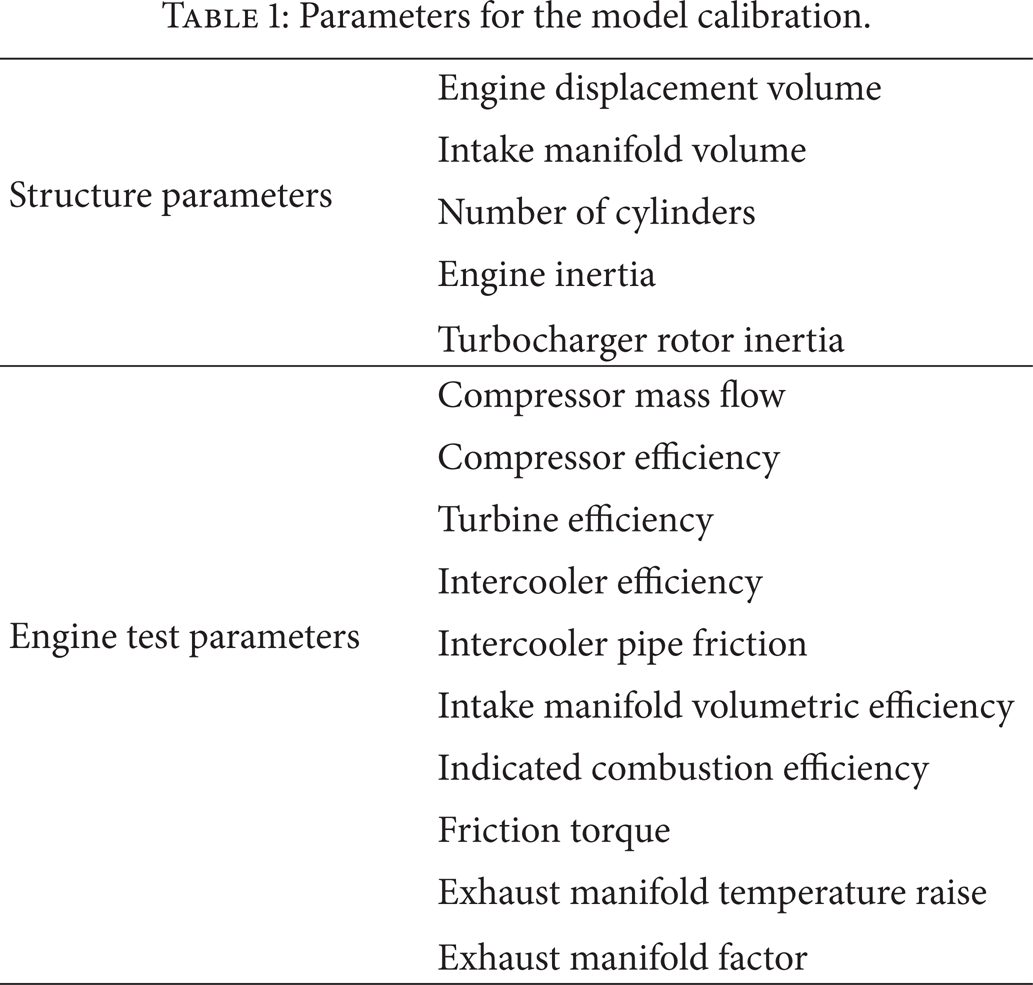
The structure parameters can be achieved from supplier or handbook easily. As for the engine test parameters, they cannot obtain directly from experimental data but need to be calculated or fitting into a factor or map from relevant experimental data. And with the model theory described in Section 2, these experimental data which are used to calibrate model parameters in Table 1 can be categorized as in Table 2.
Measurement parameters from sensors and test equipment.

Therefore, the engine test bench of DEUTZ6V1015 turbocharged diesel engine has been constructed as shown in Figure 1. This test bench is equipped with lots of sensors and some test equipments to measure those required parameters for calibration and validation in Tables 1 and 2.

Test bench of DEUTZ6V1015 diesel engine.
Then in order to calibrate and validate the plant model, two sets of engine experiment are proposed in this paper and carried out on this engine test bench. The first set of experiments is designed to obtain the data for calibration, and because an accuracy calibration of the plant model needs a comprehensive data covering a wide range of engine operating conditions, in this set of experiments, six typical engine odd speeds of 900 r/min, 1100 r/min, 1300 r/min, 1500 r/min, 1700 r/min, and 1900 r/min have been chosen, and under every speed, the data are measured from 0 Nm and once every 100 Nm until the engine full-load condition. However, the second set of experiments that is not used for calibrating the engine model is used to validate the engine model, so these measured data are from 5 typical operating conditions under even engine speeds of 1000 r/min, 1400 r/min, and 1800 r/min.
3.3. Model Calibration
Before the validation, there are lots of parameters and maps shown in Tables 1 and 2 should be calibrated using data from the first set of experiments. A calibration process has been proposed in Figure 2 based on the analysis of model error sources and the two designed experiments as well as modeling theory.

The overview of the proposed calibration process.
As shown in Figure 2, the engine model is calibrated first before the calibration of turbocharger. In every submodel of engine, the structure parameters are put into the model firstly, and then the maps such as intake manifold volumetric efficiency η v (η v = f(N e , pim)) are obtained in two steps. First,η v should be calculated at every tested operating condition using experimental data. Second, the map can be interpolated and fitting based on the calculated results. Then the other parameters in Figure 2 are calibrated in the same way. As for calibration of turbocharger, new methods are proposed and will be described in detail in following section.
3.3.1. Engine Model Calibration
First, the intake manifold model, the intercooler model, the cylinder model, and the exhaust manifold model, which are the four components of engine model, have been calibrated first. And the calibrated parameters are shown in Figure 2. During this calibration process, structure parameters come from engine manual, the maps are fitted using interpolation method, and the empirical parameters are obtained by analyzing the tendency of relevant experiment data.
3.3.2. Turbocharger Calibration
After the calibration of the engine model, these relevant maps in the turbocharger model should be interpolated and extended.
The turbocharger model is a very crucial component of an overall MEVM; however, as for the control-oriented modeling approach of diesel engine, the very reasonable and effective modeling theory for the turbocharger is rare since this is both a very challenging problem and a crucial part of the overall engine model.
Compressor Calibration. Generally, as for the compressor, the characteristics data from suppliers are typically only mapped for higher ratio speeds and pressure ratios because characteristics at lower speed represent only a small region in the compressor map, and measurement is difficult. But the operating range on the engine extends down to a lower ratio speed and pressure ratio; therefore, it would lead to large relative errors. Furthermore, heat flow from the turbine to the compressor becomes substantial in comparison to the enthalpy flow of the fluids, resulting in substantial deviations of the efficiency calculated. However, what looks like a small region in the compressor map is very relevant when the turbocharged diesel engine is simulated. So the prolongation and extension of the compressor maps are needed in the calibration of the compressor model.
By considering the nonlinear characteristics of turbocharger, I proposed a improve method based on the Jensen and Kristense fitting method which is described in [12].
In the Jensen and Kristense method, the dimensionless head parameters Ψ and Φ are used to stand for the mass low and compressor efficiency in

where U c is the compressor blade tip speed, U c = d c N tc π/60.
And then I improved this method by expressing the head parameter Ψ and compressor efficiency η c using rational polynomial fitting in (11) which can be more precise than Jensen and Kristense method to predict the relation between Φ and Ψ as well as η c

In (11), α i (i = 1 ~ 4) and β i (i = 1 ~ 4) relate to the compressor speed. So the inlet Mach number Ma can be introduced to stand for the compressor speed. And the least square method is used here to fit the parameters α i and β i shown in

The curve fitting results of compressor mass flow and efficiency are shown in Figures 3(a) and 3(b), where the symbols in the curves are original data from the supplier.

Comparison of curve fitting results and original data from suppliers. (a) Compressor mass Flow and (b) compressor efficiency.
Turbine Calibration. Although the compressor characteristic data can be achieved from the supplier, the characteristic data for the turbine is difficult to obtain from the supplier.
In general, the turbine efficiency characteristic curve can be drawn through the converted mass flow rate and the turbo speed; namely,

And then the achieved map of the turbine efficiency is shown in Figure 4.

Turbine efficiency curve calculated depends on the power balance between compressor and turbine.
And then with data from the first set of experiment, the model has been calibrated; however, the calibration result has not been verified; moreover, the simulation result is not evaluated yet. So in the next section, the model calibration result will be verified using the first set of experiment data, and then the model accuracy will be validated with the second set of experiment data.
3.4. Model Validation
After the model calibration, for the purpose to validate and verify the model, a validation process is proposed and is shown in Figure 5.

The overview of the proposed validation process scheme.
During the validation, the MEVM has been divided into two parts: engine model and turbocharger model. And the engine model without turbocharger is validated first. And during this stage, the submodes are validated one by one by considering the model coupling. For example, the boundary inputs from compressor are set with experimental data, and then intercooler model is validated against the first set of experiments to verify the calibration results; after that, the second set of experimental data are used to validate this part of submodel. Then the intake manifold model is affixed and is validated as the same way of intercooler model. Then the following submodels are validated one by one. After finishing the validation of engine model, the turbocharger is affixed and the turbine map is improved with the turbine efficiency observer; therefore, the validation of the whole MEVM with turbocharger is validated.
3.4.1. Engine Model Validation
The intercooler model is validated first, and in order to make sure that the error of the turbocharger will not impact the validation of intake manifold, the compressor mass flow rate and the outlet temperature of compressor which are boundary values of intercooler model from turbocharger are replaced by the experimental data from the first set of experiment.
First, in order to evaluate the intercooler model calibration, the first set of experiment data has been used here, which means that the simulation result of intercooler inlet pressure that is the boundary output parameter of this model is compared to its experiment result obtained from the first set of experiment. And the comparison result is shown in Figure 6. If the intercooler model performance is matching test data within 3%, then it can be concluded that the calibration for this part of model is reasonable, if not, then the model and the calibration should be adjusted to decrease the model error.

Intercooler inlet pressure comparison of simulation results and experimental measurements from the first set of experiments.
The mean error of intake manifold pressure is 1.167%, which indicates that the parameters calibration of intercooler model is acceptable and errors from fitting map, empirical formulas, and experiment conditions are in an acceptable range. Also, the modeling theory used here is reasonable.
After this, the intercooler model should be validated and verified. So the simulation result of intercooler inlet pressure is compared with the experiment data from the second set of experiments to verify whether the model accuracy is acceptable. The comparison result is shown in Figure 7. And if the error is within 5%, then it can be concluded that the intercooler model is validated and the accuracy is acceptable and if not, then this part of model should be validated again to make sure that the error would be acceptable at last.

Intercooler inlet pressure comparison of simulation results and experimental measurements from the second set of experiments.
It is shown in Figure 7 that the error of the simulation result and the measurement result is within 4%, and then it can be concluded that the accuracy of intake manifold model can meet the accuracy requirements of the control-oriented model.
After finishing the validation of intercooler inlet model, the intake manifold model has been added to connect with the accurate intercooler model. And the validation of next submodels is similar with the method of validating the intercooler model. The experiment result of intake manifold pressure from the first set of experiments is compared with the simulation result, and the intake manifold model performance is matching test data within 3% which is acceptable; therefore the simulation result of intake manifold pressure is compared with the test data from the second set of experiment. And the comparison result is shown in Figure 8.

Intake manifold pressure comparison of simulation results and experimental measurements from the second set of experiments.
It can be concluded from Figure 8 that the intake manifold model performance is matching test data within 5%, which can meet the accuracy requirements of the control-oriented model.
With the similar way described above, the cylinder model and the exhaust manifold model have been validated with the first set and the second set of experiment data, respectively. And the important output results of these two parts of engine model—the air-fuel ratio A/F, the exhaust manifold pressure pem, and the temperature Tem are compared with test data, respectively. The error from calibration is listed in Table 3. And then the comparison result of the simulation and the experiment value from the second set of experiments are shown in Figure 9.
Calibration error analysis for cylinder model and exhaust manifold model.

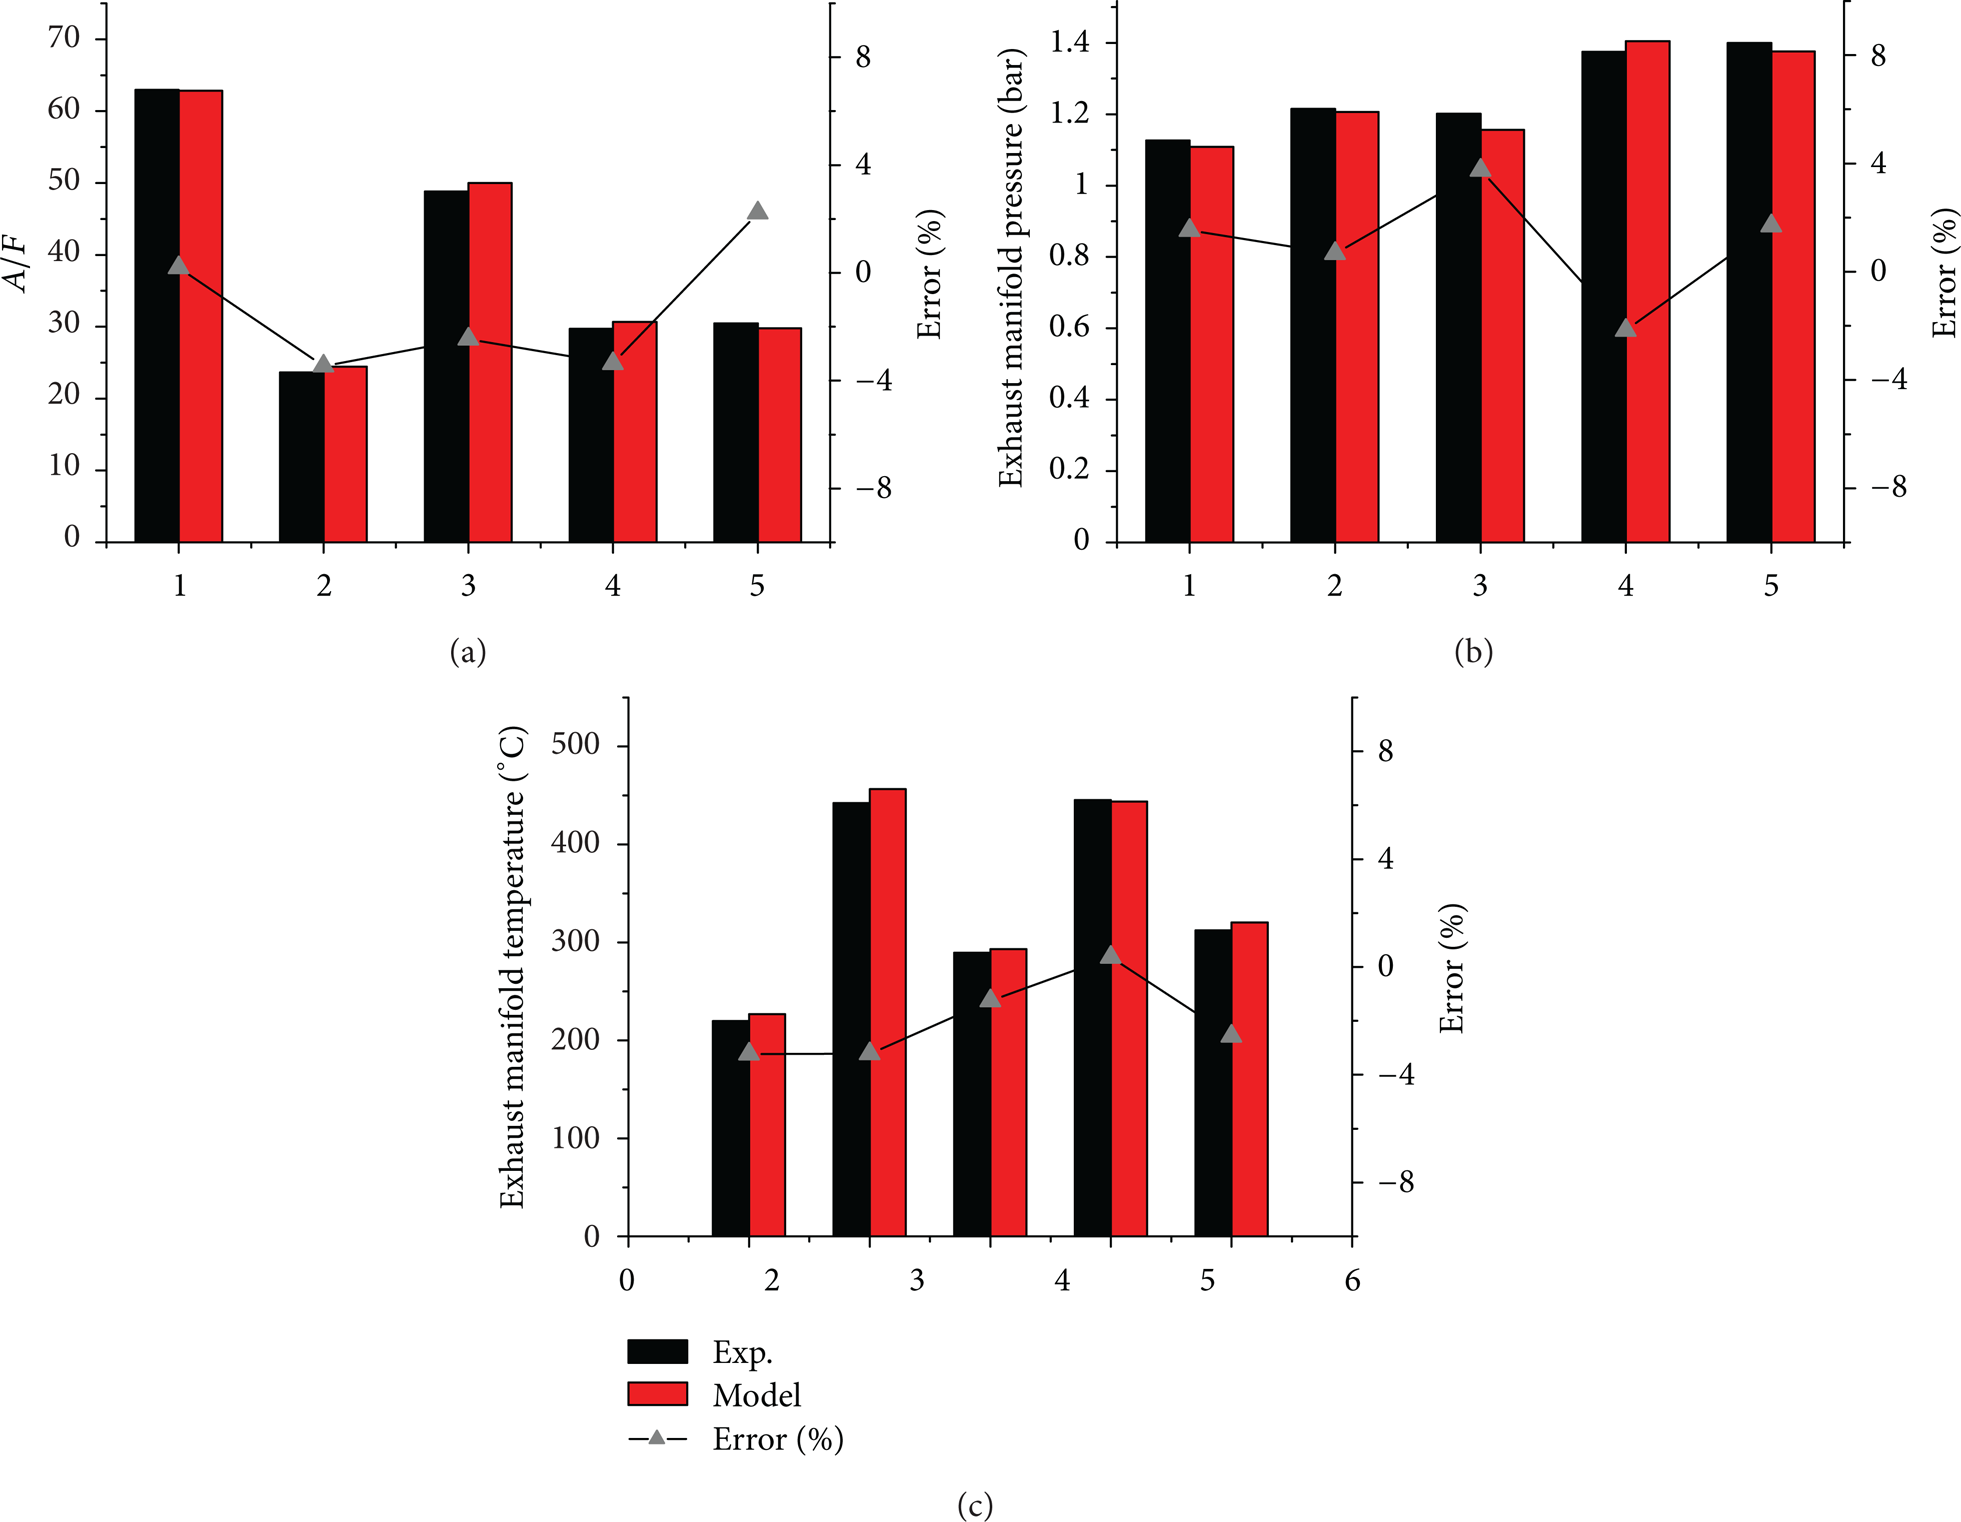
Comparison result of simulation results and experimental measurements from the second set of experiments: (a) air-fuel ratio, (b) exhaust manifold pressure, and (c) exhaust manifold temperature.
The experimental verification results in Figure 9 show that the proposed engine model without the turbocharger model is consistent with the actual measurements.
And then after finishing the validation of these four parts of engine model, the turbocharger model is added to the engine model, so the turbocharger model will be validated and verified in the following section with the experiment data to make sure that the accuracy of the complete mean value model for a turbocharged diesel engine can meet the requirements of control-oriented model.
3.4.2. Turbocharger Model Validation
As is described above, the compressor mass flow and compressor efficiency are obtained by prolonging and extending the steady-state maps provided by compressor supplier. However, because the turbine efficiency map cannot be achieved from the supplier, the turbine efficiency is calculated depending on the characteristic that the power produced by turbine is equal to the power consumed by the compressor (13). But the turbine efficiency is not accurate here. So during the turbocharger model validation, it is assumed that these two maps in the compressor are reasonable and its accuracy is acceptable. And the intake manifold pressure and the air-fuel ration which are typical parameters of this model are chosen to validate the turbocharger model. If the simulation resultsdo not correspond well with the experiment data, then the turbine efficiency map would be amended to decrease the error.
Here an analysis for the influence of turbine efficiency error on the model simulation results is carried out and the result shows that turbine efficiency change of 5% would cause widely irregular fluctuations on the intake manifold pressure. So it can be concluded that the high accuracy of turbine efficiency has great influence on the simulation result of the mean value model. In addition, the match of turbocharger and engine would lead to the model simulation error. As a result, the amendment for the turbine efficiency curve map shown in Figure 4 is very necessary to keep the error of the model within a reasonable range.
So in order to improve the turbine efficiency map, an observer is proposed based on the preceding model. As is mentioned above, the turbine efficiency cannot be tested on the experimental bench. However, the compressor mass flow can be tested on the experimental bench, so the compressor mass flow from the test bench is picked up as a real signal from the engine system, and then the observer is a model to calculate the simulation result of the compressor mass flow, and the input parameters are all from the experimental data; in addition, the interior structure of the observer is built depending on the physical principal which is described above. As shown in Figure 10, the output of the observer is the compressor mass flow, and the error of the compressor real mass flow from the experimental data of the diesel engine and the simulation result from the observer will be feedback to the observer to adjust the turbine efficiency in the observer, so that the error can be decreased to zero. At last, the turbine efficiency which is amended will be obtained.
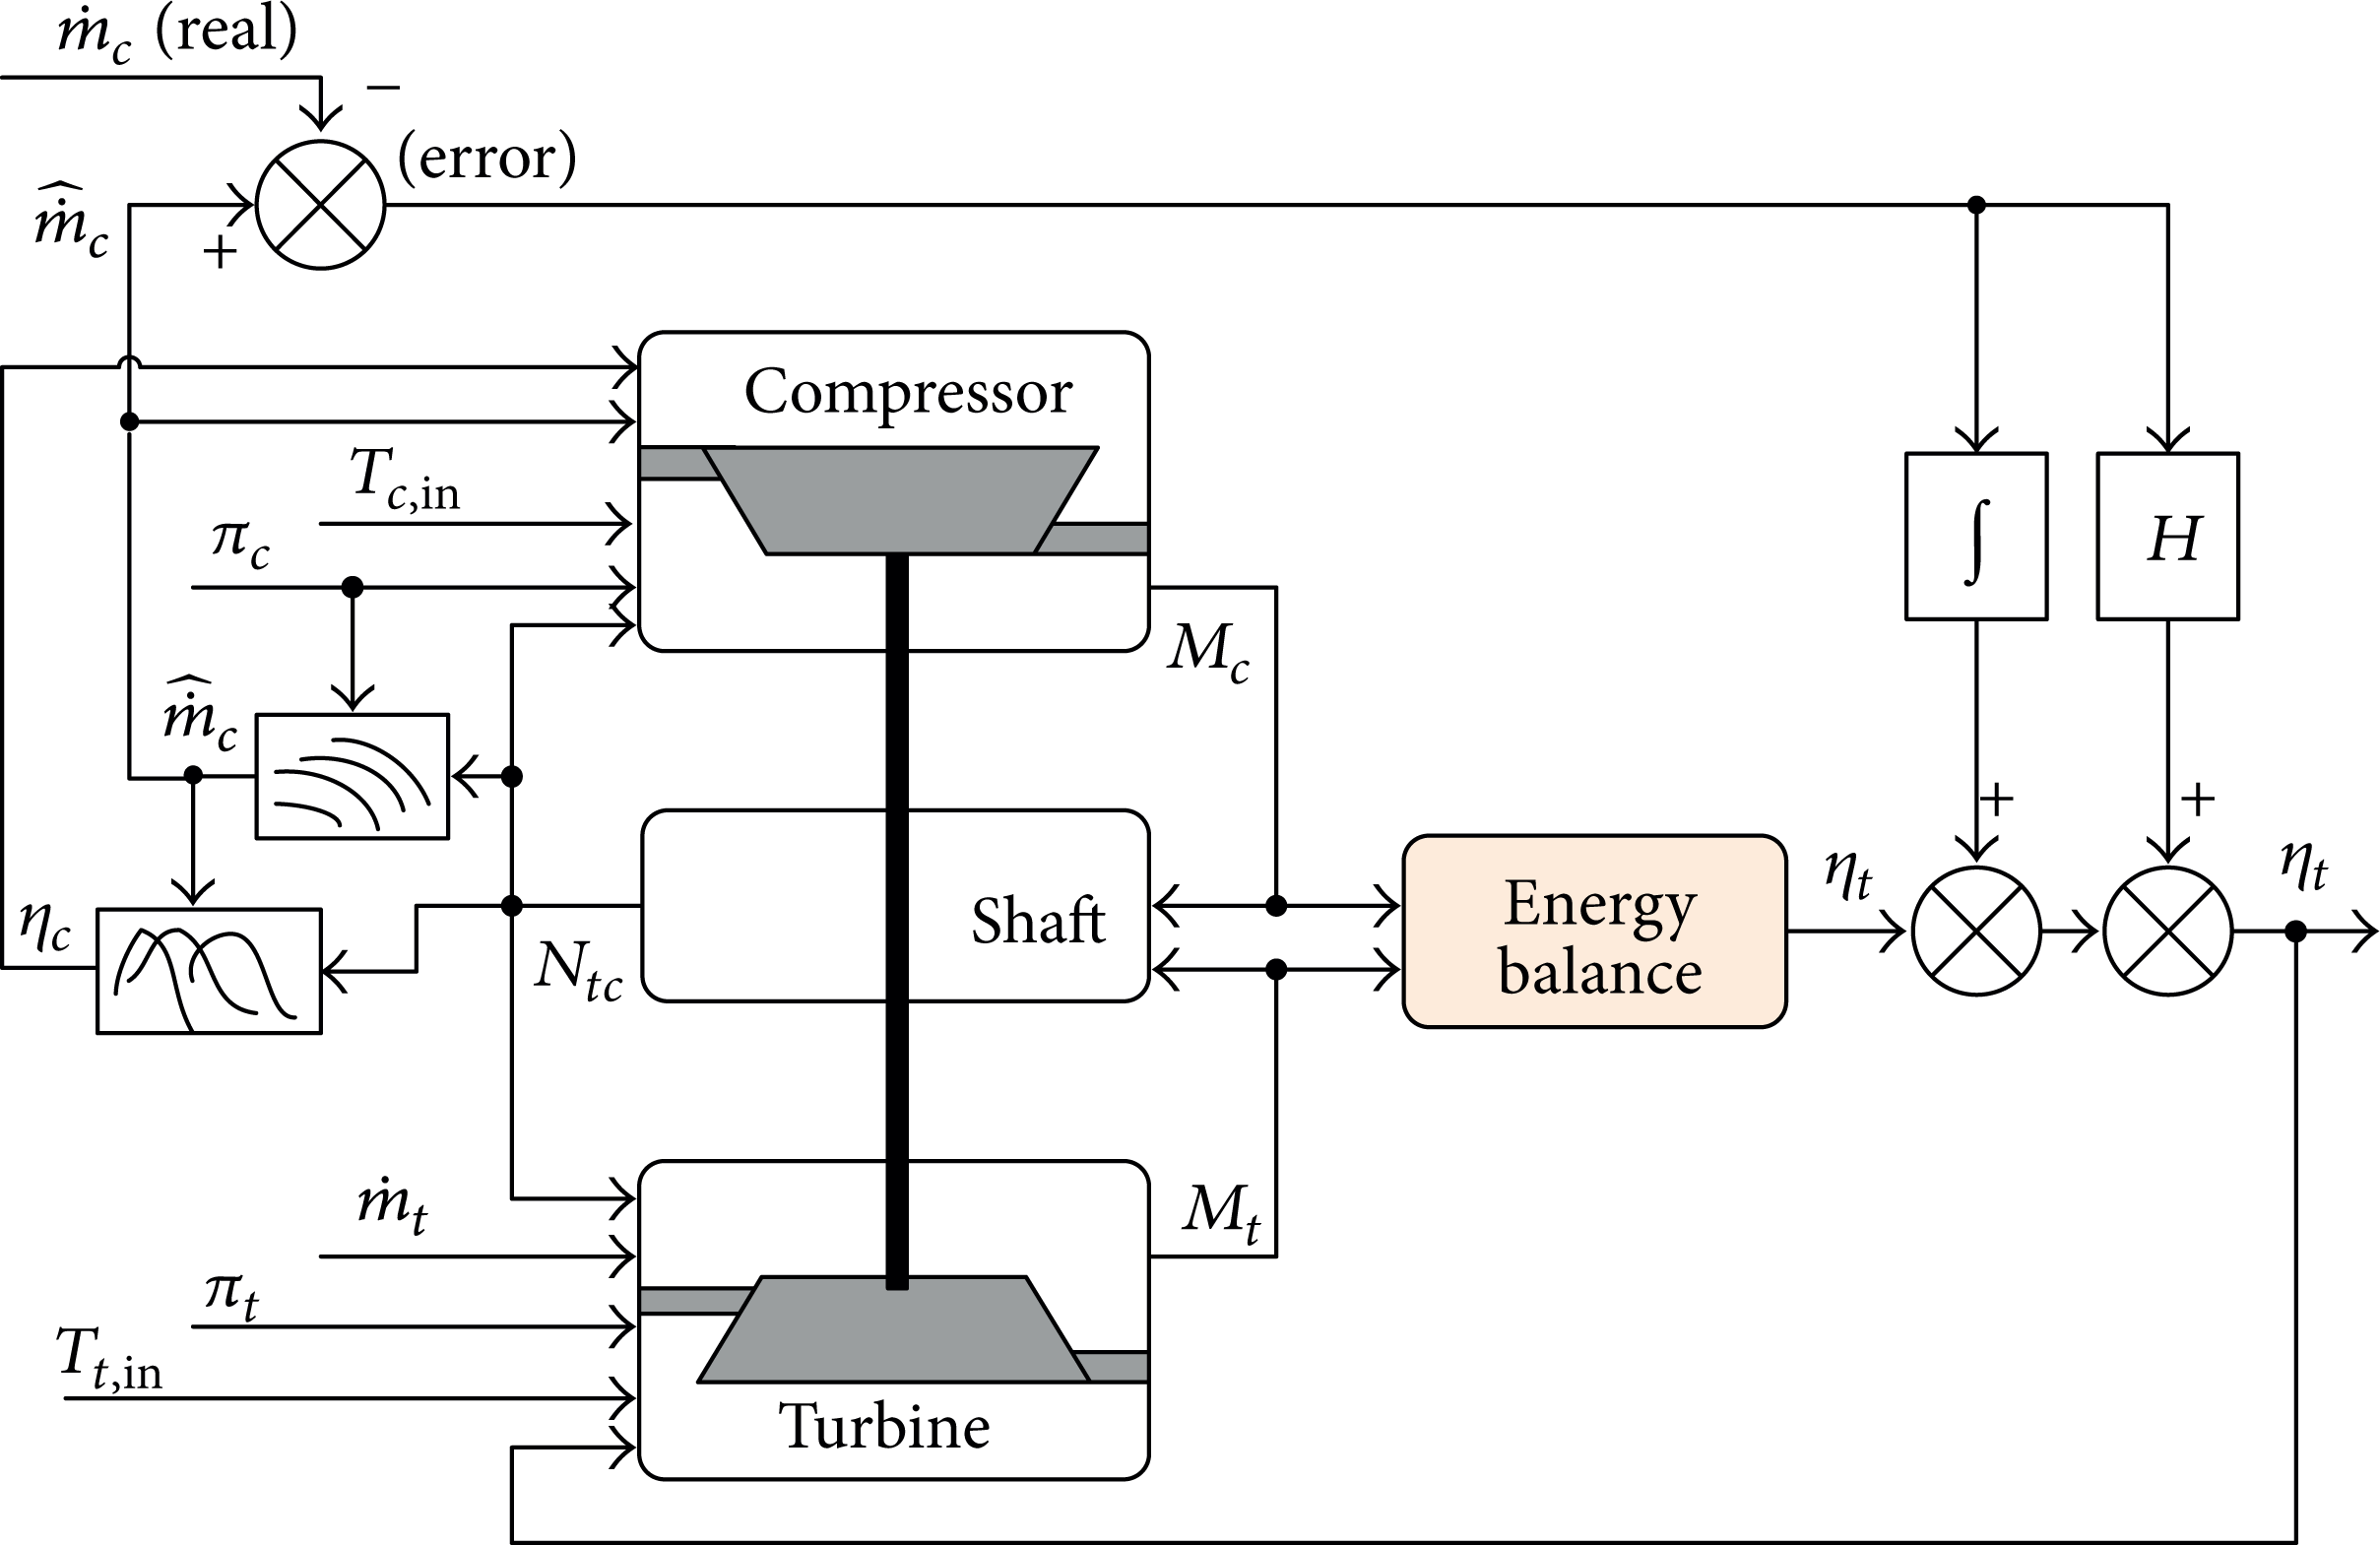
The inner structure of turbine efficiency observer.
With the turbine efficiency observer, the accuracy of the MEVE with the turbocharger greatly increases, for example, after the efficiency map is improved, and the error of intake manifold pressure is reduced from 12.31% to 4.3%.
After finishing the validation of engine model and the turbocharger model, an estimation for the accuracy of the co-simulation of engine model and turbocharger model is operated to evaluate the advantages of this method used in the validation of the mean value model. And the co-simulation results of intake manifold pressure and air-fuel ratio which are the very important parameters of the MEVM are carried out to compare with the experimental data. And the results are shown in Figure 11.

Comparison of cosimulation results with experimental data from the second set of experiments: (a) intake manifold pressure and (b) air-fuel ratio.
As shown in Figure 11, the intake manifold pressure and air-fuel ratio cosimulation results from the proposed model are consistent with the actual measurement results, and the maximum errors of pressure and air-fuel ratio are separately below 4.142% and 4.341%. This comparison result indicates that the methods used to validate the mean value model are available and the accuracy of the mean value diesel engine model can meet the control requirements.
4. Conclusions
In this study, a control-oriented MEVM for the turbocharged diesel engine is developed to be used in the model-based control system development. And then in order to increase the accuracy of this proposed model, the experiment for calibration and validation has been designed based on model theory and error sources analysis.
A calibration process and a validation process for a turbocharged MEVM are originally carried out, with which the proposed model is well validated against two sets of experimental data over wide engine operating conditions.
For the calibration and validation of turbocharger model, an improved method based on Jensen and Kristense method, but more reasonable and effective has been proposed to interpolate and extend the compressor mass flow curve and efficiency curve. More important, a turbine efficiency observer is proposed based on the experimental data from the test bench. And this observer greatly increased the MVEM accuracy.
Experimental verification results show that observer-based mean value model simulation results are consistent with the actual measurements within 5%. And the proposed model calibration and validation processes are verified and they enable further automation of model-based development.
Conflict of Interests
The authors declare that there is no conflict of interests regarding the publication of the paper.
Footnotes
Acknowledgments
The authors are thankful for the support of National Natural Science Foundation of China under Grant no. 50975026 and National Ministry Fundamental Foundation of China under D2220112901.