
Abstract
Mixed mode brittle fractures are very common failure behavior for cracked brittle materials under loading, and therefore, the prediction of the mixed mode brittle fractures is significant. In this paper, the authors attempt to make a detailed discussion on the applicability of several widely accepted fracture criteria to some brittle materials. By employing these criteria, several groups of experimental results of mixed mode brittle fractures were analyzed, and the applicability of each fracture criterion to some tested materials was also examined. The results show that many of the widely applied fracture criteria can provide a good estimation for predominately mode I fractures, but none of them can well predict predominately mode II fractures. Finally, the reasons of the failed prediction by these criteria were investigated, and several significant conclusions were presented.
1. Introduction
Fracture mechanics has been widely applied to many engineering fields, such as pressure piping design, hydraulic fracturing design in shale gas mining, and building/mechanical structural engineering, and the fractures in these structures usually happen in a I-II mixed mode brittle manner, which will undermine the structural stability significantly and could cause large accidents. Hence, it is necessary to have an effective fracture criterion which can predict both crack initiation and crack propagation under mixed mode loading conditions. In the past decades, several criteria were proposed to investigate the mixed mode fracture phenomena, for example, maximum tangential stress criterion (MTS criterion, σθ criterion) [1], minimum strain energy density criterion (MSED criterion, SED criterion, Smin criterion) [2], maximum energy release rate criterion (MERR criterion, Gmax criterion) [3–7], maximum dilatational strain energy density criterion (NT criterion) [8], and distortional strain energy density criterion (Y criterion) [9]. Generally, these criteria used a singular stress field, and the singular stresses around a crack tip are presumed to be distributed in a manner that is independent of the applied load or the geometry of the structure. For plane problems, these singular stresses around a crack tip in Cartesian coordinates can be expressed as

where r and θ are the polar coordinates with origin at the crack tip, ν is Poisson's ratio, and KI and KII are mode I and mode II stress intensity factors, respectively. It is obvious that the stress will surpass an elastic limit as r tends towards zero, and accordingly, a core region will occur around a crack tip for some kinds of materials. When the above criteria were applied to brittle materials, the core region was always regarded as a circle with a constant radius “r0”; then, a variable related to KI and KII was employed to determine the initiation angle θ0 and the fracture load. In addition, many mixed mode brittle fracture experiments were also conducted to investigate the mixed mode brittle fracture mechanisms by employing various brittle materials (e.g., PMMA [10], rock masses [11–14], asphalt concrete [15], ultrahigh strength steel and nodular cast iron/multi-rare-earth [16], epoxy/multiwalled carbon nanotube nanocomposites [17], and so on). However, it seems that the reviewed fracture criteria have limited applications to the above test results [10–17] although some criteria can well predict the mixed mode fractures for some specified materials. In this paper, some preexisting mixed mode fracture tests were analyzed, and the test results were compared with the results predicted by the preexisting criteria, and the applicability of each criterion to the tested materials was also investigated.
2. Review of the Preexisting Criteria
Currently, there are many fracture criteria which could be applied in predicting material fracture behavior, and here some of the widely accepted criteria for brittle materials will be reviewed in the following.
2.1. MTS Criterion
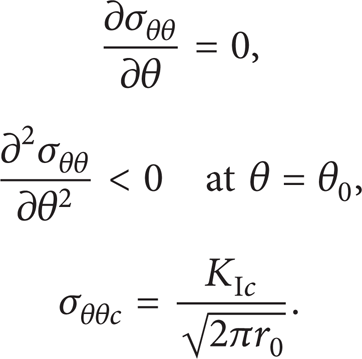
The MTS criterion formulated by Erdogan and Sih (1963) [1] assumes that a crack extends in the direction of the maximum tangential stress, and propagation will happen as this maximum stress reaches a critical value; that is,
2.2. MSED Criterion (S Criterion, SED Criterion)
Sih [2] gave the specific strain energy density factor S at the radius r0 in terms of the energy as follows:

where
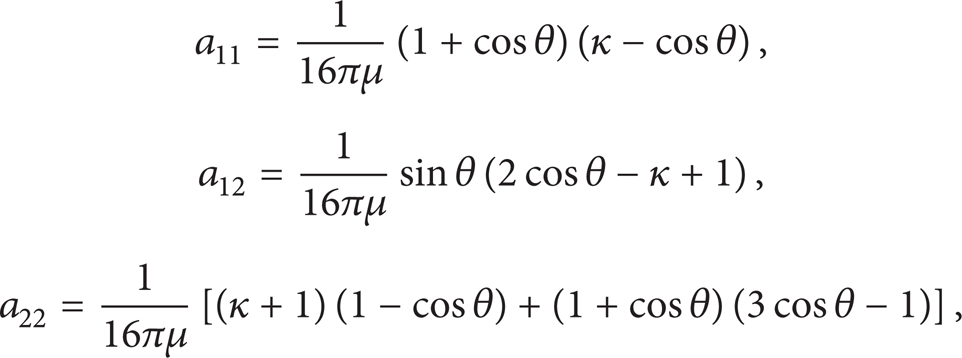
and μ is modulus of rigidity, κ = 3 – 4ν for plane strain problem, and κ = (3 – ν)/(1 + ν) for plane stress case. The MSED criterion postulates that a crack initiates in the direction of minimum strain energy density along a constant radius around the crack tip when S reaches a critical value, S c ; that is,

2.3. MERR Criterion (G Criterion)
This criterion has been expressed in several different forms [4–7], and only the expressions presented by Hussain et al. [4] will be reviewed here. The energy release rate (where the length of the branch crack tends to zero) is given as

where E is Young's modulus. According to the assumptions made by Palaniswamy and Knauss [3], crack extension will occur in the direction of the maximum release rate of elastic energy, and it will happen once the rate exceeds a critical value; that is

where G c is the critical energy release rate.
2.4. NT Criterion
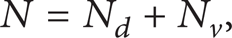
In NT criterion [8], the total strain energy density N (equivalent to S in (3)) was split into the dilatational strain energy density N v and the distortional strain energy density N d ; that is,
where

where σ y is the material yield strength. NT criterion postulated that a crack propagates in the direction of maximum dilatational strain energy Nv, max along the contour of constant distortional strain energy Nd, 0 when the distance from crack tip to the elastic-plastic boundary r p in the growth direction reaches a critical value r pcr ; that is,

where r pcr = KIc2/(2πσ y 2) for plane stress case and r pcr = (1 – 2ν)2KIc2/(2πσ y 2) for plane strain.
2.5. Y Criterion
Y criterion [9] also divided the total strain energy density into two components, the dilatational strain energy density Y v and the distortional strain energy density Y d as

Y criterion presumes that a crack grows in the direction of minimum distortional strain energy density along the constant distance core region boundary r0 when the minimum distortional strain energy density Yd, θ0 reaches a critical value Yd, 0, and it can be expressed as

where r0 = KIc2/(2πσ y 2) for plane stress case and r0 = (1 – 2ν)2KIc2/(2πσ y 2) for plane strain.
3. Initiation Angle Predictions by the Reviewed Fracture Criteria
3.1. Influence of Poisson's Ratio on Initiation Angle Prediction
In fracture mechanics, it is an important task to predict the initiation angle. From the reviewed criteria, it has been found that Poisson's ratio ν is only involved in MSED criterion, NT criterion, and Y criterion when they are applied to predicting the initiation angle for the case of plane strain. For plane stress case, except for MSED criterion, all other criteria did not consider any material parameters. In MTS criterion and MERR criterion, no material parameter is involved for both cases of plane stress and plane strain. In this section, the authors attempt to have an investigation on the influence of Poisson's ratio on the initiation angle predicted by some criteria.
For convenience, the mode mixity is expressed in terms of the parameter M e which is defined as
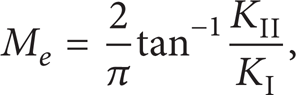
where M e = 0 for pure mode I and M e = 1 for pure mode II. All the prediction results and test results were presented in Figure 1. It can be seen that MSED criterion is sensitive to Poisson's ratio and a large Poisson's ratio always results in a large predicted initiation angle. Generally, the initiation angles predicted by MSED criterion under plane strain condition are greater than those predicted under plane stress condition for the same value of Poisson's ratio. For NT criterion, no obvious differences were observed in Figure 1(c) for different values of Poisson's ratio and different plane deformation conditions (plane stress and plane strain conditions). Therefore, the initiation angle estimated by NT criterion is indeed independent of all the materials parameters. For Y criterion, a slight increase with Poisson's ratio can be found in Figure 1(d).

The effect of Poisson's ratio on the initiation angle predicted by several criteria.
3.2. Applicability of Initiation Angle Prediction
By employing the reviewed fracture criteria, the initiation angles obtained by Williams and Ewing [18] and Ayatollahi et al. [19] were recalculated, and the comparison results were also presented in Figure 2. In [18], a series of mixed mode fracture tests on PMMA sheet specimens with 0.125 inch nominal thickness under plane stress condition were conducted. The specimens were 6 inches in width and 12 inches in length. The initial cracks were finally formed with a 0.01 inch wide slitting saw. The tests were performed at 0.2 inch/min displacement rate, 20°C in temperature, and 50% relative humidity. The fracture angle was measured using a projection microscope with a 25 × 25 magnification. The test results and the prediction results by the reviewed criteria are shown in Figure 2. It can be seen that, for the predominated mode II cracks, the measured initiation angles vary in a large scale and the initiation angle of pure mode II crack was about 70° ∼ 90°. However, Ayatollahi et al. [19] gave smaller initiation angles for the predominated mode II cracks as shown in Figure 2. In their tests, an edge cracked semicircular specimen subjected to asymmetric three-point bend loading was employed to conduct mixed mode brittle fractures under plane stress condition on PMMA sheet specimens.

A comparison between the theoretical predictions and test data.
For MSED criterion, Poisson's ratio also has a significant influence on the initiation angle prediction for plane stress case. It can be seen that MSED criterion (ν = 0) fails to estimate almost all the test results. When M e < 0.3, all the criteria, including MSED criterion (ν = 0.4), provide slightly bigger values against Williams and Ewing's results [18]. When M e > 0.3, MSED criterion (ν = 0.4) and Y criterion provide very good predictions compared to Williams and Ewing's results [18], whereas NT criterion gave a much bigger prediction, and MTS criterion and MERR criterion underestimate the initiation angle slightly. For the test results obtained by Ayatollahi et al. [19], none of the reviewed criteria can provide a close prediction when M e ≥ 0.3. As stated in previous section, lack of enough consideration of material property may be an important reason that no criterion can provide reasonable predictions on the initiation angles obtained in [19]. In addition, in order to obtain a better prediction, the nonsingular stress field should be adopted in the initiation angle determination [18–21]. It should be noted that some criteria, such as Zhu [22, 23], cannot predict crack initiation angles.
4. Mixed Mode Brittle Fracture Analysis by Some Fracture Criteria
4.1. Mixed Mode Brittle Fracture Tests on PMMA
Ayatollahi et al. [10] conducted a series of mixed mode brittle fracture tests on PMMA in the full range from pure mode I to pure mode II using a semicircular bend (SCB) specimen containing an edge crack. In their research, the radius r of the semicircular specimens is 50 mm and its thickness is 5.0 mm. The precrack was made by using a very thin strip saw and a razor blade, and the precrack length a is 15 mm. The distance between the two symmetry bottom supports is 21.5 mm. Their study showed that the conventional MTS criterion overestimates the strength of PMMA when the SCB specimen was used in the fracture tests for dominantly mode II loading conditions. In this study, several criteria were employed to predict the mixed mode fractures of PMMA as shown in Figure 3, where Poisson's ratio is set as 0.4.

Comparisons of the theoretical predictions with the test results on PMMA.
It can be seen that the results predicted by MERR criterion agree well with the experimental results. MTS criterion can well predict the predominately mode I fractures, but it fails to predict the predominately mode II fractures. For MSED criterion, NT criterion, and Y criterion, they overestimate the fracture strength even for the pure mode II fractures.
4.2. Mixed Mode Brittle Fracture Tests on Rock Masses
Aliha and Ayatollahi [11] conducted several mixed mode fracture tests on marble produced in Iran by using SCB specimens with a radius r of 55 mm. In their study, the thickness t of the specimens was approximately 25 mm. A thin fret saw blade of 0.5 mm thickness was applied to prepare 15 mm long edge cracks in the SCB specimens. The distance of the two symmetry bottom supports is set to 47.3 mm. The SCB specimens were loaded by a servohydraulic compressive test machine with a loading rate of 0.5 mm/min. Lim et al. [12] also presented the mixed mode I-II fracture toughness envelope for Johnstone using the SCB technique. Their specimens were about 95 mm in diameter and a/r value was in the range between 0.04 and 0.35. All the specimens were loaded at a fixed loading rate of 0.01 mm/min. Aliha et al. [13] investigated the mixed mode crack growth behavior of a sedimentary soft rock, guiting limestone, using both centre cracked circular disc (CCCD) and SCB specimen, and the specimen geometries and crack inclination angles in their tests were presented in Table 1. The tests were carried out under displacement control conditions with a constant crosshead speed of 0.08 mm/min. Chang et al. [14] studied the mixed mode fracture behavior of granite and marble (in Korea) by using the cracked chevron-notched Brazilian disc (CCNBD) specimen and SCB specimen. For SCB specimens, the loading span ratio s/r was set to 0.8, and dimensionless notch lengths (a/r) had ranged from 0.132 to 0.7942. In addition, the SCB specimen diameter was 100 mm or 75 mm, and the thickness was 15 ∼ 40 mm. Servocontrolled hydraulic testing machine MTS 810 was used for three-point bending testing. The test was displacement-controlled at the rate of 0.01 mm/s.
Specimen geometries and crack inclination angles in [13].

The test results and the prediction results are presented in Figure 4 to examine the applicability of each criterion. For most rock materials, Poisson's ratio is about 0.2–0.3, and therefore, ν is set as 0.25 for marble, limestone, and granite, and ν is set as 0.3 for Johnstone.

Comparisons of the theoretical predictions with the test results of rock materials.
From Figure 4(a), it can be seen that MERR criterion, NT criterion, and Y criterion can well predict the test results in [11]. Nevertheless, both MTS criterion and MSED criterion overpredict the fracture strength compared to the experimental results in [11]. When they are applied to the prediction of mixed mode fracture tests on marble in [14], all the reviewed criteria fail. In particular for MERR criterion, NT criterion, and Y criterion, the comparison result shows significant differences between the theoretical and experimental results. In Figure 4(a), it can be seen that the fracture toughness of marble from different area differs largely.
Figure 4(b) shows that both NT criterion and Y criterion have an accurate estimation on the failure envelop of Johnstone, and MERR criterion can well estimate the fracture strength for most mixed mode loading conditions. However, both MTS criterion and MSED criterion can only predict the predominately mode I fractures of Johnstone.
Figure 4(c) shows that the test results on limestone using SCB technique agree well with the prediction results of both Y criterion and NT criterion, but MTS criterion, MSED criterion, and MERR criterion show a large difference from the test results. By using CCCD specimen, the test results on limestone differ largely from the prediction results by all the reviewed criteria. It can be seen that the difference in the test results by using SCB specimens and by using CCCD specimens is very large, and this needs further study.
Figure 4(d) shows that only MSED criterion can estimate the fracture strength of granite.
4.3. Mixed Mode Brittle Fracture Tests on Asphalt Concrete
Ameri et al. [15] measured the mixed mode fracture toughness of asphalt concrete by using cracked semicircular specimens (see Figure 5) subjected to asymmetric three-point bend loading at a low temperature about −10°C. In their research, the loading rate was 3 mm/min. The SCB specimens were 15 cm in diameter, 2 cm in crack length, and 30 mm in thickness of specimens. The nominal maximum aggregate size was 12.5 mm, and the air void content was 4%. Figure 6 shows the comparison of the calculated results from the reviewed criteria with the experimental results [15] by using SCB-1 specimen as shown in Figure 5(b). Generally, asphalt concrete's Poisson's ratio is lower than 0.2 at low temperature. Therefore, in this analysis, Poisson's ratio was set as 0.17.

Different loading configurations that simulate mixed mode I/II for three types of SCB specimens presented in [15].

Comparisons of the theoretical predictions with the test results of asphalt concrete.
In Figure 6, it can be seen that the experimental data are scattered in a large range. Among the reviewed criteria, MSED criterion can predict almost all the mixed mode fractures of asphalt concrete. MTS criterion, MERR criterion, NT criterion, and Y criterion can predict the predominately mode I fractures, but they fail to predict predominately mode II fractures. The nominal maximum aggregate size 12.5 mm may play a dominant role in the fracture toughness of asphalt concrete.
4.4. Mixed Mode Brittle Fracture Tests on Ultrahigh Strength Steel and Nodular Cast Iron/Multi-Rare-Earth
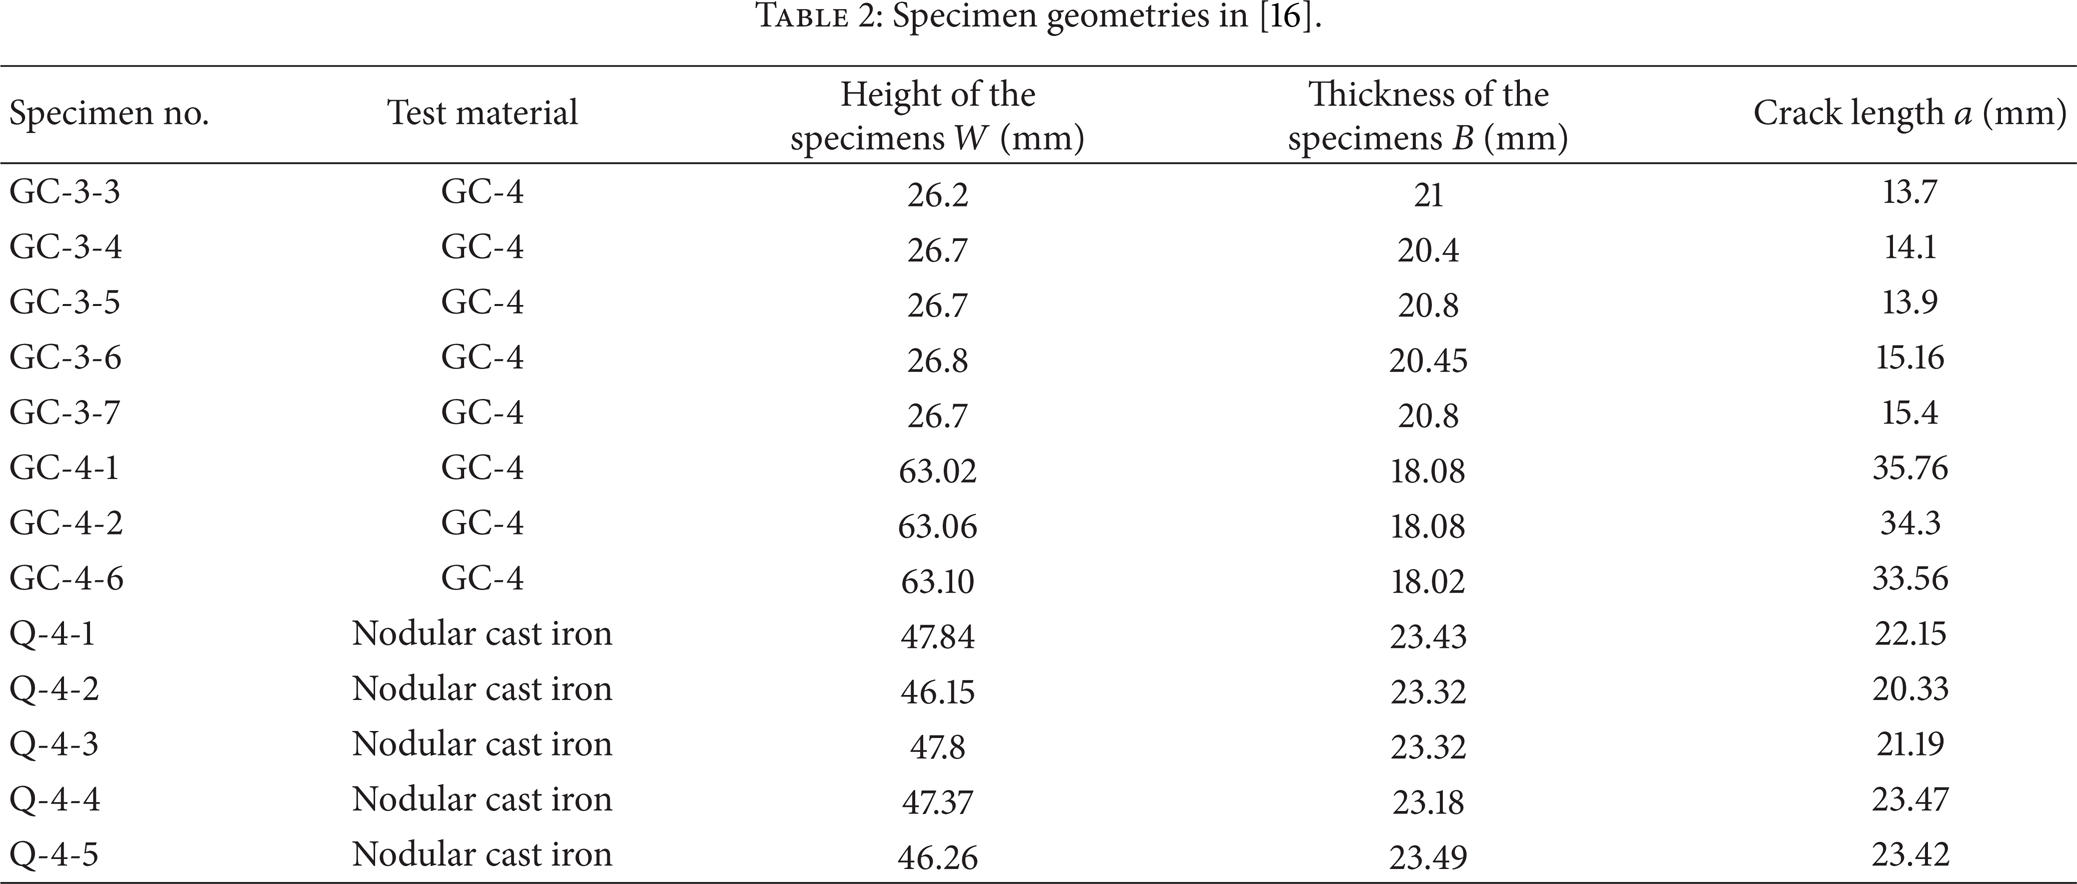
Gao et al. [16] conducted a series of mixed mode brittle fracture tests on ultrahigh strength steel (GC-4, produced in China) and nodular cast iron multi-rare-earth by using four-point bending and three-point bending techniques, respectively. The detailed specimen geometry parameters and test results are presented in Table 2. Gao et al. compared the theoretical predictions by MTS criterion, MSED criterion, and MERR criterion with their test data. Comparisons showed that none of these three criteria can predict the mixed mode fractures of ultrahigh strength steel and nodular cast iron. In this study, NT criterion and Y criterion are also compared with their test results in Figure 7.
Specimen geometries in [16].

Comparisons of the theoretical predictions (Poisson's ratio is 0.285) with the test results of GC-4 and nodular cast iron.
From Figure 7, it can be seen that all the criteria fail to predict the mixed mode fractures of ultrahigh strength steel and nodular cast iron. For the predominately mode II fractures, these criteria underestimate the fracture strength about 2.5–4 times than their real value. Even for the predominately mode I fractures, these criteria are not able to predict them either. Admittedly, the experimental data are limited, but the tendency of the test results shows that it seems impossible to have an accurate prediction by the criteria.
5. Discussion
5.1. The Effect of Constant Radius of Core Region
From the previous discussion, the reviewed criteria generally can well predict the initiation angles and fracture strengths of predominately mode I fractures, but none of them can well predict predominately mode II fractures. MTS criterion, MSED criterion, MERR criterion, and Y criterion postulate a parameter related to KI and KII to determine the initiation angle θ0 along a circle with radius r0, and the value of this parameter in the initiation direction θ0 will be compared with a critical value to determine the fracture load. It should be noted that the radius r0 is generally assumed to be an invariant for all mode mixities. Therefore, the parameter related to KI and KII in the initiation direction θ0 is independent of r0. For instance, MTS criterion assumed that a crack will propagate in the direction θ0 once the tangential stress in θ0 at a distance r0 reaches the critical value σθθc, and therefore, by employing (2) and (3), the initiation condition can be written as
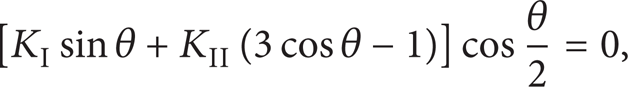

From (14) and (15), it can be found that r0 does not affect the initiation angle and the critical load. By using (15), one can determine the critical load of pure mode II crack, and a relationship between mode I fracture toughness KIc and mode II fracture toughness KIIc can be obtained KIIc = 0.87KIc. However, not all the materials satisfy this fixed condition, for example, KIIc = 0.52KIc for PMMA [10] and KIIc = 0.92KIc for pure epoxy [17]. Similar conclusions can be obtained for MSED criterion, MERR criterion, NT criterion, and Y criterion.
Actually, NT criterion also used a constant core region to determine the initiation angle. From (9), the elastic-plastic boundary r p can be determined as

Hence, the dilatational strain energy density on the elastic-plastic boundary can be obtained as

Noting that

Obviously, F(KI, KII, θ) is independent of r. In addition, by using
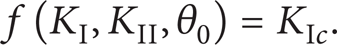
However, (19) is also independent of r0. Therefore, NT criterion also gives a fixed relationship between KIc and KIIc like MTS criterion, which is related to Poisson's ratio for plane strain and independent of Poisson's ratio for plane stress case.
Based on the above discussion, it can be seen that using a constant radius for the core region is an important reason that the reviewed criteria fail to predict the mixed mode fractures. Actually, from the test results of marble [11], the core region radius in the initiation direction (70.5°) determined by MTS criterion for pure mode II fracture is 0.69 mm (by using the parameters σθθc = 7.2 MPa,
5.2. The Effect of the Absence of Nonsingular T-Stress
Except for the effect of constant radius of core region, another reason for the criteria lacking of universality is the effect of the absence of nonsingular T-stress in the fracture criteria. By including T-stress, MTS criterion and MERR criterion were modified [20, 21] and the modified criteria show a good agreement with experimental data [20, 21]. Figure 8 shows the difference between the experimental result of marble in [11] and the theoretical prediction by the modified MTS criterion (i.e., GMTS criterion in [21]). According to the GMTS criterion, the initiation direction and fracture load can be obtained by employing the following equations:


Comparisons of the theoretical predictions with the test results of marble in [11].
GMTS criterion indicates that the brittle fractures in linear elastic materials result from both singular and nonsingular stresses [24]. The use of nonsingular stress terms then necessitates the introduction of the fracture process zone (FPZ) in core regions

which is assumed to be a material property [12], and σθθc is usually replaced by the tensile strength of the test material and regarded as a material constant. From (20) and (21), it can be seen that the value of r0 does affect both initiation direction and fracture load. For example, according to the test results [10] for PMMA, as r0 = {0.05 mm, 0.065 mm, 0.25 mm}, the estimated maximum hoop stress directions are about 75.98°, 76.52°, and 79.76°, respectively, and the corresponding estimated fracture toughness ratios (i.e., KIIc/KIc) are about 0.64, 0.6, and 0.42, whereas the experimental result was about 0.52 for PMMA [10].
However, the radius r0 of FPZ defined in (22) is also a constant parameter in GMTS criterion. According to the maximum principal stress model [25], the FPZ is just the tensile failure zone (microcrack zone) caused by the maximum principal stress. Figure 9 shows the maximum principal stress contours around the crack tip for pure mode I and pure mode II fractures of Johnstone tested by Lim et al. [12]. Only the maximum principal stresses which are larger than 0.4 MPa (approximately the tensile strength of Johnstone) are presented in Figure 9. It can be seen that the region of maximum principal stress for pure mode II fracture is much larger than that for pure mode I fracture. It can be seen that r0 for pure mode I crack differs from that for pure mode II crack significantly. Because of the above reasons, GMTS criterion usually uses several r0 to fit the experimental results.

Development of maximum principal stresses near the crack tip at notch for pure mode I and pure mode II cracks [12].
5.3. The Effect of the Assumption of Small Scale Yielding
All the reviewed criteria were proposed based on the small scale yielding condition. Otherwise, the elastic stress field around a crack tip cannot be employed. For instance, in MERR criterion presented by Hussain et al [4], the initial energy release rate for a branch crack propagating at an arbitrary angle from an existing crack tip is obtained under the condition that the kinked crack length tends to zero. For brittle materials, it seems reasonable to assume that the length of a branch crack has the same dimension to the FPZ for brittle materials. However, for most engineering materials the microcrack zone around a crack does not tend to zero when the propagation occurs; for example, the FPZ radius of 3 mm is calculated by (19) for marble, whereas the crack length is 16.5 mm [11]; the FPZ radius is 4.12 mm for Johnstone, whereas the crack length adopted is about 16.625 mm [12]. Therefore, MERR criterion may not give a very accurate result. For NT criterion and Y criterion, they seem more suitable for the elastic-plastic materials due to the consideration of plastic deformation around crack tips. However, they fail to predict the mixed mode fractures for ultrahigh strength steel and nodular cast iron multi-rare-earth as shown in Figure 7. This may be due to the absence of nonsingular T-stresses and the use of constant radius r0 as discussed above. For a large scale yielding case, HRR stress field should be employed instead of elastic stress field.
6. Conclusion
Mixed mode brittle fractures occur frequently in engineering practice. In order to prevent the disasters caused by such brittle fractures, it is necessary to predict the strength of the cracked engineering structures. Oppositely, in some engineering fields, such as hydraulic fracturing, needs to be designed an external load (e.g., mechanical loads, hydraulic pressure) to make the crack growth. Therefore, it is necessary to investigate the effectiveness of fracture criteria. In this paper, several widely accepted fracture criteria were reviewed and employed to analyze the mixed mode fracture test results. The applicability of each fracture criterion to the test materials was also examined. It shows that many criteria can provide a good estimation for predominately mode I fractures, but none of them can well predict predominately mode II fractures. Based on the current work, the following conclusions can be obtained.
All the reviewed criteria will predict an invariant fracture toughness ratio which cannot be widely accepted for various engineering materials.
Using a constant core region radius to determine the fracture initiation angle may be an important reason that the reviewed criteria fail to predict most brittle fractures.
For the nonsingular stress component controlled specimens, it will generate a large error without considering T-stress.
Generally, the core regions should not be assumed to be a circle, and the radius in the growth direction changes with the mixed mode loading conditions.
In GMTS criterion, the choice of r0 is an important task in predicting a mixed mode fracture.
For the cases that fracture process zone is not ignorable, the reviewed criteria may not be effective.
Lack of enough consideration of material property in the reviewed criteria may be another reason that they cannot well estimate the mixed mode fractures, and this need a further study.
Footnotes
Acknowledgments
This work was financially supported by the Sichuan Provincial Science and Technology Support Project (2012FZ0124), the National Natural Science Foundation of China (51074109), Opening Fund of Key Laboratory of Energy Engineering Safety and Disaster Mechanics of Sichuan University, and the Major State Basic Research Project (2011CB201201; 2010CB732005).