
Abstract
The naturally aspirated compressed natural gas (CNG) fueled homogeneous charge compression ignition (HCCI) engine operation region is narrow between heavy knock at rich air-fuel mixture side and misfire at the lean air-fuel mixture side. However, high activation energy is needed to attain autoignition temperature of CNG fueled HCCI engine. This paper seeks to provide guidance in overcoming challenges of CNG fueled HCCI engine by using CHEMKIN. It is used to investigate the fundamental characteristics of the homogeneous charge compression ignition combustion process for different air-fuel mixture inlet temperature, relative air-fuel ratio of 2.5, and with hemispherical bowl types of combustion chambers. The variation of various properties like the peak cylinder pressure, peak cylinder temperature, CO emission, NO emission, soot emission, and HC emission are studied. It is necessary to develop new combustion models to simulate and predict all parameters with high accuracy.
1. Introduction
The basic idea of homogeneous charge compression ignition (HCCI) engines is the autoignition of a homogeneous mixture that sufficiently lean to keep peak combustion temperatures below 1700 K which result in low NO x and low particulate matter PM emissions [1]. The high compression ratio (CR) used for initiating the HCCI combustion leads to rapid heat release process and high thermal efficiency [2]. As a result, HCCI engines achieve fuel economy levels comparable to those of compression ignition (CI) engines, while generating engine-out NO x emissions that are as good as tailpipe NO x emissions from conventional spark ignition (SI) engines with after treatment [1]. Therefore, the HCCI engine is a promising option for a clean and efficient configuration of internal combustion engine.
One of the key difficulties in the implementation of HCCI technology in production engines is that ignition cannot be directly actuated. The timing of autoignition of HCCI combustion is determined by the cylinder charge conditions, rather than the spark timing or the fuel injection timing that are used to initiate combustion in the SI and CI engines, respectively [3]. As demonstrated by many experimental results [4, 5], controlled autoignition requires regulation of the charge properties, namely, temperature, pressure, and composition at the intake valve closing [IVC]. The numerical approach has significant potential to investigate the HCCI engine combustion phasing, start of combustion (SOC), and emission characteristics [6–8].
In comparison with gasoline, natural gas has a very high octane number (≈120) and high autoignition temperature (≈600°C). Composed mostly of methane, natural gas is the only common fuel to exhibit relatively pure, single-stage combustion [2]. Other fuels have stronger low-temperature reaction and the required enthalpy for main stage combustion can be obtained from low-temperature heat release as a result of compression to moderate pressure and temperature. In contrast, the methane molecule resists destruction by free radicals and produces negligible heat release at low temperature. Hence, in CNG-fueled HCCI engines the activation energy required for autoignition must be obtained by extreme levels of charge heating and compression. This leads inherently to a high rate of heat release, and, in consequence, the air/fuel mixture must be highly diluted with air and/or EGR to avoid heavy knocking [9]. Small temperature differences inside the cylinder have a considerable effect on combustion. The internal hot Exhaust Gas Recirculation (EGR) leads to an earlier combustion [10]. The influence of initial temperature, initial pressure of mixture, natural gas composition, heat transfer model, equivalence ratio and compression ratio on ignition behavior of an HCCI engine have been investigated in different reference [11] and [12].
2. Modeling of the HCCI Engine
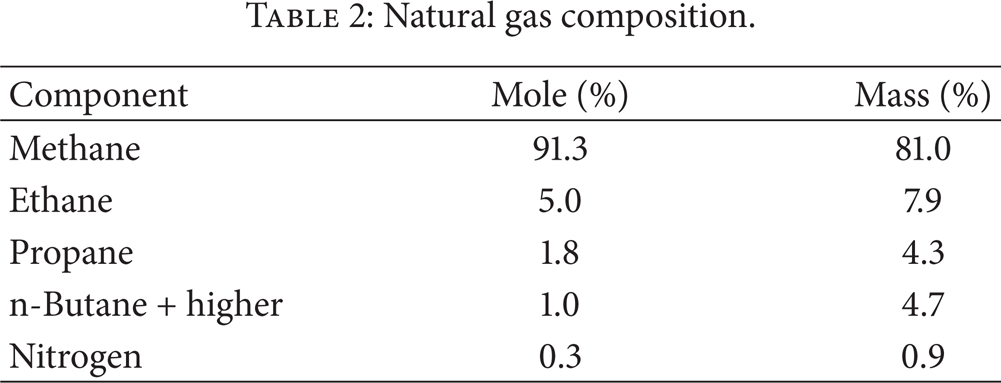
The present work is carried out using a single cylinder HCCI engine fitted with a hemispherical bowl considered for the analysis. Some important engine details considered for the analyses are given in Table 1. Figure 1 shows the engine model used for simulation. The natural gas composition is given in Table 2.
Engine specifications.

Natural gas composition.
Engine model.
In-cylinder gaseous measurements are made with special rigid tip of heated sample probe, allowing measurement of in-cylinder emissions. Sampling spark plug (SSP) adaptors are fitted at the spark plug. The perfectly stirred reactor (PSR) is also commonly referred to as a continuously stirred tank reactor (CSTR) in chemical engineering [3]. We use a very special type of reactor network, known as a “cluster.” The reactor “cluster” solution algorithm allows all reactor properties to be solved simultaneously in both transient and dynamic modes. In this cluster, recycling streams and heat flows between reactors can be included and resolved without external iteration in a computationally efficient manner.
The recycling and heat flow streams between any two reactors and additional inlets to each reactor are added. Each CSTR in the cluster can have different temperatures, heating rates, volumes, and surface areas. The contents of a well mixed or stirred reactor are assumed to be nearly spatially uniform due to high diffusion rates or forced turbulent mixing. In other words, the rate of conversion of reactants to products is controlled by chemical reaction rates and not by mixing processes, and hence the reactor is “limited” by reaction kinetics. An essential element of the stirred reactor model is sufficiently mixed to be described well by spatially averaged or bulk properties. The major advantage of the well stirred approximation lies in the relatively small computational demands of the mathematical model. Such a model allows investigators to easily consider and analyze large, chemical reaction mechanisms or complex reactor networks. In addition to fast mixing, the modeling of homogeneous reactors requires several assumptions, Such as mass transport to the reactor walls is infinitely fast, the batch systems are inherently transient, where the chemical state changes as production and destruction of species progress through chemical reaction and each inlet stream can be assigned its own attributes for flow rates, gas temperature, and composition. Recycling streams can be defined by specifying the fraction of the outflow from one reactor that will flow into another reactor. By default, the outflow of a reactor will flow 100 percent into the next (downstream) reactor in series. The mass flow from one CSTR to the next in series will be one minus the sum of the recycle flows defined from that reactor to all other reactors. In CHEMKIN-PRO, the reactor cluster capability has been extended to optionally perform reactor-to-reactor and global balancing of heat in the reactor network model. These extensions allow prediction of the net heat release from the reactor network system.
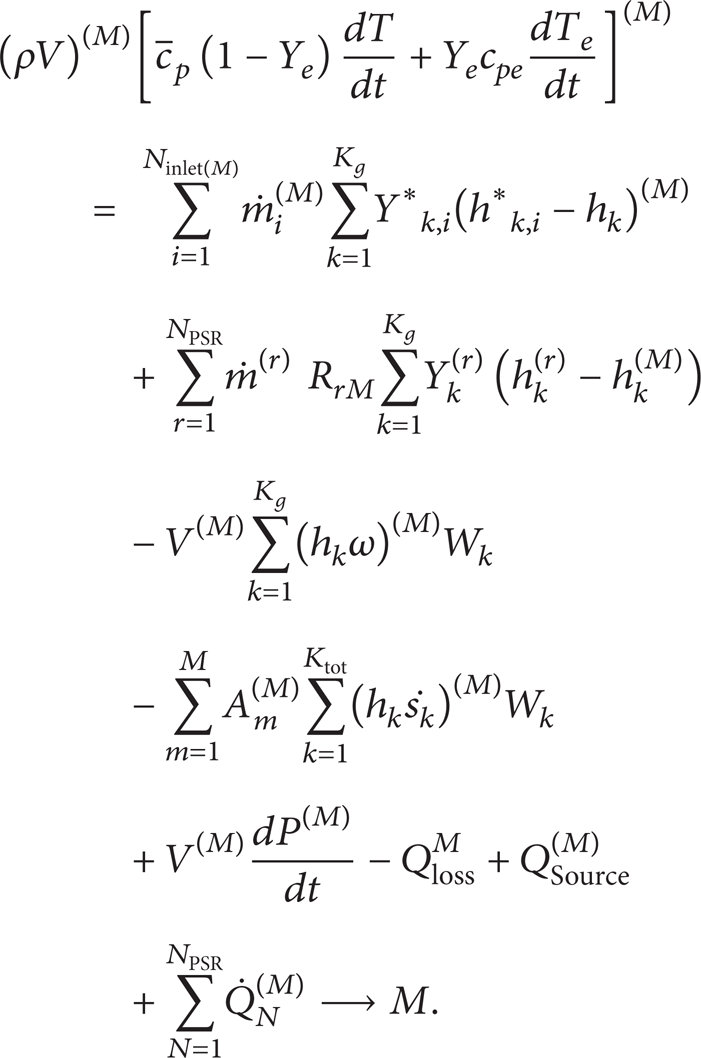
If heat transfer is allowed between reactor M and N, then the transient energy balance equation (1) for reactor M becomes
2.1. Chemical Kinetics of CNG Fuel Used in This Study
In the chemical kinetic, 15 species, 7 elementary reactions, and 12 elementary reactions for equilibrium (2)–(25) have been used for CNG fueled HCCI engine combustion process investigation.
Reaction

Reaction rate

Reaction

Reaction rate

Reaction

Reaction rate

Reaction

Reaction rate

Reaction

Reaction rate

Reaction

Reaction rate

2.2. Chemical Kinetics of Nitrogen Oxides
HCCI operation is generally characterized as a low NO x technique. The major NO x formation route in internal combustion engine combustion is the thermal route (John Heywood 1988). The thermal NO x route is the major constituent to the NO x emission and can be described by three elementary reactions Equations (14)–(16) are called the extended Zeldovich mechanism [13]:


Assuming quasi-steady state for N concentration, the rate of NO production by the reaction is given in (17):

The rate coefficient k1 is considered insignificant at temperatures less than 1700 K [6].
2.3. Formation of Carbon Monoxide
CO is one of the intermediate products in the reaction steps of hydrocarbon oxidation. The oxidation of CO to CO2 is relatively slow compared to the other reaction steps, and CO formed because the reaction is frozen before completion as shown in (18)-(19) [14].


2.4. Formation of Soot
Soot consists of carbonaceous particles formed during combustion under fuel rich conditions by the following reactions. The first four reaction equations (20)–(23), being bimolecular, are relatively fast for temperatures above 1400 K [15]. The recombination reaction equation (24) continues, while reaction equation (22) between O2 and H• slows to become the rate-limiting reaction for the entire mechanism. Fewer radical reactions in (20) and (21) lead to the possible release of any soot or CO:


The above reactions collectively sum to

2.5. Formation of Total Hydrocarbon (THC)
The unburned hydrocarbon emission is a result of incomplete combustion. It is expressed as THC mass fraction, as kg/m3. In HCCI engines HC emission is caused by a combination of several effects and the most important is that crevice volumes cause HC [15].
2.6. Governing Equations
The mass conservation in the reactor volume, where the time rate of change of the mass in the reactor is equal to the difference between the mass flow in and the mass flow out, plus any material that is added to or subtracted from the surfaces within the chamber [7]. The global mass balance equations are stated in:

Here j is the reactor number, ρ is the mass density, V is the reactor volume,
There are K
g
gas-phase species and M materials. The time-dependent equation for mass conservation of each gas-phase species, including the implicit time dependence of ρ through its dependence on the temperature and molecular weight, is species conservation equation as stated in (27): in the equation, Y
k
is the mass fraction of the kth species, W
k
is the molecular weight of the kth species, and

The superscript * indicates inlet stream quantities. For the gas temperature, the user can specify either a fixed temperature value or request solution of an energy balance in the reactor. The energy balance is determined by considering a control volume that includes the reactor, the reactor walls, and any deposited material therein [6]. The total internal energy of the reactor system is then stated in.

The total internal energy Usys consists of the internal energy of the gas, surface phases, deposited or etched solid phases, and walls. Qloss is the net heat flux directed out of the reactor. Qloss can either be specified directly as a constant (QLOS keyword) or can be specified in terms of a constant heat transfer coefficient, h t (HTRN keyword), and ambient temperature, T o . The transient energy equation for solving the gas temperature, is stated in (29):

Here we define
2.7. Simulation of Combustion Process
The combustion chamber geometry significantly influences the in-cylinder fluid dynamics, fuel-air mixing, and combustion [16]. Hence it is important to study the effect of piston bowl configuration characteristics. The geometry has been modeled at each one degree as shown in the Figure 2. The model was meshed with hexahedron elements. In fluid flow computations, the mesh size plays a vital role in affecting the accuracy of the results. With more number of cells in the domain, the numerical truncation errors may be eliminated. As a result the accuracy of the predicted results will be improved. But increasing the number of the cells increases computational time and memory requirements considerably. It is found that a mesh size of 44 × 44 is optimum. The mesh size is above means 44 cells in x-direction and 44 cells in y-direction. All the results furnished in this work are obtained with same mesh size of 44 × 44.

Computational domain created for different 10 crank angle degrees before TDC.
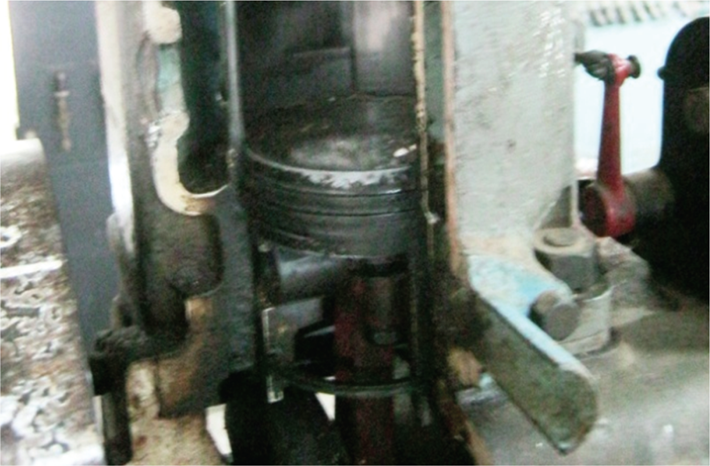
2.8. Experimental Setup
All experiments were conducted on a modified COMET engine to operate in HCCI mode using CNG fuel. Figure 3 shows the experimental setup.

Experimental setup.
3. Results and Discussion
3.1. Contours for Hemispherical Bowl at Different Crank Angles, Inlet Temperature of Air-Fuel Mixture at 140°C, and Relative Air-Fuel Ratio λ = 2.5
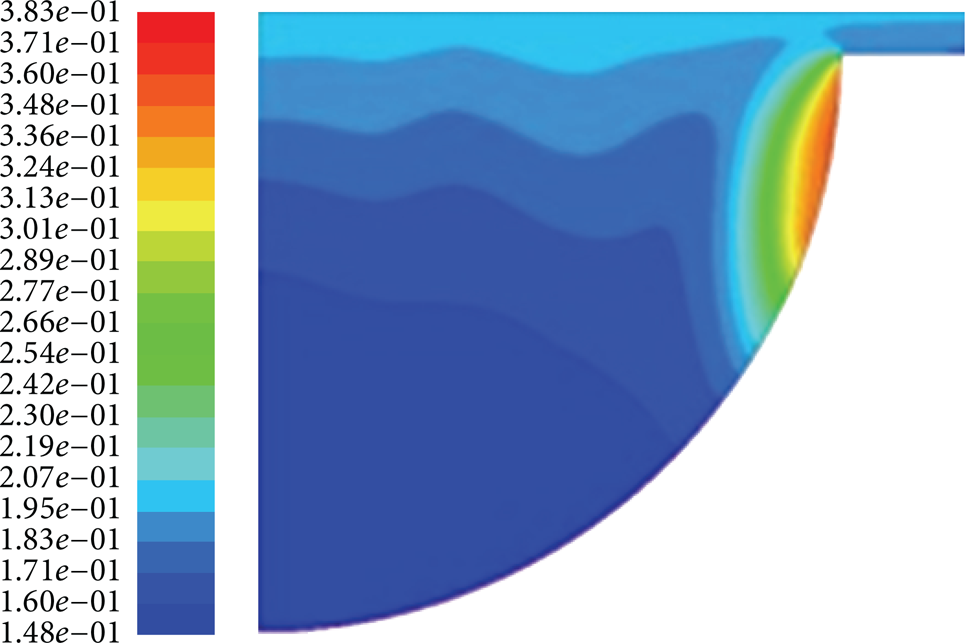
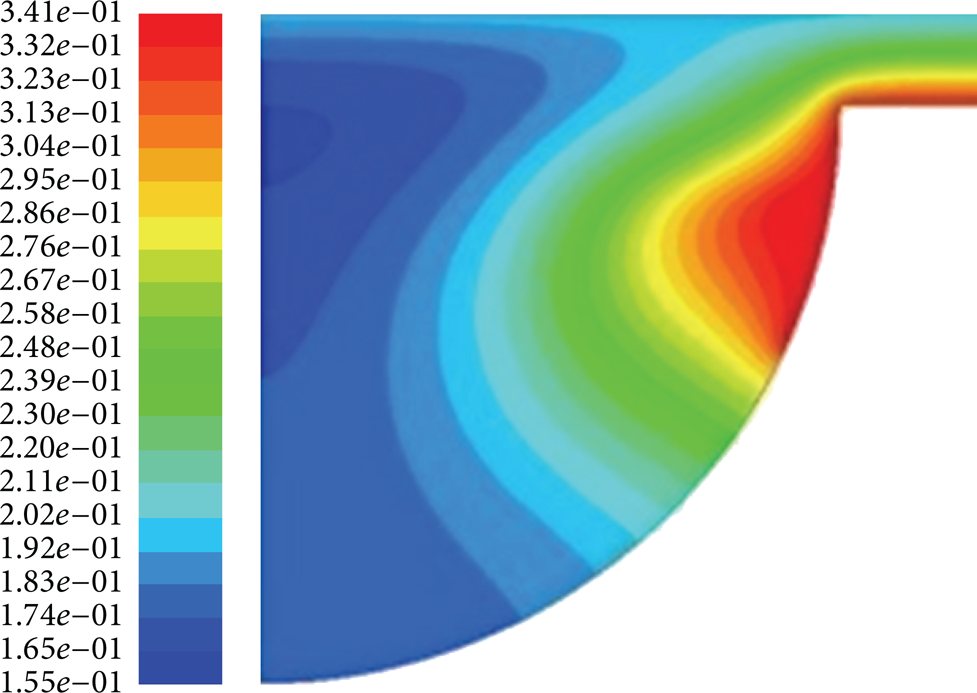
Figures 4, 5, 6, 7, and 8 show the performance characteristics for different crank angles, inlet temperature of air-fuel mixture at 140°C, and relative air-fuel ratio λ = 2.5 with hemispherical bowl.
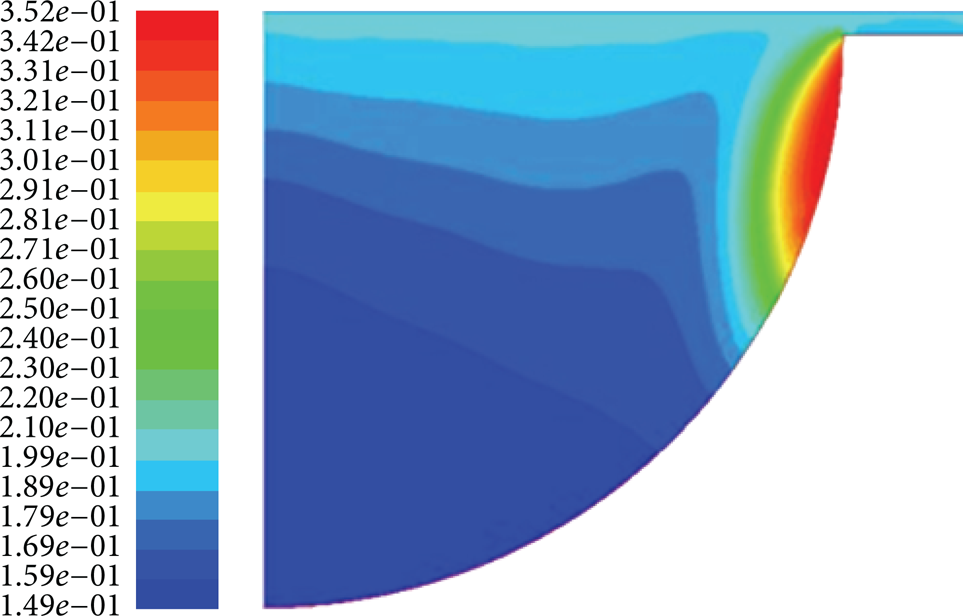
Contours of density at TDC for inlet temperature of air-fuel mixture at 140°C and λ = 2.5.
Contours of density at 3 deg after TDC for inlet temperature of air-fuel mixture at 140°C and λ = 2.5.
Contours of density at 6 deg after TDC for inlet temperature of air-fuel mixture at 140°C and λ = 2.5.

Contours of density at 10 deg after TDC for inlet temperature of air-fuel mixture at 140°C and λ = 2.5.

Contours of density at 13 deg after TDC for inlet temperature of air-fuel mixture at 140°C and λ = 2.5.
3.2. Validation of Simulation Results with Experimental Data
Figure 9 depicts that peak cylinder pressure and rate of pressure rise can be overpredicted. It is noticed that pressure rise in the case of simulation is due to some energy dissipation not considered in simulation. The single zone model has some limitations due to the assumption that the whole combustion chamber is treated as homogeneous. Figure 10 shows the validation of peak cylinder temperature with respect to crank angles for simulation results and experimental data. The peak cylinder temperature for simulation is higher than the experimental temperature due to some heat loss not considered in simulation. Figure 11 depicts NO emission and is found to be higher due to the higher peak cylinder temperature in simulation. It is well known that formation of NO is a strong function of peak cylinder mixture temperature [8].

Validation of peak cylinder pressure versus crank angle for simulation and experimental results.

Validation of peak cylinder temperature versus crank angle for simulation and experimental results.

Validation of NO emission versus crank angle for simulation and experimental results.
Figure 12 shows that the experimental CO emission is found to be higher and is 2.63 × 10⁻⁷ kg. This is due to multizone region not considered in simulation. The CO emissions mainly come from the low-temperature regions, such as boundary layer, near the walls, and crevice layer. These regions are not considered in simulations which results in less CO emission predictions. Figure 13 compares the mass of soot versus crank angle for simulation results and experimental data. It is noticed that for simulation the soot emission is found to be higher and is 0.0000072 kg. It is observed that soot formation for experiment is found to be lower and is 0.0000069. The model for soot formation is based on the H/C ratio and different H/C ratios result in overprediction of soot emissions. Figure 14 depicts that experimental HC emission is found to be higher and is0.00343 kg. It is observed from the HC versus crank angle profile that for simulation the HC emission is found to be lower and is 0.00329 kg. The simulation not considering HC molecules escapes after oxidation.

Validation of CO emission versus crank angle for simulation and experimental results.

Validation of soot emission versus crank angle for simulation and experimental results.

Validation of HC emission versus crank angle for simulation and experimental results.
3.3. Effect of Various Inlet Temperatures of Air-Fuel Mixture on Combustion Parameters and Pollutant Emissions
Figure 15 depicts that the peak cylinder pressure is found to be maximum which is 81.9 bar for inlet temperature of air-fuel mixture at 170°C. Regarding the effects of inlet temperature of air-fuel mixture on HCCI combustion, it was found that at higher inlet temperature of air-fuel mixture the mixture becomes easier to autoignite, so that combustion duration is shorter. This study reveals that the more advanced start of combustion in turn leads to higher peak net heat release rates. With more heat released prior to or very near TDC, the physical volume in which the energy is released becomes smaller, and so the engine geometry does not change as much per degree of crank angle [16]. This causes higher cylinder pressures. The variations of peak cylinder temperatures with respect to crank angles at different inlet temperatures of air-fuel mixture are shown in Figure 16. The heat released is found to be lower with lower inlet temperature of air-fuel mixture. In general, the study reveals that, as the inlet temperature of air-fuel mixture increases, the rate of combustion results in high peak cylinder temperatures. The peak in-cylinder temperature will take higher values, but it must be notified that the fuel mass and total heat released are constant for all intake temperatures; the density and volumetric efficiency will decrease, but the effect of it is less [16].

Variation of peak cylinder pressure versus crank angle for the different inlet temperatures of air-fuel mixture for HSB.

Variation of peak cylinder temperature versus crank angle for the different inlet temperatures of air-fuel mixture for HSB.
Figure 17 shows that among all the five inlet temperatures of air-fuel mixture the inlet temperature of air-fuel mixture at 130°C gives the lowest value of NO emission and is 1.78 × 10⁻⁷ kg. The higher cylinder temperature leads to high activation energy resulting in high level of NO emission. Thermal NO production is a function of the cylinder peak temperature conditions, not explicitly the fuel properties. In CNG fueled HCCI engine, thermal NO is widely understood to be the most significant contributor. Prompt NO formation taking place in the early stages of combustion contributes to the overall NO emissions but not at levels as significant as the thermal NO mechanism. The atmospheric nitrogen with higher temperature and higher oxygen concentration results in high NO formation rates [16].

Variation of NO emissions versus crank angle for the different inlet temperatures of air-fuel mixture for HSB.
Figure 18 shows that the CO emission for the inlet temperature of air-fuel mixture at 130°C is found to be higher and is 3.38 × 10⁻⁷ kg. When compared to the other inlet temperature of air-fuel mixture, it is seen that the inlet temperatures of air-fuel mixture at 170°C is found to have lower CO emission and is 2.34 × 10⁻⁷ kg. The higher intake temperature of air-fuel mixture enhances complete oxidation of CO, resulting in lower level of CO emission. The oxidation of CO is fast enough at the peak cylinder pressure and temperature but freezes later in the cycle when the combustion products are cooled by the expansion and heat losses, and CO emissions are formed because the temperature here is lower. CO is also formed in engines near to the cylinder walls. As a result of the low temperature of air-fuel mixture for late ignition timings, some of the CO, formed late in the combustion event, fails to oxidize completely [6].

Variation of CO emissions versus crank angle for the different inlet temperatures of air-fuel mixture for HSB.
Figure 19 illustrates the variation of soot emissions with respect to crank angles at different inlet temperatures of air-fuel mixture. It is noticed that soot emission for inlet temperature of air-fuel mixture at 130°C is found to be higher and is 7.7 × 10⁻⁶ kg. It is observed that the soot emission for inlet temperature of air-fuel mixture at 170°C is found to be lower and is 6.83 × 10⁻⁶ kg. The rate of oxidation of soot depends on the combustion product temperature as well as kinetics of the reaction.

Variation of soot emissions versus crank angle for the different inlet temperatures of air-fuel mixture for HSB.
Figure 20 shows that the HC emission for 170°C inlet temperature of air-fuel mixture is found to be lower and is 3.1 × 10⁻³ kg. At low inlet temperature of air-fuel mixture, cylinder pressure falls during the expansion stroke, and the temperature of the unburned mixture decreases resulting in slowing the postcombustion rate. If the pressure and temperature fall too rapidly, the postcombustion can be extinguished causing very high HC emission.

Variation of HC emissions versus crank angle for the different inlet temperatures of air-fuel mixture for HSB.
4. Conclusion
The important conclusions drawn from the hemispherical Piston Bowl configuration for different inlet temperatures of air-fuel mixture at best relative air-fuel ratio of λ = 2.5 are presented below.
It is noticed that pressure rise in the case of simulation is due to some energy dissipation not considered in simulation. The single zone model has some limitations due to the assumption that the whole combustion chamber is treated as homogeneous
The peak cylinder temperature for simulation is higher than the experimental temperature due to some heat loss not considered in simulation.
The CO emissions mainly come from the low-temperature regions, such as boundary layer, near the walls, and crevice layer. These regions are not considered in simulations which results in less CO emission predictions.
The model for soot formation is based on the H/C ratio and different H/C ratios result in overprediction of soot emissions.
The simulation not considering HC molecules escapes after oxidation.
It is observed that the maximum peak cylinder temperature for inlet temperature of air-fuel mixture at 170°C is 7.7% higher than air-fuel mixture inlet temperature at 130°C.
It is observed that the inlet temperature of air-fuel mixture at 170°C shows higher NO emissions of about 0.000000274 kg which is higher than inlet temperature of air-fuel mixture at 130°C which is 0.000000178 kg.
It is observed that the inlet temperature of air-fuel mixture at 130°C shows CO emissions of about 0.00000035 kg which is higher than inlet temperature of air-fuel mixture at 170°C and is 0.000000234 kg.
It is noticed that soot emission for inlet temperature of air-fuel mixture at 130°C is 12.7% higher than air-fuel mixture inlet temperature at 170°C.
It is noticed that HC emission for inlet temperature of air-fuel mixture at 130°C is 21% higher than air-fuel mixture inlet temperature at 170°C.