
Abstract
This paper evaluates the design of an offshore desalination plant currently under preliminary development. The purpose is to test the feasibility of producing drinkable water using wave energy in out-of-sight installations, as an alternative for those locations where land use, civil engineering works, and/or environmental impact make a coast-based solution inadequate. After describing the components, a proposal for sizing them is studied, based on using buoy-measured data at the expected location and their mathematical models of the different sections of the plant. Finally, by using measured buoy data, the influence of sizing on the expected performance is studied for a specific location, and one of the designs is developed in detail.
1. Introduction
Offshore desalination plants powered by renewable energies are being proposed as an alternative for a coastal desalination facility, for those locations where the lack of suitable land makes a land-based desalination plant inadequate [1, 2]. Different techniques of desalination have been studied in previous works. Among the most developed are reverse osmosis and vapor compression desalination [3].
This paper studies a proposal to use an offshore wave platform as the sole energy source of a reverse osmosis (RO) plant to produce drinkable water, which is then transported offshore (through pipes, water tank ships, or bladders) [4].
Some economic studies have been published about the advantages of autonomous wave-powered desalination plants. These works have discussed whether the real value of the system is enhanced due to its flexibility for deployment and reduced environmental impact [5, 6]. As renewable energy is the only source of energy, a central problem would be to balance energy consumption with energy production; as energy production is variable and the electrical system is isolated from the grid, the desalination plant has to be designed with variable production in mind [7, 8]. Most of the works on wave energy conversion have focused on electricity production. Any such converter could, in principle, be coupled to an electrically-driven desalination plant, either with or without connection to the local electricity grid. Various concepts have associated wave energy converters and RO [9].
The proposal presented here is based on dividing the plant into a few sections, which would be switched on or shutdown, depending on the available energy [10, 11]. All of this requires a specific control system, which is discussed later. Wave energy converters are studied as they provide lower variability in energy production in comparison with other sources [12]. Thus, power consumption adapts to power production by connecting or disconnecting sections of the plant (following a Smart Grid approach for the microgrid in the plant) and using temporary storage of electricity for short-time balances and an increase in autonomy.
The process diagram in Figure 1 presents the main blocks of our proposal: the wave energy converters (WECs), batteries, the seawater pumps (SWPs), the seawater tank, the desalination plant, the fresh water tank, and the water transport facility (by tankers, bladders, or pipes). After the introduction, a description of the different components is given in Section 2. A control system is proposed in Section 3. Section 4 gives some guidelines for the system sizing methodology. In Section 5, a case study is presented. Section 6 depicts some results and finally, some conclusions are provided in Section 7.

Process diagram.
2. Description of Components
2.1. Wave Energy Converters
The electrical power generated by a wave energy converter (WEC) is determined by its characteristics and the wave weather in the location [13]. We assume here the use of a multibody floating WEC; the energy is extracted by the relative motion of different parts of the structure. These devices are adequate for in deep water (>40 m) [11].
More precisely, the device used is a floating heave-buoy array (F-HBA), which is represented in Figure 2. It is a multibody floating WEC, composed of many heaving buoys connected to a common reference structure. This structure is composed of an arrangement of a single support structure and a series of ballast baskets, connected through tension wires. The total buoyancy force from the buoys is balanced by net gravity forces of the bridge and the ballast baskets. The buoys are connected to the submerged structure via a hydraulic Power Take-Off (PTO) system, which converts the mechanical energy of the device into electricity. In the case of wave activated body WECs, they can be based on hydraulic components (hydraulic rams and motors) combined with an electrical generator [14], or they can be fully electric [15, 16]. The second proposal was assumed in this work due to the special conditions in offshore plants. The microgrid designed in this paper has shedable loads (RO sections and SWP), so the consumed power adapts to the varying input power. The battery controllers ensure the needed grid regulation.
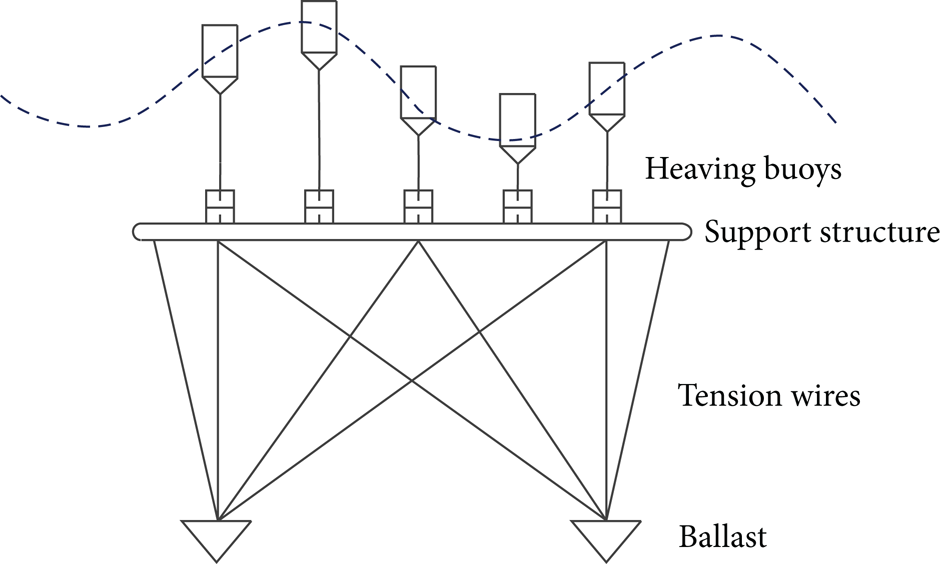
Scheme of the WEC.
One of the key points in the structural design and energy extraction capacity of the device is the response to different periods and wave heights (Figure 3). To evaluate the energy produced by the WEC, water waves are considered to travel along the surface of the sea with an approximate sinusoidal profile, characterized in terms of the time between successive crests and the size of these crests [17]. Wave height and period are represented by statistical measurements, the most common being the significant wave height, H s (t) (around four time the root-mean square of the surface elevation during a given window), and the wave period T p (t). The devices have a maximum range of operation; the energy that can be used by a device is limited to a maximum wave height and a minimum wave period. Multiplying the WEC power matrix (Figure 3) by the buoy-measured data of the sea location, the mean absorbed power during a specific time period of the device can be derived (P w ).
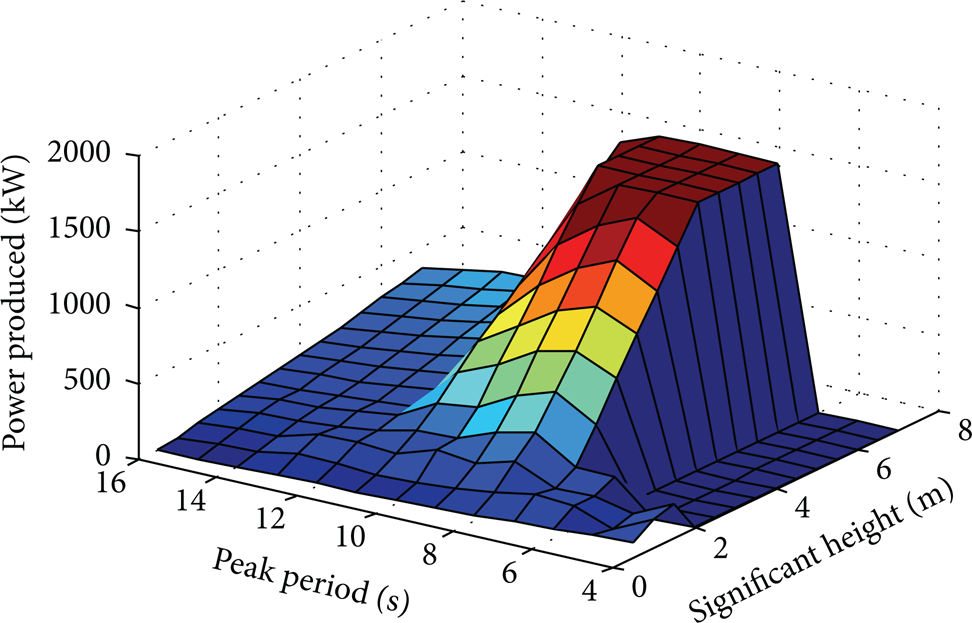
WEC power matrix.
2.2. Water Production
Different techniques for fresh water production have been developed. Nowadays, reverse osmosis and distillation processes are the most used technologies. The required plant capacity, the annual and daily distribution of fresh water demand, the product cost, the technology maturity, and any problem related to the coupling of the renewable energy and the desalination systems determine this selection [18]. The plant proposed in this paper is an offshore floating plant, which makes the implementation of distillation processes difficult due to the strict limitations on space and movements. Thus, RO was selected as the desalination technique as there is wide experience in this process in marine installations.
RO is based on the transport of water through a membrane by porosity and/or diffusion (see scheme in Figure 4). The chemical and physical nature of the membrane determines its ability to allow for preferential transport of the solvent (water) over the solute (salt ions). To ensure water flow through the RO membrane, a difference of pressure is needed between the feed and permeate sides of the membrane, which must be significantly greater than the osmotic pressure; for seawater this gives operating pressures around 60 bars [19]; the pressure of the brine is frequently recovered using specific devices to improve energy efficiency.

Transport of water through an RO membrane.
2.2.1. Desalination Plant Operation
As has already been mentioned, WEC energy production changes with time, which requires the power consumption (and thus the production of power) to adapt to the available power. Changing the working point of the plant (thus, changing the flow/pressure combination from a specific value) makes it possible to adapt the RO electrical load to the demand (this is challenging for RO plants, as they are normally designed to operate at an optimal working point).
A specific control system, discussed later, would be responsible for adapting power consumption to demand, always trying to operate the plant at the best possible overall efficiency.
It was decided to partition the high pressure part of the RO plant into three sections (A, B, and C) [4]; each section operates as a standard RO plant (producing water with maximum efficiency, at a fixed working point). Sections can operate on an individual basis or together with one or more of the different sections. Seawater is taken from the sea by the three independent pumps before being stored in a common seawater tank as can be seen in Figure 5 (ratings in this figure correspond to the case study that will be presented in Section 5). It is then desalinated and stored in a fresh water tank in order to transport it offshore.
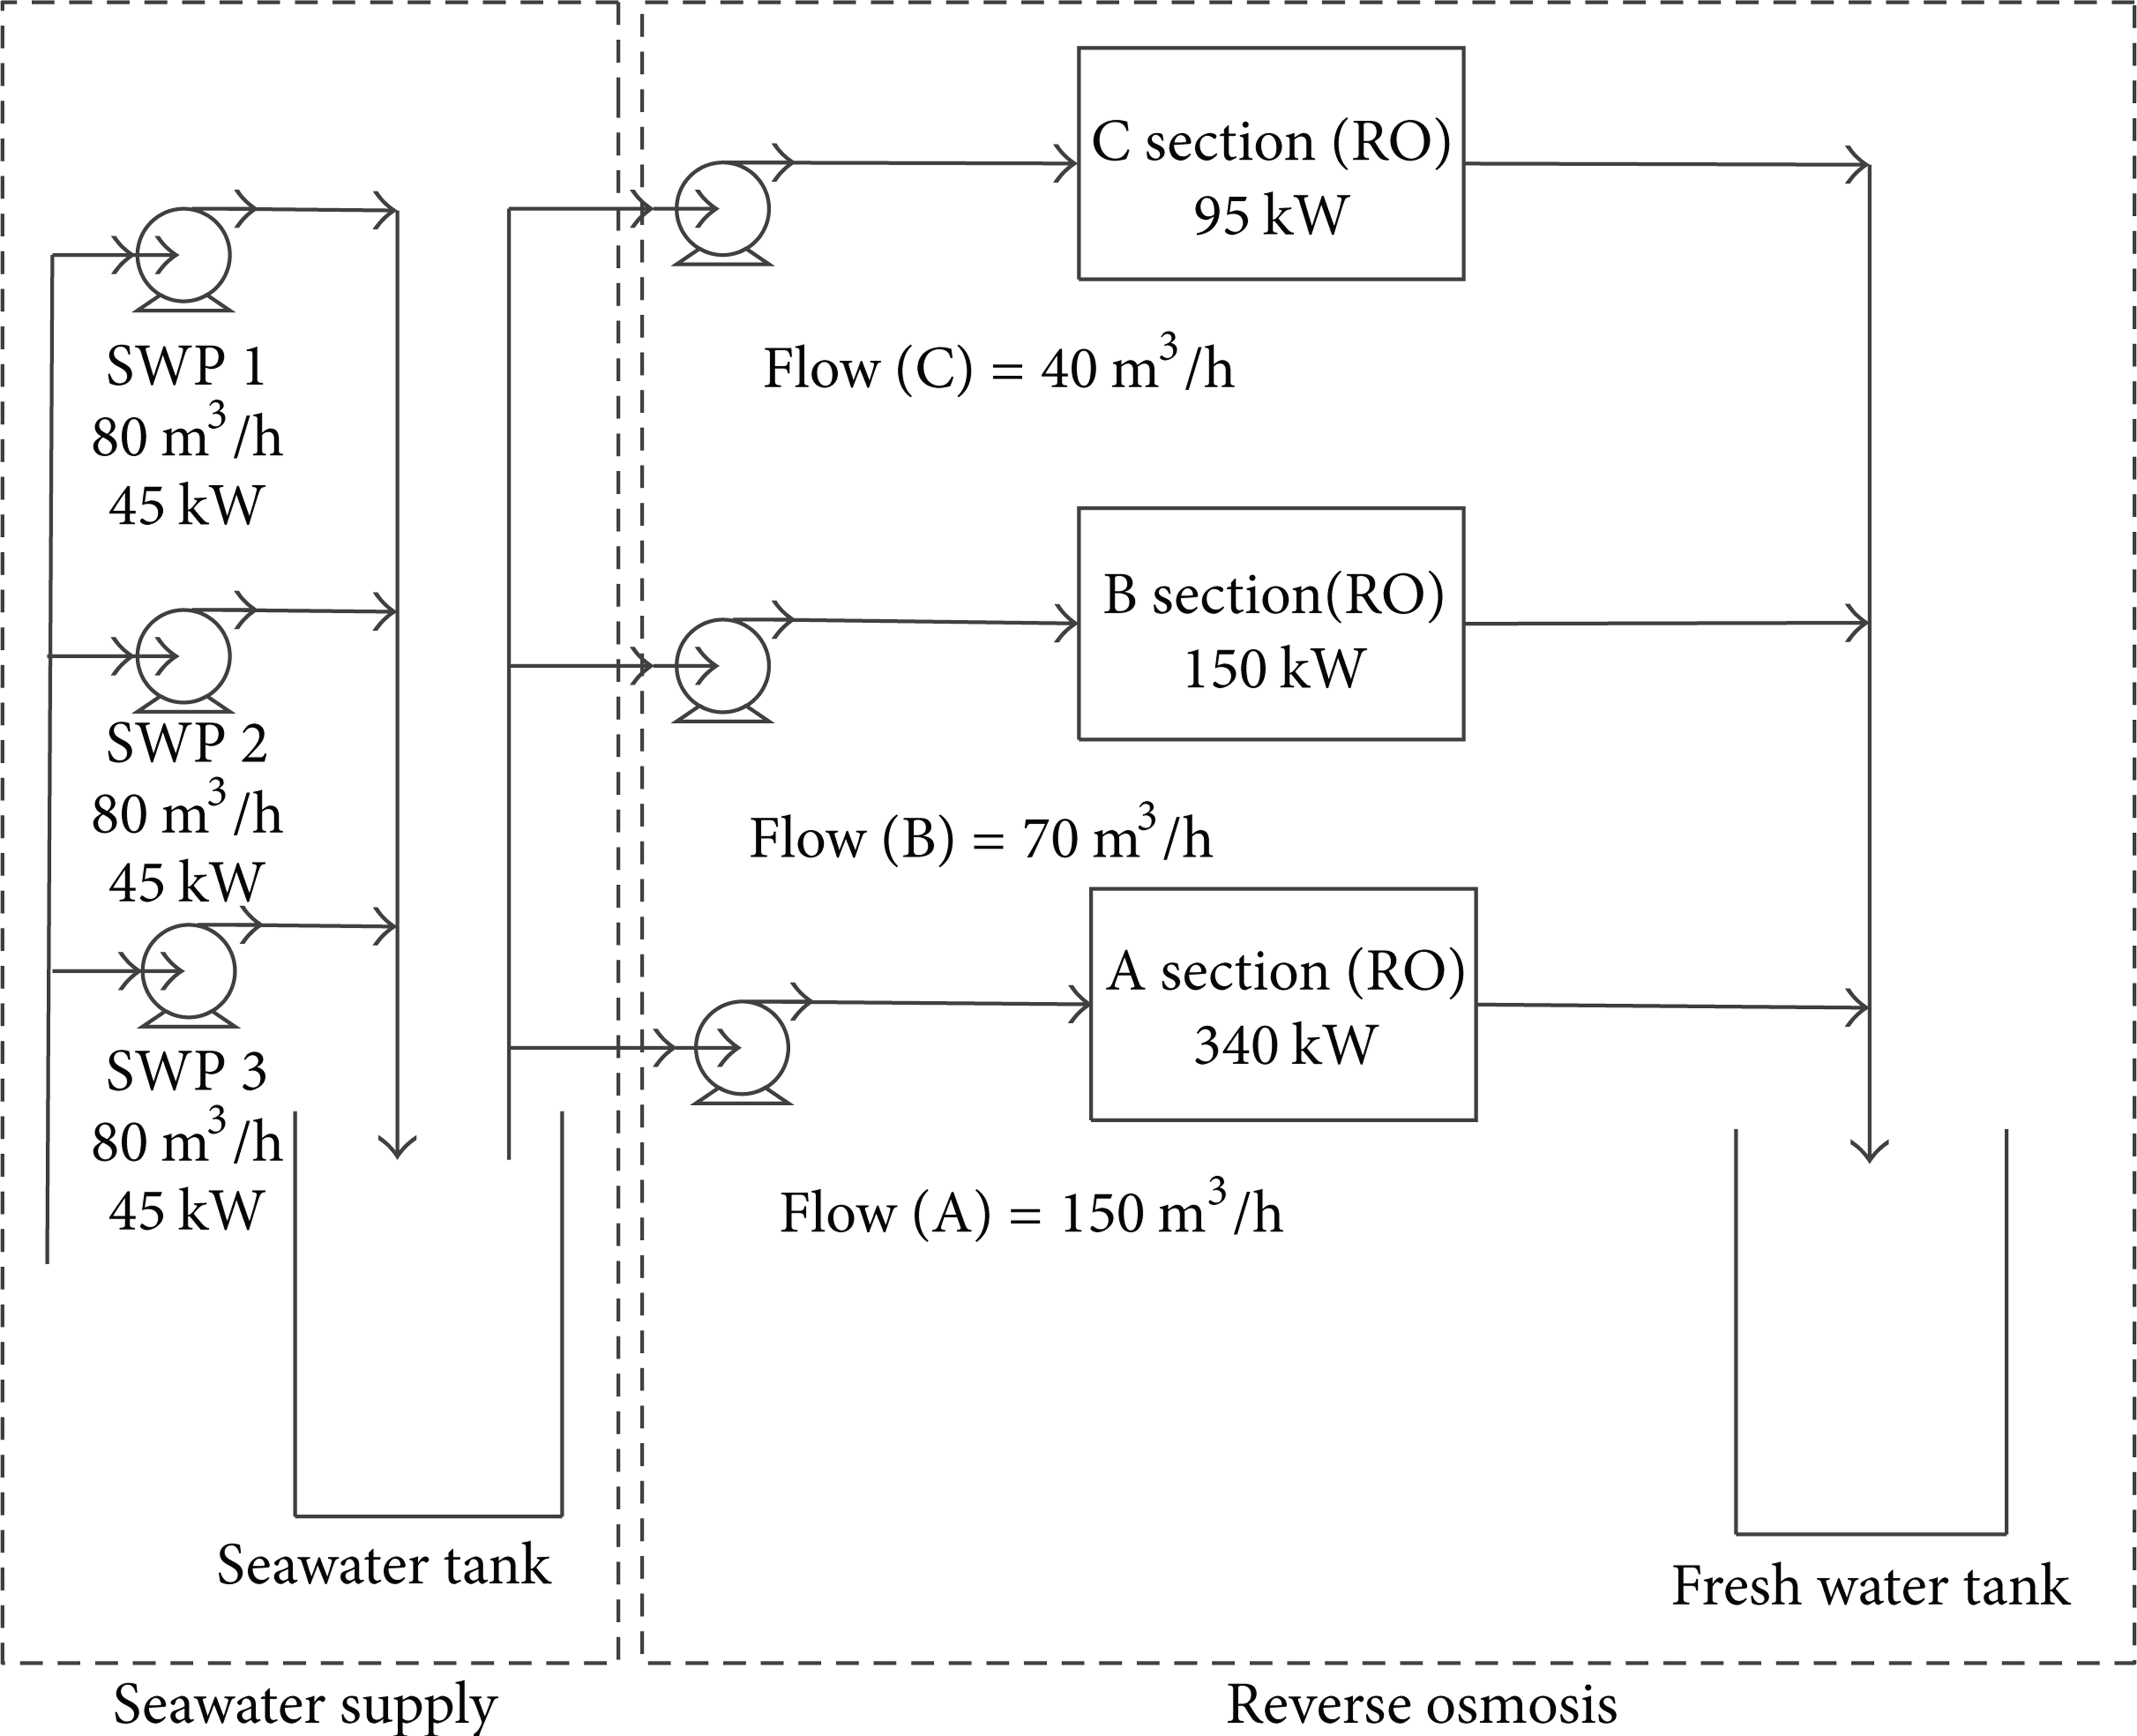
Structure of the proposed desalination plant.
2.3. Short-Term Energy Storage
The proposed system is offgrid, so energy production and demand must be balanced. Short-term energy storage is used to provide energy to the reverse osmosis plant and the SWPs when not enough power is provided by the WEC [20].
Several technologies have been proposed for temporary storage (see, e.g., [21] for a review of technologies). In this case, we will assume a standard Pb battery rack system, as there is wide experience in marine applications. A simple mathematical model of this system is as follows (the nominal voltage of the lead-acid cell is 2 volts) [22]:

where I is the current at the battery terminals, V is the voltage, P W is the power supplied by the WEC, and P T is the total power consumed by the SWPs and the RO. The equation relating the capacity of the battery and the amperage is as follows [11]:

where C R is the rated capacity at that discharge rate, t is the time (h), k is Peukert's coefficient, and η is the efficiency of the battery. The key decision variable, the depth of discharge (DOD) of a battery, is the percentage of capacity to which it is discharged. Values approaching 1 correspond to the battery being almost discharged. The DOD is given by the expression below, where C P is Peukert's capacity:

The value of the % of battery charge is given by this simple equation:

It is important to remark the fact that the constant discharging and charging of the batteries lead them to becoming quickly ineffective, so DOD is an important parameter that will be used inside the control system, as in [23, 24]. Therefore, the battery capacity that has finally been chosen in the simulation in Section 6 aims to be the least harmful to the system.
3. Control System
A central component to ensure the smooth operation of the facility is the control system, which should balance electricity production and consumption by adapting the consumed loads: the power of the seawater pumps (SWPs) and the pumps working in the different sections of the RO. Battery controllers regulate the local grid frequency and voltage. The control system is based on the two following ideas.
Six control variables are used, that correspond to the connection/disconnection of each of the sections A, B, and C in the RO and each SWP (see Figure 6).
When the production is higher than the consumption, the energy is stored until the temporary storage system is nearly full; then different sections of the RO and the SWPs are switched on.
When the storage system is almost empty, sections of the RO and the SWPs are switched off (these sections are then automatically cleaned and maintenance operations are carried out).

Proposed control system.
A control subsystem decides the connection/disconnection of the three SWPs in specific cases of safety.
When the level of the seawater tank is higher than a certain value, the three SWPs are switched off simultaneously until the level is again between safety limits.
When the level of the seawater tank is lower than a certain value, the three SWPs are switched on simultaneously until the level is again between safety limits.
The control logic is summarized in the Sequential Function Chart in Figure 7, where the different stages in the operation can be seen. There is one different combination of RO sections (A, B, and C) in each stage. Therefore, for each range of DOD values, there is a certain operating stage. Furthermore, in each stage, the three SWPs are switched on/off one by one, depending on the value of the DOD, as detailed in Figure 8, where the Sequential Function Chart in stage A is shown.
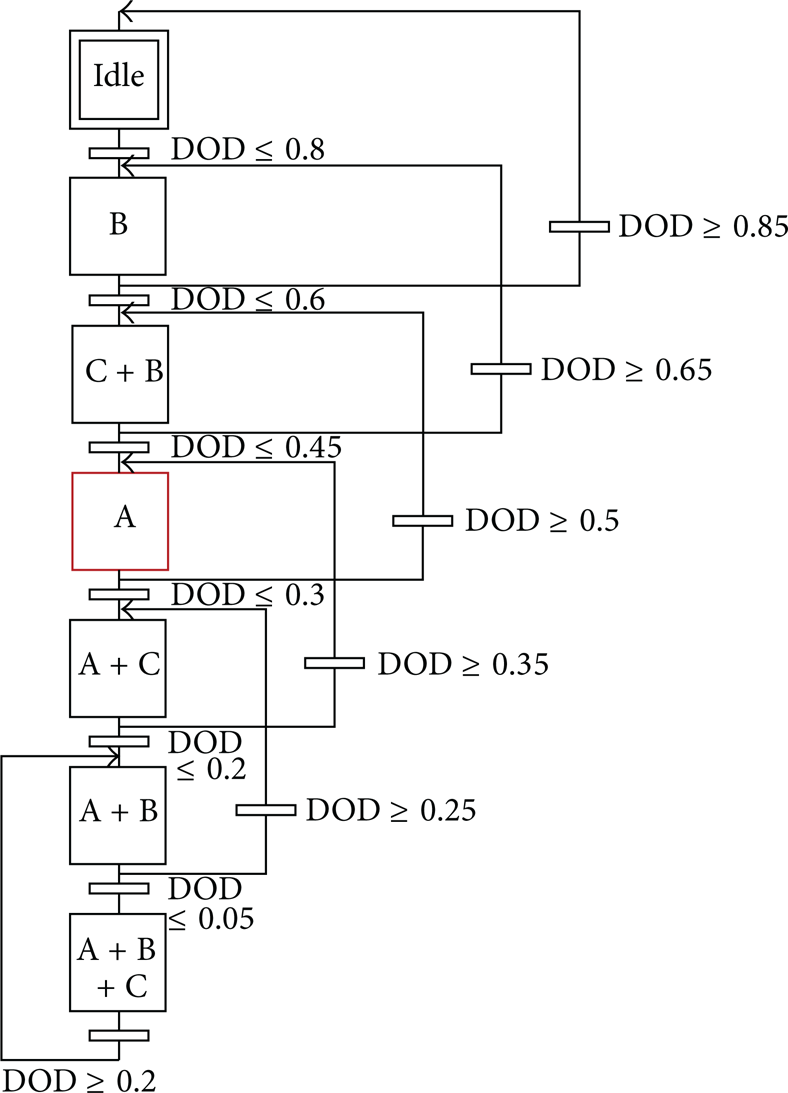
Sequential function chart of the control logic of the operation.

Detail of the sequential function chart (stage A).
4. Sizing
A central aspect of the design is the selection of the sizes of components. A parallel approach to the one presented in [11] is presented here. The following parameters are selected.
The fresh water produced, Q T (m3).
The RO plant capacity, F T (m3/h).
The total rated power consumption of the process,
The volume of the seawater tank, V S (m3).
The battery capacity, C P (Ah).
For correct sizing, we assume that a significant record of data measured in the location is available [11]. Sizing of the proposed facility can be carried out based on the rated power PW of the WECs and the measured data.
Using the measured data, the evolution of the power produced by the WECs P W (t) is estimated.
The total rated power consumption of the process
The tank size V S is selected to ensure autonomy at all times.
The battery capacity C
P
is selected to ensure W
a
hours of autonomy at all times and that the DOD is always between given limits
5. Case Study
As an example, the proposed structure of an RO plant designed to operate consuming between 95 kW and 665 kW of electricity is shown in Figure 5; section A is designed to produce 150 m3/h with a consumption of 340 kW, whereas section B is designed to produce 70 m3/h with a consumption of 150 kW, and C produces 40 m3/h and it consumes 95 kW. The energy consumption of the RO units is about 2.4 kWh/m3 and the plant recovery ratio is of 50%.
There are three seawater pumps (SWPs) that provide water from the seawater intake to the seawater tank. Each pump works with a power of 45 kW and a flow rate of 80 m3/h. These pumps are on-off pumps that work (or not) while the tank level is between certain values; if the tank level is higher than a safety value, all the pumps immediately switch off. Thus, the tank level can be controlled as has been detailed in Section 3.
6. Results and Discussion
To validate the proposed offshore platform and the sizing methodology, a case study was carried out for a specific location in the Atlantic Ocean, selected for its good wave regime. For this location, buoy data was measured for 165 days (wave heights, periods, water salinity, and temperature, etc.). Based on the available data, a platform was designed using the sizing methodology proposed in Section 4. This design was then tested assuming different platform parameters.
The simulation was modeled and performed using MATLAB and Simulink.
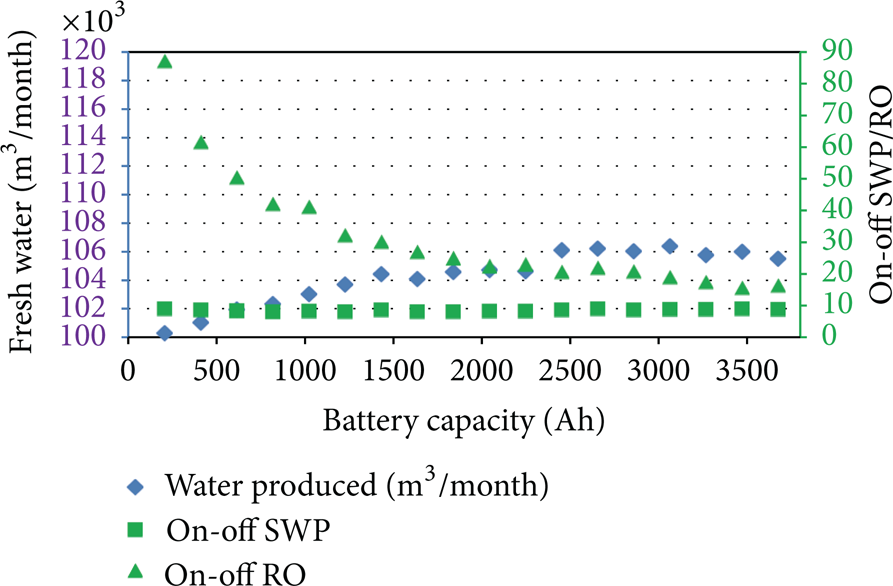
Figure 9 shows the effect of battery capacity on system performance: RO plant capacity and switch on-off times of the SWPs and the different sections of the RO for a tank volume (V S ) of 5500 m3. It shows that the amount of fresh water produced increases until a battery capacity value of 2400 Ah. It remains constant after this value. The value of the number of times that the SWPs are switched on-off is independent of the battery capacity. The number of times that the RO is switched on-off decreases with the increase of the battery capacity. Therefore, a battery capacity of 2400 Ah will be chosen to evaluate the effect of tank size on system performance.
Figure 10 shows the effect of the seawater tank volume with the same system parameters. It shows that the amount of fresh water produced is independent of the seawater tank volume. The same behavior has been seen with the number of times that the sections of the RO are switched on-off. As expected, the number of times that the SWPs are switched on-off decreases with the battery capacity.
Effect of battery capacity on system performance (V S = 5500 m3).

Effect of seawater tank volume on system performance (C p = 2400 Ah).
Finally, an operating point was selected, which is presented in Table 1.
Selected operating point.

Figures 11 to 16 show different parameters at the operating point on 165 days with buoy measurements. It can be seen that the proposed system operates adequately.
Figure 11 represents the power produced by the WEC. Power produced depends on the values of the wave's height and period (see Figure 3).
Figure 12 shows that the value of the fresh water produced in each RO section varies along time according to the stages of the RO illustrated in Figure 7.
Figure 13 shows the total fresh water produced, which is the sum of sections A, B, and C. It can be seen that this value increases if the value of power produced (Figure 11) is high.
Figure 14 depicts the total power consumed. It is proportional to the total fresh water produced plus the power consumed by the SWPs.
Figure 15 shows the stored seawater. The value is between the minimum and maximum safety levels.
Finally, Figure 16 depicts the % battery charge. As expected, this value varies between 30% and 100%; therefore, it never gets discharged.
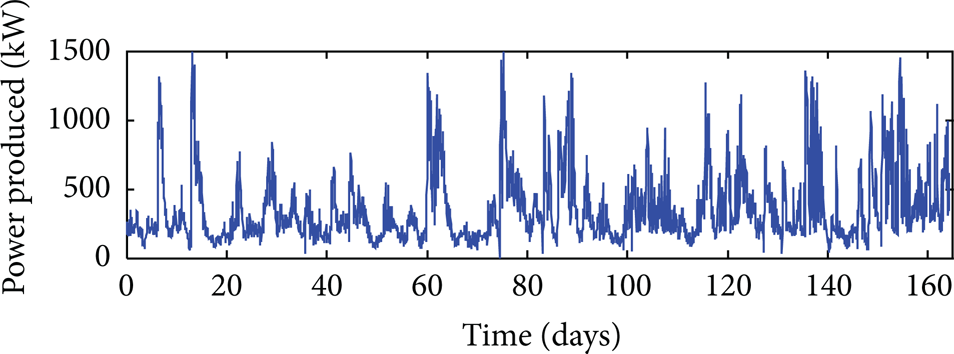
Power produced by the WEC.
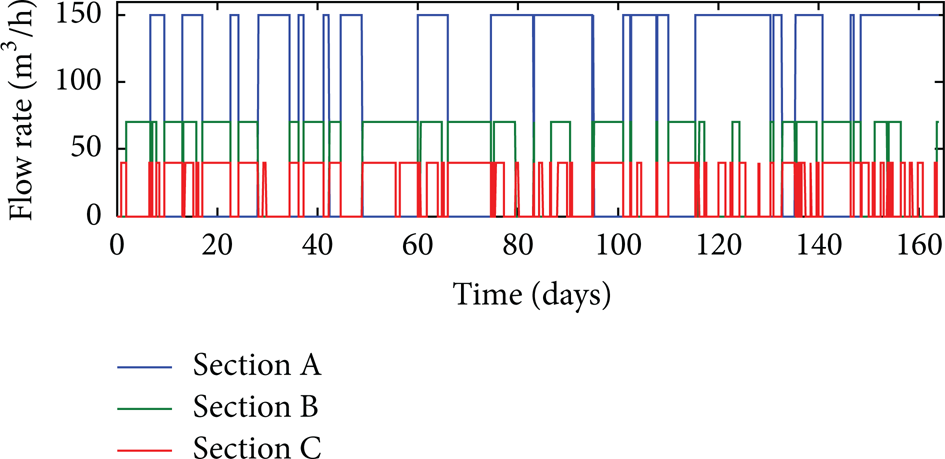
Fresh water produced in each RO section.

Total fresh water produced by the RO sections.

Total power consumed by the RO sections and SWPs.

Stored seawater in the seawater tank.

% Battery charge (100%-DOD in percentage).
7. Conclusions
Using wave energy to produce desalinated water in offshore plants is studied, based on a system completely isolated from the electrical grid. Power consumption adapts to power production by connecting or disconnecting sections of the reverse osmosis and the seawater pumps. After presenting the proposed facility which consists of a desalination system, a seawater supply, and short-term energy storage, a controller has been proposed, and some guidelines for sizing the plant for a specific location have been given. Using buoy data at the proposed location and a multicomponent model-based simulation makes it possible to predict the water production.
This proposal has been evaluated for one specific location (Atlantic Ocean), using buoy-measured data for sizing and predicting the production at this location. The design was then evaluated showing how the proposed design methodology makes it possible to desalinate water in a sustainable way. Further work must be done to optimize the sizing of components based on an advanced control system.
Footnotes
Acknowledgments
This work was partly supported by MiCInn (DPI2010-21589-c05-05) and the European Commission (7th Framework Programme, Grant Agreement 288145, Ocean of Tomorrow Joint Call 2011). The authors also acknowledge GRUPO SETA S. L. for designing the reverse osmosis system and the Marine Institute of Ireland for collaboration in buoy measurements.