
Abstract
Most bulk metal forming processes may be limited by ductile fracture, such as an internal or surface fracture developing in the workpiece. Finding a way to evaluate the ductile fracture criteria (DFC) and identify the relationships between damage evolution and strain-softening behavior of 3Cr20Ni10W2 heat-resistant alloy is very important, which, however, is a nontrivial issue that still needs to be addressed in greater depth. Based on cumulative damage theory, an innovative approach involving heat physical compression experiments, numerical simulations, and mathematical computations provides mutual support to evaluate ductile damage cumulating process and DFC diagram along with deformation conditions. It is concluded that, as for strain-softening material, ductile damage starts at work hardening phase, and the damage cumulation is more sensitive in work hardening phase than in work softening phase. In addition, DFC of 3Cr20Ni10W2 heat-resistant alloy in a wide temperature range of 1203∼1403 K and the strain rate of 0.01∼10 s−1 are not constant but change in a range of 0.099∼0.197; thus they have been defined as varying ductile fracture criteria (VDFC) and characterized by a function of strain rate and temperature. According to VDFC diagram, the exact fracture moment and position during various forming processes will be predicted conveniently.
1. Introduction
3Cr20Ni10W2 is one of the representative austenitic heat-resistant alloys. It is usually used for the material of exhaust valves on diesel engine in the large marine industry due to high strength, superior creep strength, excellent oxidation resistance, excellent heat resistance, and high corrosion resistance [1]. It is well known that the deformation behavior for a specified material is sensitive to strain, strain rate, and temperature. At a particular strain, under certain combinations of temperature and strain rate, the material may exhibit poor workability, whereas at other combinations it may show good workability. An important concern in the plastic forming processes of heat-resistant alloy is whether the desired deformation can be performed without any fracture in workpiece. In industrial practice, however, the empirical know-how of the designer is decisive for the fracture-free quality of the products, but it usually requires very costly trial-and-error [2]. Thus, there is a critical need for predicting and preventing fracture, which is a major feature of the forming process and the quality of the products. If it is possible to predict the conditions within the deformed workpiece which lead to fracture, then it would allow early modification of a production process and so reduces the risk of failure occurring, with obviously saving time and cost [3, 4].
As a vital index of formability, the ductile damage in plastic forming process can be described as a function of local temperature, strain, and the stress state. The resulting damage can be calculated, for example, with the model of effective stresses, considering crack closure effects by splitting the Cauchy stress tensor in a compressive and tensile part. Therefore, the materials damage state in industrial processes can be simulated by implementing damage models into finite element software. Thus the damage degree, that is, the fracture tendency, can be characterized as the ration of damage value and ductile fracture criteria (DFC). So far, the fracture criterion of Cockcroft-Latham has been applied successfully to a variety of loading situations. It is suited for ductile fracture in bulk metal-forming simulation [5]. Usually the critical damage value is considered as a constant of materials like yield stress and stress limit, though it is affected by the working condition. Cockcroft and Latham [2–9] have not expounded whether the critical damage value depends on the temperature and strain rate.
The main purpose of the present work is to analyze and uncover the nature relationships between damage evolution and deforming parameters of 3Cr20Ni10W2 heat-resistant alloy and furthermore to construct ductile fracture criteria histogram along with deforming parameters. An innovative concept of damage sensitive rate is brought forth as the essential intermediate quantity to determine ductile fracture criteria. As for the innovative approach, heat physical compression simulations, numerical simulations, and mathematical computations are necessary, which induces that physical experiments and numerical computations provide mutual support to determine the varying ductile fracture criteria (VDFC). Without a doubt, VDFC of 3Cr20Ni10W2 alloy make it possible to predict the exact fracture moment and position during various forming processes. That is to say, the VDFC obtained in this work can help technicians to choose suitable process parameters and avoid the occurrence of fracture. It is very significant to guide the practical production.
2. Materials and Experimental Procedure
The 3Cr20Ni10W2 austenitic heat-resistant alloy employed in the present investigation is provided in the form of bar with the diameter of 100 mm. Its chemical compositions (wt. %) are as follows: C 0.25, Si 1, Cr 20, Ni 10, Mn 1, W 2, and Fe (balance). Before the experiment, the homogenized ingot was scalped to diameter 10 mm and height 12 mm with grooves on both sides filled with machine oil mingled with graphite powder as lubrication to reduce friction between the anvils and specimen during hot compression tests. The specimens were resistant heated to a certain temperature at a heating rate of 1 K/s by a computer-controlled, servohydraulic Gleeble 1500 machine, and held at a certain temperature for 180 s by thermocoupled-feedback-controlled AC current to ensure a uniform starting temperature and decrease the material anisotropy. All the twenty specimens were compressed to a fixed true strain of 0.9163 (height reduction 60%) at the temperatures of 1203 K, 1253 K, 1303 K, 1353 K, and 1403 K and the strain rates of 0.01 s−1, 0.1 s−1, 1 s−1, and 10 s−1. During the compressing processes the variations of stress and strain were monitored continuously by a personal computer equipped with an automatic data acquisition system. In the tests, the temperatures of the specimens were controlled to within ±0.1 K through three thermocouples adhibited affixed to the specimens.
The true stress-strain relationships were derived from the nominal stress-strain curves collected according to the following formula: σ T = σ N (1 + ∊ N ), ∊ T = ln(1 + ∊ N ), where σ T is the true stress, σ N the nominal stress, ∊ T the true strain, and ∊ N the nominal strain.
3. Flow Stress Behavior and Experiment Results
The true compressive stress-strain curves of 3Cr20Ni10W2 heat-resistant alloy are illustrated in Figures 1(a)–1(d), which show that both deformation temperature and strain rate have considerable influence on the flow stress of 3Cr20Ni10W2 alloy. Comparing these curves with one another, it is found that, for all of specimens after initial yielding, the flow stress decreases monotonically with different softening rates. For a specific strain rate, the flow stress decreases markedly with the increase in temperature. In contrast, for a specific temperature, the flow stress generally increases with the increase of strain rate due to an increase of dislocation density and the dislocation multiplication rate. Moreover, the true stress–strain curves in Figure 1 show that increasing strain rate or decreasing deformation temperature makes the flow stress level increase; in other words, it prevents the occurrence of softening due to DRX and dynamic recovery (DRV) and makes the deformed metals exhibit work hardening (WH). The cause lies in the fact that higher strain rate and lower temperature provide shorter time for the energy accumulation and lower mobilities at boundaries which result in the nucleation and growth of dynamically recrystallized grains and dislocation annihilation [10–12].

True stress-strain curves of 3Cr20Ni10W2 alloy at different strain rates and temperatures (a) 0.01 s−1, 1203∼1403 K; (b) 0.1 s−1, 1203∼1403 K; (c) 1 s−1, 1203∼1403 K; and (d) 10 s−1, 1203∼1403 K.
From the true stress-strain curves in Figures 1(a)–1(d), it can be seen that the stress evolution with strain exhibits three distinct stages [13]. At the first stage while work hardening (WH) predominates and causes dislocations to polygonize into stable subgrains, flow stress exhibits a rapid increase to a critical value with increasing strain; meanwhile the stored energy in the grain boundaries originates from a large difference in dislocation density within subgrains or grains and grows rapidly to dynamic recrystallization (DRX) activation energy. When the critical driving force is attained, new grains are nucleated along the grain boundaries, deformation bands, and dislocations, resulting in equiaxed DRX grains. At the second stage, flow stress exhibits smaller and smaller increase until a peak value or an inflection of work hardening rate is reached, which shows that the thermal softening due to DRX and dynamic recovery (DRV) becomes more and more predominant, and then it exceeds WH. At the third stage, two types of curve variation tendency can be generalized as follows: decreasing gradually to a steady state with DRV softening (1303∼1403 K & 0.01 s−1, 1353∼1403 K & 0.1 s−1, and 1403 K & 1 s−1) and decreasing continuously with significant DRX softening (1203∼1253 K & 0.01 s−1, 1203∼1303 K & 0.1 s−1, 1203∼1353 K & 1 s−1, and 1203∼1403 K & 10 s−1). Thus, it can be concluded that the typical form of flow curve with DRX softening, including a single peak followed by a steady-state flow as a plateau, is more recognizable at high temperatures and low strain rates. The cause lies in the fact that at higher strain rates and lower temperatures the higher work hardening rate slows down the rate of DRX softening, and both the peak stress and the onset of steady-state flow are therefore shifted to higher strain levels [14, 15].
The results of heat physical compression experiments are shown in Figure 2. Figure 2(a) shows the specimen as-received; Figure 2(b) shows the deformed specimen with a height reduction of 60% at temperature of 1253 K and strain rate of 10 s−1, on which no visible crack appears; Figure 2(c) shows the deformed specimen with a height reduction of 80% at temperature of 1253 K and strain rate of 10 s−1, on which visible cracks appear; Figure 2(d) shows the deformed specimen with a height reduction of 60% at temperature of 1203 K and strain rate of 0.1 s−1, on which no visible crack appears; Figure 2(e) shows the deformed specimen with a height reduction of 60% at temperature of 1353 K and strain rate of 0.1 s−1, on which cracks appear.

The specimen (a) as-received, (b) with a height reduction of 60% at temperature of 1253 K and strain rate of 10 s−1, (c) with a height reduction of 80% at temperature of 1253 K and strain rate of 10 s−1 (d) a height reduction of 60% at temperature of 1203 K and strain rate of 0.1 s−1, (e) and a height reduction of 60% at temperature of 1353 K and strain rate of 0.1 s−1.
The microstructures on the section plane of specimen were examined and analyzed under the optical microscope, as shown in Figure 3. Figure 3(a) shows the microstructure on the cross section of the deformed specimen with a height reduction of 60% under temperature of 1203 K and strain rate of 10 s−1. It can be seen that the deformed metal partially transforms to a microstructure of approximately equiaxed defect-free grains which are predominantly bounded by high angle boundaries (i.e., a recrystallized microstructure) by relatively localized boundary migration, and the grain boundaries of the rest of untransformed metal reveal an uniform vector in radial direction due to weak recovery for grain boundary torsion. Across the recrystallized microstructure, no crack can be found. Figure 3(b) shows the microstructure on the cross section of the deformed specimen with a height reduction of 80% under temperature of 1253 K and strain rate of 10 s−1. By comparison with Figure 3(a), it can be seen that more deformed metal transforms to recrystallized microstructure due to higher mobility of grain boundaries (growth kinetics), and all the grains tend to be more homogeneous due to stronger adaptivity for grain boundary migration. However, microcracks appear in the middle region of the section, which shows that the visible cracks on the upsetting drum have extended from the surface to the center. According to elastic-plastic mechanics theory, in an upsetting process, the maximum stress appears on the upsetting drum, while minimum stress appears in the middle region. Therefore, macrocracks appear on the upsetting drum firstly and then extend to the internal.

The cross-sectional microstructure of 3Cr2Ni10W2 alloy (a) with a height reduction of 60% under temperature of 1203 K and strain rate of 10 s−1 (b) and a height reduction of 80% under temperature of 1253 K and strain rate of 10 s−1.
4. Basis for Damage Computation
4.1. Cockcroft-Latham's DFC
Generally, workability depends on the local conditions of stress, strain, strain rate, and temperature in combination with material factors, such as the resistance of a metal to failure. Failure in bulk metal forming usually occurs as ductile fracture, rarely as brittle fracture. Therefore, a ductile fracture criterion is very important and necessary for designing an optimum plastic forming process without failure. According to various hypotheses, many criteria for ductile fracture have been proposed empirically as well as theoretically. Cockcroft and Latham [9, 16–19], based on cumulative damage theory, developed a damage computation module based on a critical value of the tensile strain energy per unit volume, which has been widely applied in the field of bulk forming with high reliability. Therefore, the damage module of Cockcroft-Latham is convenient for both experimental and numerical approaches is used in the present investigation to estimate if and where surface fracture occurs during the deformation process. Cockcroft-Latham's damage [9, 16, 17] can be expressed as an amount of work that the ratio of maximum tensile stress σ
T
to effective stress

where
In order to calculate D by FE simulation, (1) has to be converted to an appropriate discrete expression that is convenient for FE code:

where
4.2. Approach to Determine Cockcroft-Latham-Type DFC
From Figure 1, it can be seen that 3Cr20Ni10W2 heat-resistant alloy is a typical strain-softening alloy. As is well known, for strain-hardening alloy the fracture criteria can be determined by directly comparing the simulation with the destructive experiments in terms of the critical deformation level. However, for strain-softening alloy the ductile fracture criteria can not be determined directly because it is difficult to find visible cracks on the surface of deformed billet and the stress-strain curveshave notapparent fracture points. Thus, it is necessary to find an indirect way to evaluate the ductile fracture criteria. An innovative indirect (nondestructive) method to evaluate DFC has been brought forward in this research. A basic research approach in which physical experiments and numerical simulation provide mutual support for the critical damage factor was established. As several series of billet samples had been compressed on a heat physical simulation machine under different deformation temperatures and strain rates, the true stress-strain data collected resulted in the performance of simulations through an integration method using the subroutine in the DEFORM-2D platform.
According to cumulative damage theory, the damage value a moment ago is less than that a moment later during a compressing process. Therefore the maximum value seems to appear at the last simulation step, but it does not mean fracture step. As the cumulation characters maybe contribute to find the critical damage value, it is necessary to analyze the damage cumulating process. Thus, an innovative concept about the sensitive rate of Cockcroft-Latham damage (as (3)) in plastic deformation (Rstep) is brought out and defined as the ratio of the damage increment at one step (ΔD) to the accumulated value (Dacc). It is supposed that if the maximum damage value will keep increasing in a very small growth rate near to zero, it means that fractures have appeared [9]. Thus, the fracture time, that is, fracture strain or fracture height reduction, will be identified and determined:

The emergence of the assumptions above responds to Kachanov's [20–22] explanation of damage. Kachanov explained the “one-dimensional surface damage variable” by considering a damaged body and a representative volume element (RVE) at a point M oriented by a plane defined by its normal

where S
Dx
is the area of intersection of all the flaws with the plane defined by the normal

Damaged RVE in a damaged body.
In (3), damage D is bounded as 0 ≤ D ≤ D c , where D c is a critical damage value corresponding to the decohesion of atoms in a representative volume element, D = 0 represents the undamaged RVE material, and D = D c represents the rupture failure in the remaining resisting area. As rupture failure has occurred, damage D will keep increasing in a growth rate near to zero or equal to zero with increasing deformation strain. It means that the damage will not be sensitive to deformation.
5. Computation Results
5.1. Cumulating Process of Ductile Damage
Rigid-plastic FE models were established in the DEFORM-2D platform to simulate the above corresponding upsetting tests. The basic model to represent compression testing method is shown in Figure 5. Because of symmetry, in order to simplify and reduce the running time during the simulation, only one-half of the geometry is considered. The specimen was modeled as a plastic object; the tools were modeled as rigid surfaces. The initial mesh of billet consists of 800 four node elements; due to both sides of the cylinder workpiece filled with machine oil mingled with graphite powder as lubrication, the frictional between the specimen and the tools is assumed to be 0.1. For the simulation of plastic deformation process, the material model for billet can be defined by inputting the true stress-strain curve date (as Figure 1). And then the damage value during the deformation process was calculated. Figure 6 shows the damage distribution of the height reduction of 60% under temperature of 1253 K and strain rate of 0.01 s−1. From the simulation results of all the isothermal hot compression tests at the temperatures of 1203 K, 1253 K, 1303 K, 1353 K, and 1403 K and the strain rates of 0.01 s−1, 0.1 s−1, 1 s−1, and 10 s−1, it can be seen clearly that the maximum damage value always appears in the region of upsetting drum corresponding to higher strain, stress, and strain rate, while the minimal value appears in the middle region. As the results shown in Figure 6, the most severely damaged material is located in the upsetting drum, with the damage extent decreasing sharply in diameter from outside to inside.

The basic model of compression testing in DEFORM-2D.

The damage distribution of the height reduction 60% under temperature of 1253 K and strain rate of 0.01 s−1.
Based on the simulation results, the maximum damage of workpiece during the whole upsetting processes at different temperatures and strain rates was evaluated and shown in Figures 7(a)–7(d). It can be seen that the damage increases nonlinearly as the compressive true strain increases from 0 to about 0.4, and then it increases nearly linearly. Comparing these curves with one another, it is found that as the strain rate is 1 s−1, for a fixed true strain, the maximum cumulated damage decreases with increasing temperature, while there is no obvious regularity for the strain rates of 0.01 s−1, 0.1 s−1, and 10 s−1. In contrast, for a fixed temperature, at first, the maximum cumulated damage decreases rapidly and then slightly increases; finally, the damage value decreased again (as shown in Figure 8). Further, it can be summarized that the changes in strain rate have a more significant effect on the cumulated damage.
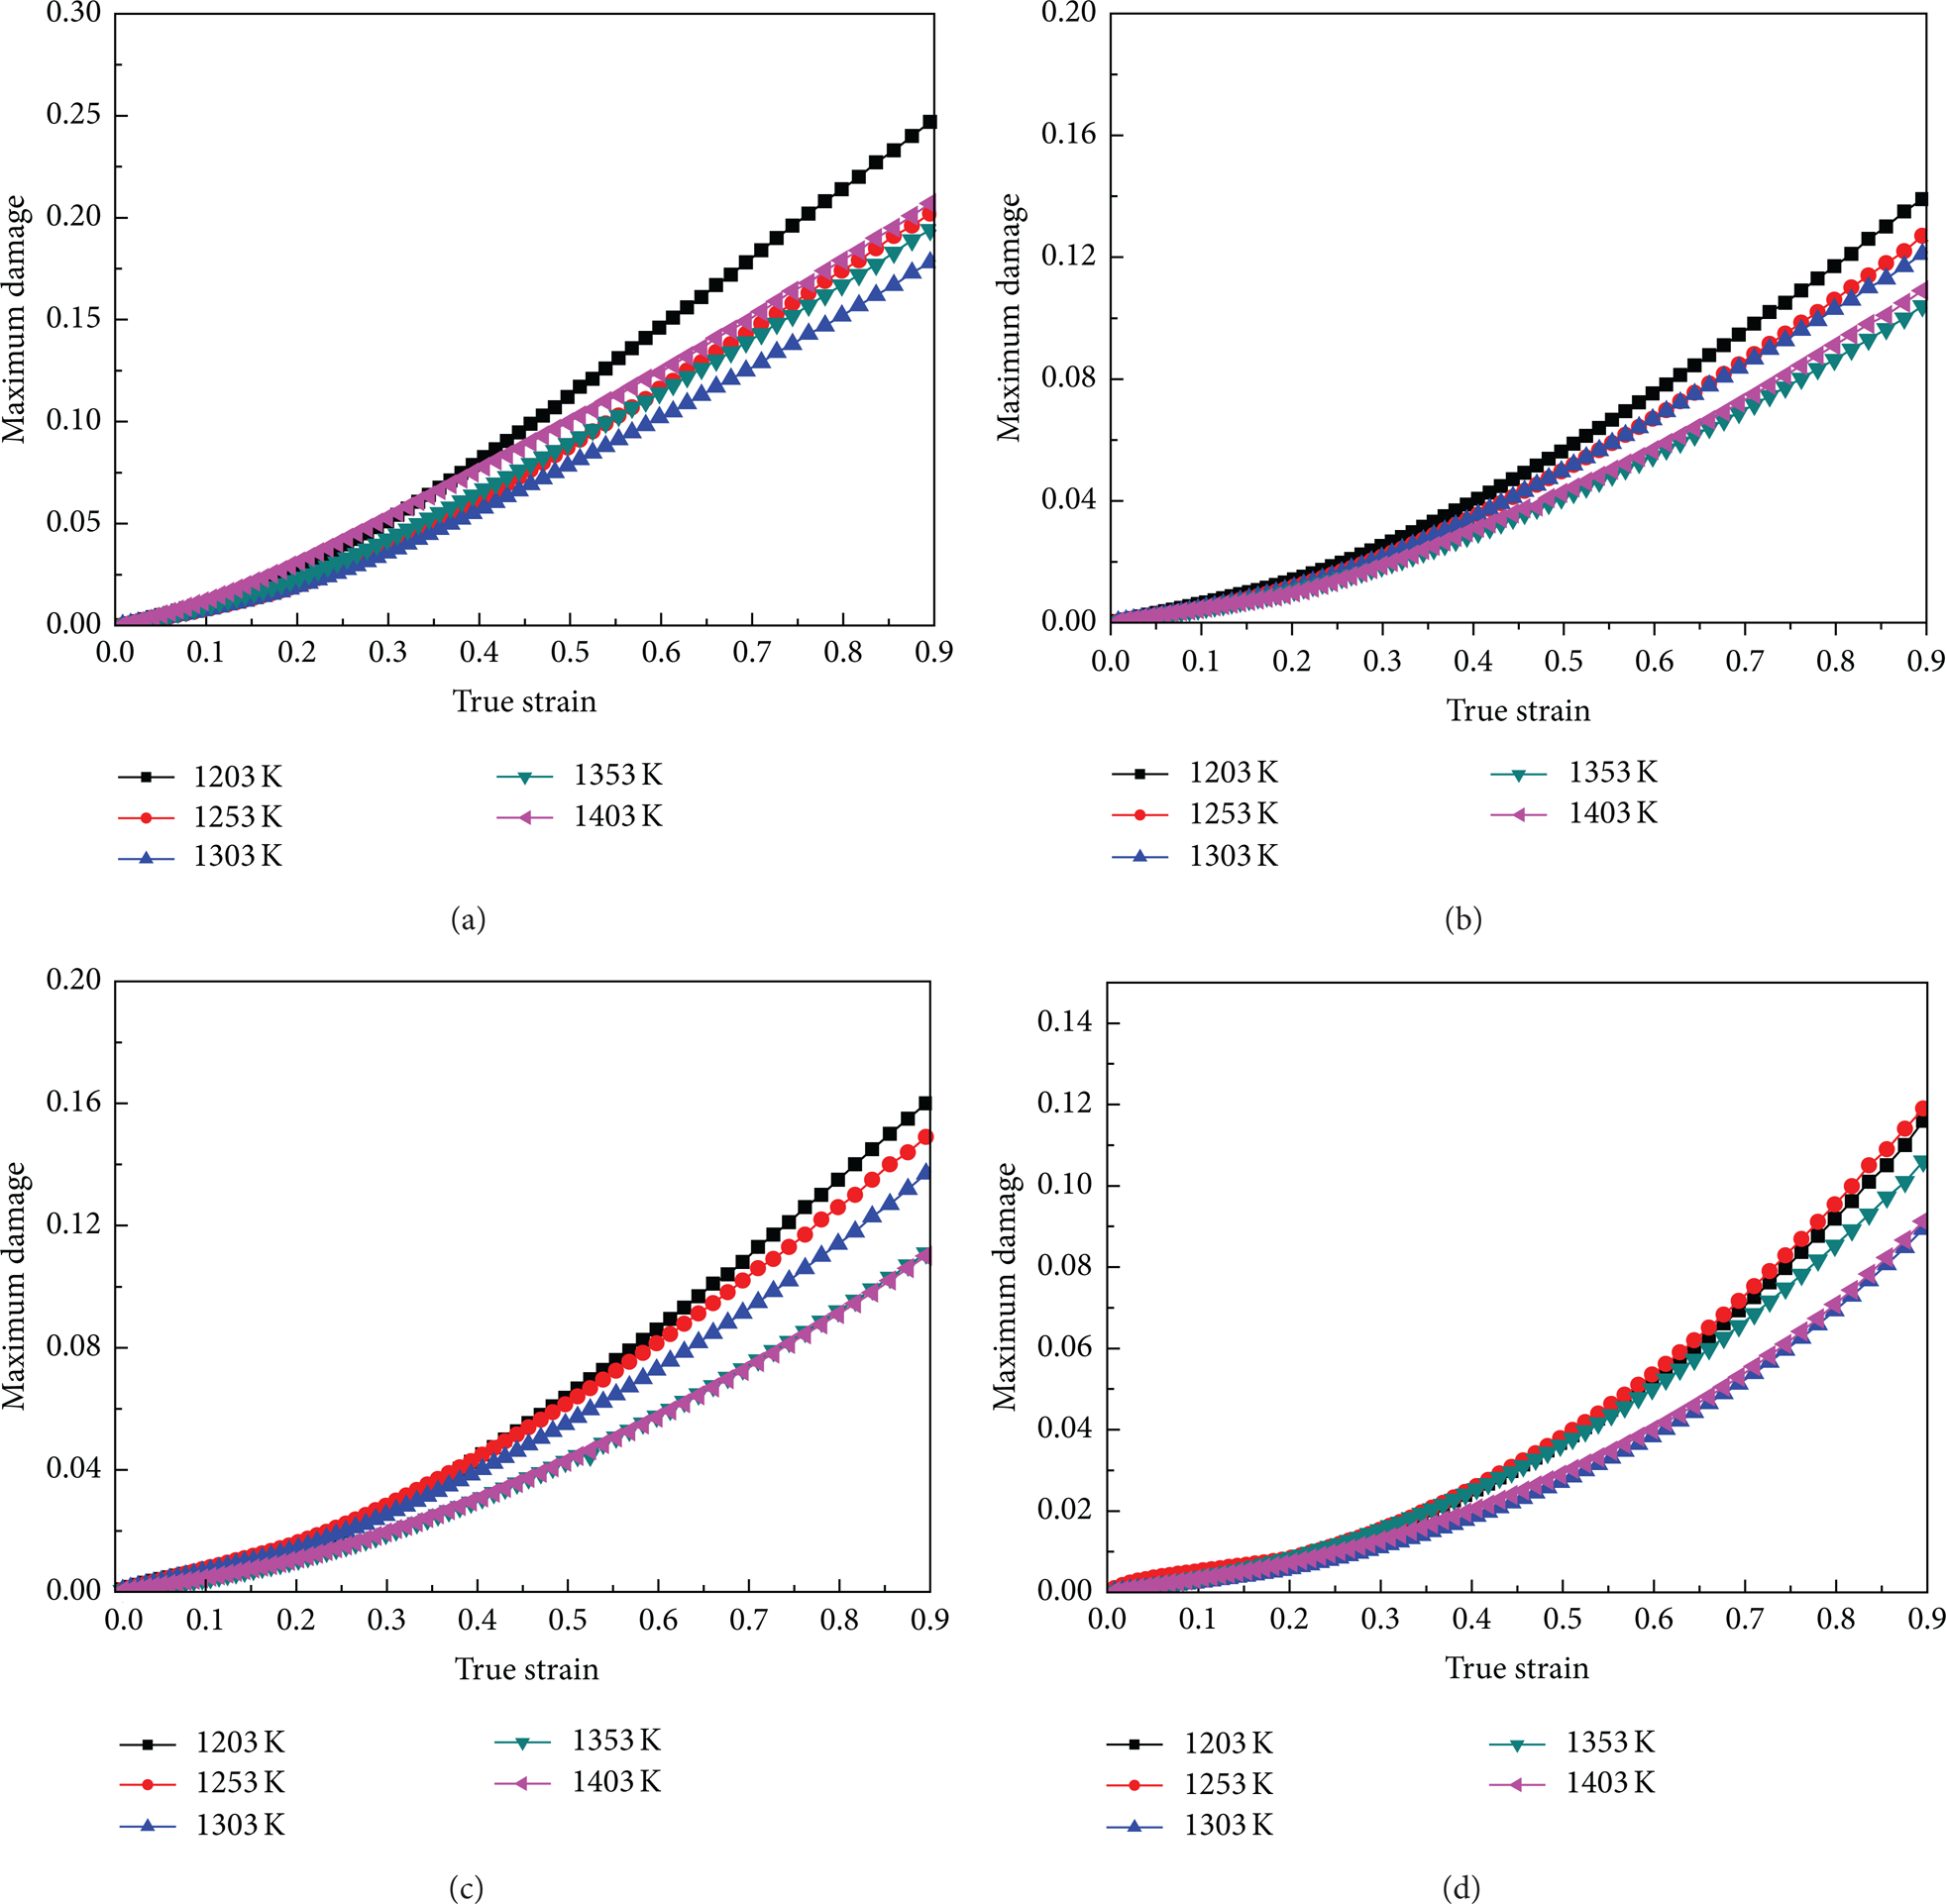
The maximum damage varying during compressing process at different temperatures and strain rates (a) 0.01 s−1, 1203∼1403 K; (b) 0.1 s−1, 1203∼1403 K; (c) 1 s−1, 1203∼1403 K; and (d) 10 s−1, 1203∼1403 K.
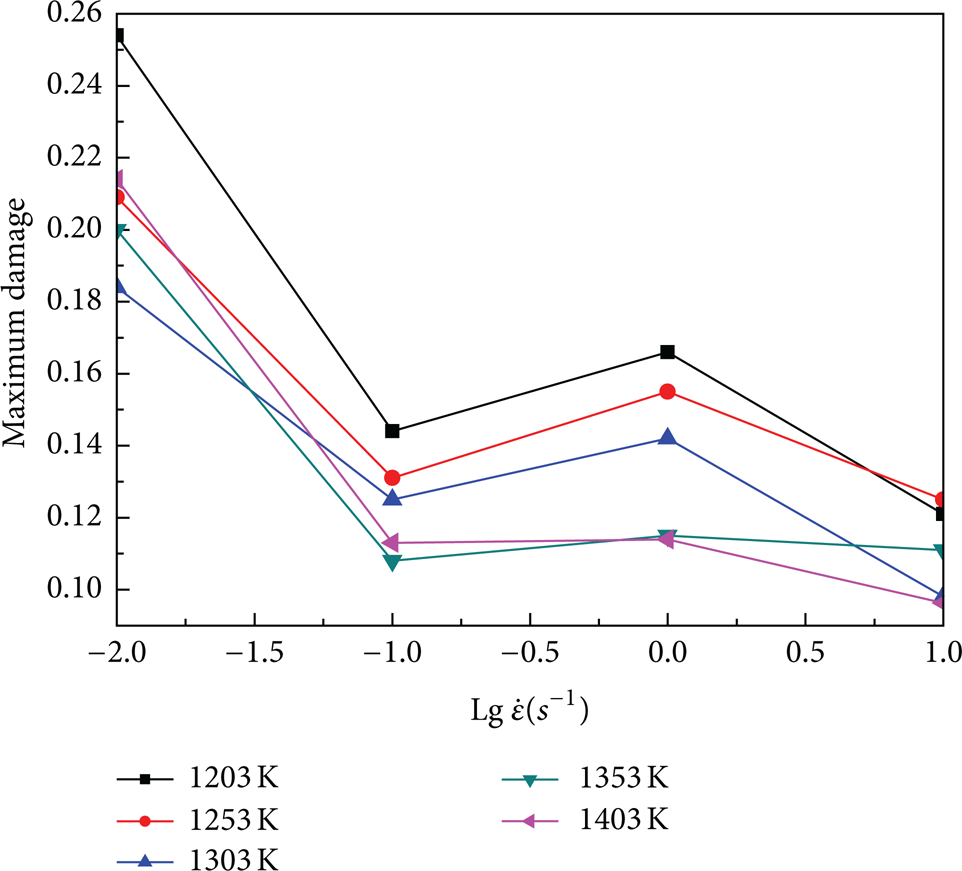
The relationships between maximum damage and strain rates at the end of compressing process.
5.2. Evaluation of Varying Ductile Fracture Criteria (VDFC)
In order to evaluate the ductile fracture criteria, the fracture occurrence and the damage value at fracture time are necessary to be made certain. Based on the damage cumulating processes as shown in Figure 7, the sensitive rates of Cockcroft-Latham damage (as (3)) in plastic deformation (Rstep) at different temperatures and strain rates were calculated and shown in Figures 9(a)–9(d). It can be seen that, for all the deformation conditions, Rstep decreases to the trough point rapidly before true strain 0.1∼0.15, and then it slightly increases in true strain 0.15∼0.2, soon after which it decreases to zero by slow degrees in true strain range 0.2∼0.92. In this study, the zero point has a tolerance of 0∼0.03, and it is assumed as the fracture time in tolerance limits. That is to say, when Rstep decreases to 0.03, it means that fractures have appeared. To find the fracture time, the point arrays after true strain 0.6 are picked out from each incremental ratio varying curve and fitted linearly. The intersection of line fitted and horizontal axis is obtained, and it is made certain as the fracture step.

The variation of damage sensitive rate under different temperatures and strain rates (a) 0.01 s−1, 1203∼1403 K; (b) 0.1 s−1, 1203∼1403 K; (c) 1 s−1, 1203∼1403 K; and (d) 10 s−1, 1203∼1403 K.
As the fracture time has been determined, and then based on Figure 7, the fracture analysis step and the correspondent DFC under different deformation conditions can be evaluated. The contour plot and response surface of DFC in Figures 10(a)–10(b) indicate the nature influence of temperature and strain rate on DFC of 3Cr20Ni10W2 alloy. Figures 10(a)–10(b) show that DFC of 3Cr20Ni10W2 alloy are not constant but change in a range of 0.099∼0.197, and thus they can be defined as varying ductile fracture criteria (VDFC) and described as a function of strain rate and temperature (as in Table 1). In the scatter diagram, there is a valley under the deformation conditions 1273∼1353 K & 0.032∼0.316 s−1, on both sides of which DFC value increases. What is worth explaining is that the forming process will be worse under these conditions due to lower DFC, in addition to which, the deformation domains (1203∼1253 K & 0.01∼0.016 s−1, 1403∼1453 K & 0.01∼0.016 s−1, and 1203∼1228 K & 0.178∼1.29 s−1) with lower fracture risk corresponding to higher VDFC have been identified. Therefore, in bulk forming operations of 3Cr20Ni10W2 alloy, it should choose these deformation conditions to reduce fracture risk.
An approximate analytical formula for the VDFC of 3Cr20Ni10W2 alloy.


The temperature and strain rate effect on the ductile fracture criteria of 3Cr20Ni10W2 alloy: (a) contour plot and (b) response surface.
Comparing Figures 2 and 10, it is clear that the predict results of FEA corresponding to the experiment results. The crack initialization takes place at the edge of the workpiece due to the maximum damage value. Besides, the fracture time predicted based on the VDFC conforms to the experimental results.
6. Conclusion
An innovative approach involving heat physical compression experiments, numerical simulations, and mathematical computations was brought forth to evaluate the ductile damage cumulating process and DFC diagram along with various deformation conditions for 3Cr20Ni10W2 alloy. The main conclusions can be summarized as follows.
As for 3Cr20Ni10W2 alloy, a typical strain-softening material, ductile damage starts at work hardening phase, and the damage cumulation is more sensitive in work hardening phase than in work softening phase. Besides, the maximum damage value appears in the region of upsetting drum, while the minimal value in the middle region.
DFC of 3Cr20Ni10W2 alloy in the temperature range of 1203∼1403 K and strain rate range of 0.01∼10 s−1 are not constant but change with a range of 0.099∼0.197, and thus they have been defined as varying ductile fracture criteria (VDFC) and characterized by a function of strain rate and temperature.
According to VDFC diagram, the exact fracture moment and position during various forming processes can be predicted conveniently and effectively, in addition to which, the deformation domains with lower fracture risk of 3Cr20Ni10W2 alloy have been identified as 1203∼1253 K & 0.01∼0.016 s−1, 1403∼1453 K & 0.01∼0.016 s−1, and 1203∼1228 K & 0.178∼1.29 s−1.
Footnotes
Acknowledgment
This work was supported by the Fundamental Research Funds for the Central Universities (CDJZR12130045).