
Abstract
This paper studies the feasibility of a real-time monitoring system to provide prompt analysis support of workers' behaviour on dam construction sites. The system makes use of wireless sensor tracking technology and a set of servers for the running of software, handling collected data, real-time site state visualization, and remote interaction communications. The low-level ZigBee-based tracking technology network hardware utilizing fingerprinting software technology was employed. The system was found to be able to cover a large field whilst retaining its simple and easily deployable features. The proposed system was successfully implemented on the Xiluodu arch dam construction site and ultimately helped overcome the original shortcomings in worker safety management and has advanced the means of administration and management's awareness and culture to new levels. The field tests also show that the received signal strength indicator (RSSI)-based localization algorithm implemented on ZigBee devices is reliable and is accurate enough at 3 to 5 meters. In conclusion, the system proved to be very useful for the management of field safety worker behaviour analyses in the case of such a high arch dam and also for similar hydraulic projects.
1. Introduction
Sensory technologies have developed quickly and are being utilized in structural health monitoring in civil and hydraulic engineering [1–5]. As result, a great contribution has been made to the control of cracking in mass concrete [5] and to the optimal identification of dams' structural characteristic changes [6].
The major industries of mining and hydraulic engineering, however, still have the poorest Health and Safety (H&S) record compared with all other industries. In China [7], the probability of construction worker fatalities in these industries is higher than that of all other industries, with the economic losses being measured each year in billions. Similar situations have been recorded worldwide. Health and safety control is inadequate in terms of preventing risks which, because of their specific nature, are unpredictable. At present, the health and safety management of people on a large hydroelectric power construction project site mainly depends, on contractor supervision and owner inspections. To better assure the H&S of people in construction, such sole dependence on patrolling officers for control purposes should be reduced and in part replaced by a more objective evaluation of worker effort. Techniques such as the tracking of the location of workers and analysis of workers' behaviour would be a helpful site control inclusion. For example, the availability of an automatic detection and intelligent tracking system, to achieve instant control feedback information such as the warning of the presence of workers in certain zones, is likely to be helpful in this regard. To date, few studies have presented such techniques.
Tracking technologies have attracted the attention of many researchers and engineers in recent years. Several reasons ranging from a basic need for increased awareness of dangers to health and safety, to the development of specific applications for project quality inspection during the execution phase, have justified their adoption on construction sites. In general, all stakeholders (e.g., owners, contractors, architects, engineers, visitors, etc.) would benefit from such systems, in that successful projects are often determined by the achievement of quality linked to the control of worker performance.
Location tracking has already been applied to provide better documentation, analysis, and understanding of the best safety practices and the correction of poorer practices executed in the field. The integration of information technology and sensors networking technology is, in fact, widely applied in worker management systems on construction sites. For example, by using a wireless and untethered tracking technology and a local server running a software tool to handle collected data, real-time site state visualization can be achieved and remote interaction with safety inspectors can be made possible [8]. A proactive real-time safety management system using ultra-wide band technology and implementing proactive virtual fencing logics has been developed by Carbonari et al. [9]. Modern real-time locating systems (RTLSs) use various locating techniques including received signal strength indicator (RSSI), time of arrival (TOA), time difference of arrival (TDOA), and angle of arrival (AOA) [10, 11]. Location sensing for infrastructure management and construction operations, however, has been mostly limited to the outdoor environment, where satellites are in view for positioning information. Radio frequency identification (RFID) technology [12–15] is a low-cost location sensing solution for indoor construction [13, 14] and underground facilities [15], where satellite navigation systems cannot be used. Wireless local area networks (WLANs, or WiFi) have evolved rapidly over the last several years and are becoming increasingly popular. A design of an outdoor WiFi localization system [16] based on a GPS utilizes [17, 18] a rotating unidirectional multielement Yagi-type unidirectional antenna to determine in real time the direction of the maximum signal strength from a WiFi access point [19]. Real time GPS-based outdoor WiFi localization systems with an associated map display have been at the frontiers of research in recent years [20].
In this paper, alongside a system of real-time workers' behaviour monitoring analysis, a methodology based on the ZigBee tracking location model is proposed in detail. A worker behavior analysis model with prewarning components was proposed. An application of this management system was used to support inspectors in charge of the Xiluodu arch dam during the construction period.
2. Methodology and Model
2.1. Position Calculation Method
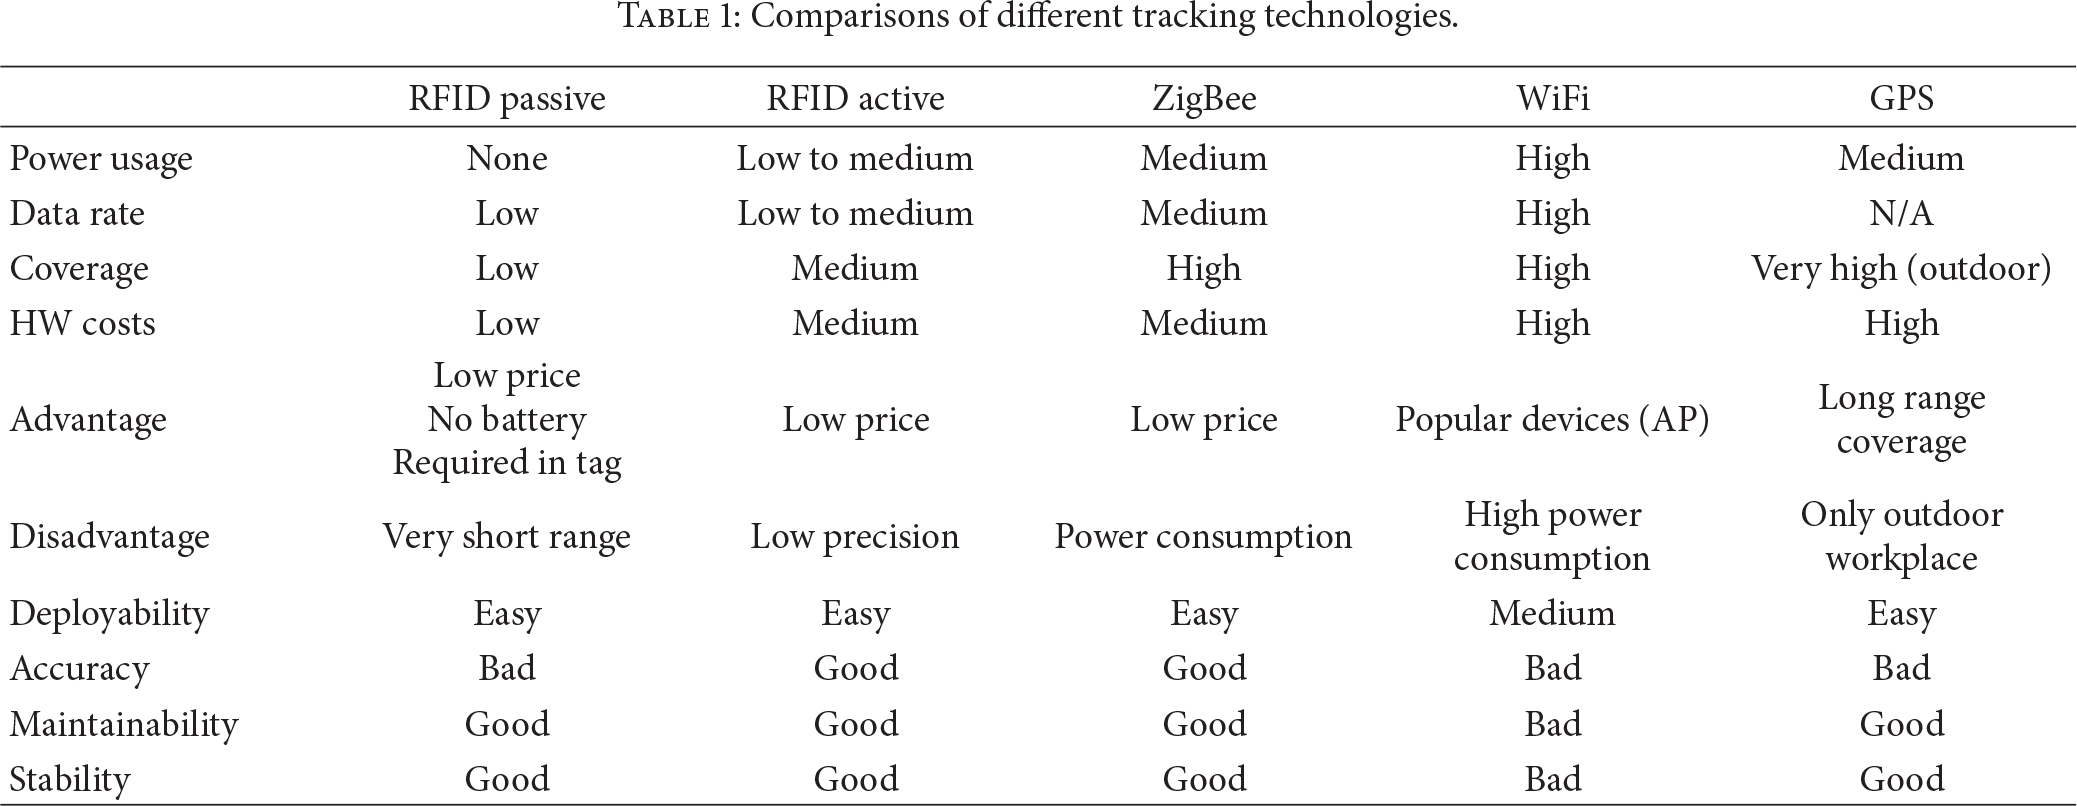
RTLS is an emerging application field that uses physical, geometric, and logical location information concerning people and objects. The location estimation and the tracking of people and objects are the most important tasks among the many constituent technologies in tracking technology. There is a wide range of options for sensor technologies that are suitable for creating an RTLS sensor network. Those options include RFID passive, RFID active, ZigBee, WiFi, and GPS. Choice of the appropriate sensor technology depends upon several factors including cost, environment, infrastructure, latency, and desired accuracy. Table 1 provides a brief and general comparison of these technologies and their advantages and disadvantages relative to their applications within a large construction site. After many extensive experiments on a dam construction site, the ZigBee technology was chosen.
Comparisons of different tracking technologies.
Two major types of localization algorithms were considered in this study. One was a triangulation algorithm, based on an electromagnetic wave propagation model, and the other was fingerprinting which is based on statistical theory and proven industry practice.
Triangulation is the most common technique used to estimate a location; its goal is to map RSSI as a function of distance [21]. However, RSSI signals obtained are very unstable in the complicated and propagation-hazard workplace such as a dam construction site. It is very difficult to achieve accurate relative positioning just by the distance function, or some variations to the function, in the complicated electromagnetic circumstances. Hence, at an early stage of the project, this method was abandoned.
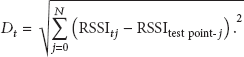
The fingerprinting technique is based on the specific behaviour of radio signals in a given environment, including reflections and fading, rather than on the theoretical strength-distance relationship of the triangulation method. In fingerprinting algorithms, a target node matches points sampled on the RSSI map (fingerprinting) which records the RSSI values of reference nodes with fixed positions at different sampled points with the closest RSSI values to the target [22]. A typical method using RSSI mapping is the k-nearest neighbour (kNN) search [23]. In this algorithm, a dataset of reference node RSSI values at different sampled points is used to obtain an RSSI signature map stored in n-dimensional space. During implementation, the map is stored in computer memory to gain high performance. As moving tags obtain RSSI values from the reference nodes in real time, the system searches the database to search the k-nearest matching data records, also in real time. In order, therefore, to determine target position locations information using the k-data records, closeness (or proximity) is defined as a Euclidean distance calculated using the following equation:
In (1),
For the dam site, the RSSI fingerprint system is shown in Figure 1. There are two separate phases: (1) the offline phase, wherein the RSS fingerprint database map is constructed, and (2) the online phase, wherein real-time localization is calculated and the unknown locations are determined by a matching with the existing RSSI map. In the offline phase, the distance between two nearby anchor points is approximately 1 meter. It is time consuming to construct the fingerprint database.

Schematic flow of RSSI fingerprint system of dam site.
To gain maximized performance, the in-memory database SQLite is used. It is simple to use SQLite in memory mode and to open the database using the special filename “:memory:”. The API call is as follows:
rc = sqlite3_open(“:memory:”, &db).
The fingerprint system core engine records tag data, reference nodes, fingerprint information, and collected real-time positions. The database model (Figure 2) maps these data to individual but normalized tables. Table 2 illustrates each column of the table in detail.
Physical design of key data tables in RSSI fingerprint system.

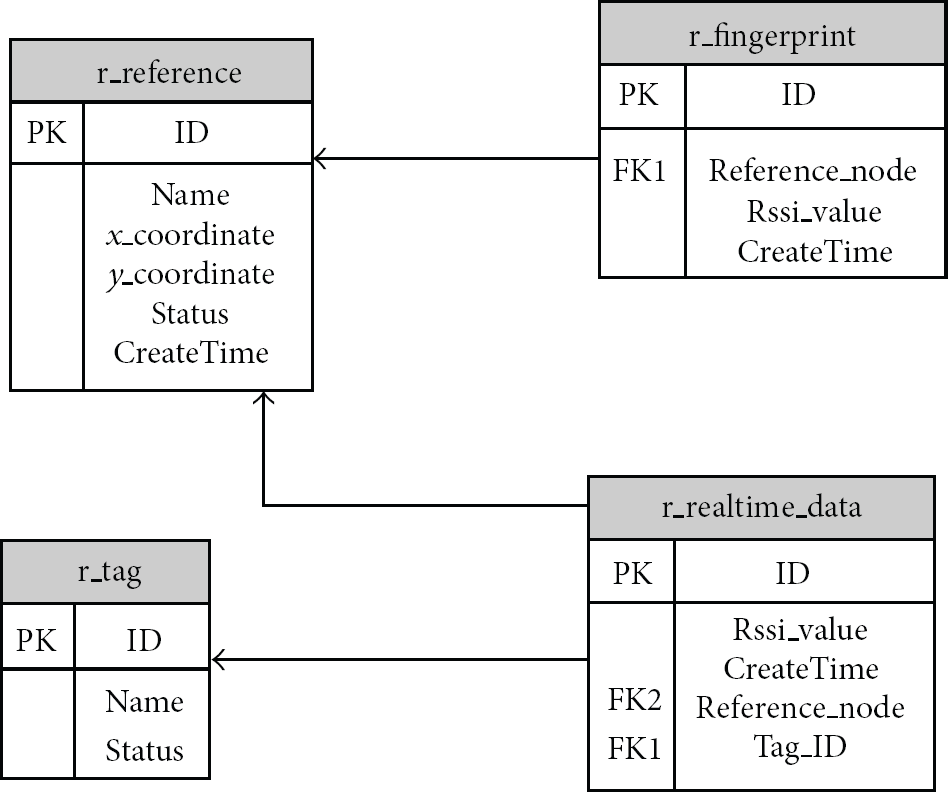
Schematic of database model.
2.2. Behaviour Tracking Analysis Model
Construction site management involves workers, supervisors, contractors, visitors, and owners. How to use tracking technology to effectively manage project personnel on site is an important question in modern management. Automatic movement detection data and subsequent analysis of that data to produce accurate and appropriate information usable by management are relied upon.
User behaviour analysis has successfully made use of different technologies in various industries [24, 25], especially during this Internet age. Internet users frequently receive personalized advertisements from Google or other companies based on very complex analysis systems. On a dam construction site, there is already much knowledge and many rules relating to project quality. In this study, modern sensor technology has been used to make use of this prior knowledge.
For example, a worker had an expected trajectory represented in Figure 3(b), but the actual result is in Figure 3(c). The worker was supposed to spend more time in pouring block 1 than that in pouring block 2. However, he spent all the time on block 2. It means the difference between actual data and expected data. To analyze this behaviour difference data and feedback, the output to other subsystems, such as the HR system, needs to get this result as input to have performance report of the involving worker's salary.

Dam site field behaviour for subsequent analysis.
The worker's behaviour can be analyzed by following the three steps: prepare a predefined trajectory, obtain the worker's trajectory, and analyze.
Prepare Predefined Trajectory. According to the construction work plan, every worker should follow a predefined procedure in each specific workspace so that every worker has a predefined trajectory in the form of a series of data including time values and position values, as shown in Table 3(a).
(a) Worker defined time values and position values. (b) Worker actual time values and position values.

Obtain Actual Worker's Trajectory. In this step, the worker's trajectory data is gathered and prepared as a series of time values and position values as in Table 3(b).
Analysis. There are various algorithms which measure the degree of similarity between two trajectories including Euclidean distance, dynamic time warping (DTW), and longest common subsequence (LCSS). For this step, to simplify the computing procedure, Euclidean distance was used to measure similarity.
If two sequences, c, 
The result is stored in a database and is fed back to other subsystems, such as HR via a web service interface.
If the two sequences do not have the same length, one sequence must be resampled.
This methodology can also be used in other cases, for example, to compare the performance of coworkers in the same group (similar duty and similar trajectory).
In the following scenario, worker group A and worker group B are supposed to be working at the same place and should work closely together, as shown in Figure 4(a). Actual scenario were that worker group A and worker group B worked at different pouring block, illustrated in Figure 4(b).

The behaviour analysis of different worker teams.
There are many dangerous places on a dam construction site. The positions of every worker who comes close to such places are filed into the system. If the records accumulate to a certain level, alarms are triggered automatically and safety officers are notified. The types of alarm levels are illustrated in Table 4.
The types of alarm levels.

In the other cases, to improve the quality control of concrete block pouring, the trajectory should be well distributed, as shown in Figure 5. The actual results show that workers spent most of the time pouring concrete in the block corner, probably spending time on matters other than pouring concrete. Not only the workers, of course, but also plant trajectories can be tracked and analyzed. To achieve a high quality mass concrete structure, concrete vibration plant should follow a predefined trajectory.

The behaviour analysis of worker positioning.
3. Description of the Real-Time Monitoring System
3.1. Overview of System
This system focusses mainly on providing automatic capture of real-time object multimovement data which can be used to analyze the action characteristics of workers on a dam site. Figure 6 is a schematic of the action information acquiring, collecting, and analyzing the system. It includes (1) fixed reference nodes (ZigBee-based) installed in the pour concreter dam pavement (see Figure 9(a)); (2) the installed Gateway (ZigBee-Ethernet); (3) moving nodes carried by the workers themselves used to track personnel movements; (4) a router firewall; (5) a database server; (6) client to see the map of worker movements in real time; (7) the GUI client to management system; (8) the location server which runs the locating engine; (9) a location App Server which runs the safety management software; (10) a GIS Server which provides a vector map facility; (11) a fingerprint data server which stores the fingerprint data.

Component overview of the real-time monitoring system.
3.2. System Features and Functions
As previously stated, dam construction sites are very complex working environments, due to their dynamic nature and the concurrent involvement of numerous resources and supply components. The system described in this study has been provided with a first set of features, as illustrated above in Section 3.1. There is a potential for extension to further services, based on the same basic concept relying on real-time control. The system includes both the control logic and hardware wireless systems for real-time resources tracking, as shown in Figure 7. In particular, it is assumed that the first edition of the work plan includes the list of tasks and work teams to be employed. Therefore, given a list of the teams present on site during each work phase, the predefined position coordinates of workers provide all the relevant data and select the areas in which each worker or team is allowed to operate or pass through. Monitoring of worker behaviour is then accomplished using the following logic. If one or more workers are found to operate in the area without being explicitly authorized, on the basis of the input provided by the work plan, a warning message is generated. In addition, the system records all worker trajectories even when they are not in dangerous zones. The collected data is then used by coordinators and inspectors to analyze the actual progress of work on site and to promptly identify possible deviations from what had been planned. The tracking system must continuously collect resources positional data on site during work progress. It is worth emphasizing once again the ability of the system to act in a way which not only prevents interference, but also signals deviations from the planned schedule, allowing the work planners to become quickly aware of the need to update the plan. This system is one of closed-loop control with the ability to learn from experience and self-adapt.

Logic approach to monitor worker behavior.
The main functions of the system are as follows.
Worker positioning data service: worker position data can be stored consistently utilizing any modern database such as Oracle and Microsoft SQL Server. Other systems provide positioning service via the Web. The system of this study is designed to be flexible and to provide a quick response even when the demand loads are heavy. Alarm and warning service: a worker can issue a critical alarm actively by pressing his tag emergency button; the control center can show the local concerned and the warning information. When a worker enters a dangerous or forbidden, zone, an alarm message will alert both the worker and the safety inspectors. When worker trajectories deviate from those planned, the system triggers warnings of the appropriate types.
3.3. The ZigBee RTLS Software Interface
The ZigBee RTLS software includes server software, PC client software, and Web interface. The server software consists of (1) location engine server: Real-time position calculations of tags using the fingerprint mapping algorithm; (2) management of all tag configurations and diagnosing functions; (3) system administration: user management, system level parameters, and others; (4) data import, export, backup, and restore; (5) Web mapping service (WMS) standard compliant map server, storage and spatial data display and any client can use the map service by embedding a JavaScript snippet into the standard html page; (6) the entire log and diagnosis information that can be configured into different catalogues and levels; the output destination can be selected from local disk file; TCP/IP socket is for facilitating Web services; (7) fault tolerance and load balancing; One server's fault will not lead to failure of the whole system as the faulty server can be detected and isolated from the whole system and the system load can be distributed to other servers according to resource usage (CPU, memory, disk, etc.); (8) message server, and user-defined messages including warnings and alert information to workers which are dispatched and delivered.
ZigBee RTLS Client software interface, shown in Figure 8(a), is a typical windows platform application written in C# 4.0 and NET Framework 4.0. There are five areas as follows: (1) the toolbar area contains the functions from left to right of “real-time monitor,” “real-time alarm,” “information collection,” “historical trace” “special zones,” “attendance management,” “user management,” “device management,” “workers management,” “system management,” “system setting,” “lock;” (2) shortcut navigation area such as the Microsoft Outlook navigation panel; (3) main show area, where a selected area on site and the workers can be shown with zoom in and out operations; (4) alarm indication area, whereby colour changes indicate alarm levels; (5) status bar and notification area of system information which are divided into sections, each of which shows a different type of information including current operations, the current user, current linkage status to server, and current notification message.

ZigBee RTLS Client and Web software interface.

Install ZigBee-based devices in dam construction site.
The main functions are as follows:
GIS map: shows tag real-time data on a GIS map allowing zooming in and out; data query: query a tag's current and historical position data; zone management: classification of worker locations in the different types of zones. Assignment of workers to their appropriate zones. If a worker enters the wrong zone, the system raises an alarm; user management, authentication, security, and system usage logging functions; worker behaviour analysis and assessment; reporting system status and worker assessments.
The Web interface is similar to the client software interface, but it is also able to provide access for both a PC and other Internet surfing devices such as tablets and mobile phones as shown in Figure 8(b). It was developed using ASP.NET MVC 4 and the modern metro UI style. Popular Web browsers including IE 8.0+, Mozilla Firefox, and Google Chrome have been tested and verified. In addition, Ajax technology has been extensively used to achieve the best user experience.
4. On-Site Test Case
4.1. The Construction Site Setup
The Xiluodu hydroelectric power station [26, 27] is the second largest in China and can produce 13.86 million kW of power. This is close to the capacity of the Three Gorges hydroelectric power station. The project is located in the Jinshajiang River, in Leibo County of Sichuan Province. The total amount of concrete poured is about 600 million cubic meters, and the total length of the tunnel is about 100,000 m. Many workers are engaged in the concreting of blocks and tunnels, and the implementation of the proposed system has an important significance, therefore for the control of the quality of the concrete and the scheduled progress.
Figure 9 shows the system installed at the Xiluodu dam site. The four numbered reference nodes, 155 #, 156 #, 157 #, and 158 #, were installed at the four corners of no. 29 monolith and no. 18 block in that monolith. The gateway platform was installed on the right bank at El.610 m. After setting up the system, on-site commissioning was carried out. Each reference node and each gateway were basically stable and the signal transmission between reference node and moving tags was in good condition. Personnel positioning displays were able to achieve a data refresh interval of 8.75 seconds. Commissioning requirements were therefore satisfied.
4.2. Discussion on Behaviour Trajectory
Figure 10 shows one worker's trajectory between entering a concrete pour block at 20:39 on Jan. 3 2013, to leaving the block at 8:26 in the next morning. The system monitored activities were within location 281. The location information can be customized once the beginning and ending time of the positioning information has been defined. The tracking lines shown in Figure 10(a) illustrate that the worker has finished his job according to predetermined plan at a predetermined place. The activities within the scope of detailed trajectory text descriptions can also verify the conclusion. A total of 281 active positioning message information, seen in Figure 10(b) (only information about the part-time segment), is the original data and can be exported and used by other analysis tools. The test application shows real-time monitoring system for worker behaviour, which functions by checking whether any worker operates within a predetermined place or a forbidden area is feasible, while following the predefined work plan. If emergency situations occur, the worker can trigger an emergency call for help. The safety officers can take emergency measures as appropriate, taking account of prearranged planning.

Workers history orbit.
4.3. Localization Accuracy Analysis
Based on this field test, the real-time worker monitoring system gives relatively accurate position coordinates data. The field test also showed that the RSSI-based localization algorithm implemented by ZigBee devices is reliable and is accurate enough for the tracking purpose. The tracking accuracy is 3 to 5 meters within the coverage range of the tags carried by worker, even if obstacles are interposed between blind tags and routers. The system objective of this study, for a large dam construction site, does not require very precise tracking. In fact, it performs a kind of zone level of accuracy as opposed to tracking the exact point. In other words, it estimates those workers present within a given area. Other applications, where more accurate localization is needed (e.g., for collision avoidance, hazards generated by objects falling from heights), were not considered in our study. For that reason, the ZigBee-based approach of this study was preferred, since it offers two important benefits: firstly, its reference nodes are battery-operated, small, and solid and are therefore easy to deploy as dam concrete pouring rises; secondly, the wireless sensor networks make up a mesh communication tree which is self-reconfigurable when routers are added, taken away, or moved about. Hence, the reality of dynamic changes to schedules as time advances presents no problem to the system.
5. Conclusions
This paper presents a real-time worker behavior monitoring system based on ZigBee-based tracking technology. The proposed idea offers an effective and efficient alternative for acquiring knowledge useful for supporting the decision-making process to evaluate worker behavior in real time.
The users were allowed to identify the factors, most influential to the system's successful implementation. The following has been established for management use: (1) dam construction worker behavior, (2) online real-time monitoring over the whole work area, (3) an evaluation system for early warning and forecasting refinement for the owners of construction quality and worker safety management, (4) rapid response to any quality and safety problems, (5) effective control of safety and quality, and (6) the implementation of worker behaviour analysis following the acquisition of the real-time monitoring data.
To achieve the online, real-time, intelligent tracking identification feature, the monitoring system included many functions such as the worker emergency call facility, a track history of what actually happened, and the ability to query what is happening in a specific location. The field test showed that the RSSI-based localization algorithm implemented on ZigBee devices is reliable and sufficiently accurate.
Footnotes
Acknowledgments
This research work was supported by the National Natural Science Foundation of China (no. 11272178), National Basic Research Program of China (973 Program) Grant nos. 2013CB035902 and 2011CB013503, Special Foundation for Public Welfare Industry of the Ministry of Water Resources (2010001035), Tsinghua University Initiative Scientific Research Program, and Foundation of State Key Laboratory of Hydroscience and Engineering (2011-KY-3). The authors are very grateful to the China Three Gorges Corporation for allowing access to one of its construction sites.