
Abstract
A model water turbine draft tube containing vortex generators (VG) was studied. Numerical simulations were performed to investigate 55 design variations of the vortex generators in a draft tube. After analyzing the shapes of streamlines and velocity distributions in the tube and comparing static pressure recovery coefficients (SPRC) in different design variations, an optimum vortex generator layout, which can raise SPRC of the draft tube by 4.8 percent, was found. To verify the effectiveness of the vortex generator application, a series of experiments were carried out. The results show that by choosing optimal vortex generator parameters, such as the installation type, installation position, blade-to-blade distance, and blade inclination angle, the draft tube equipped vortex generators can effectively raise their SPRC andworking stability.
1. Introduction
The efficiency of modern hydropower turbines is quite high (95%) [1]. Even a small improvement on current efficiency will likely confer a significant benefit for the industry. This is, especially true in relation to the runner and draft tubes which play a crucial role in reducing the losses from medium and low headed turbines [2]. The draft tube, as an energy recovery part, is located downstream of the turbine runner. It decelerates the flow speed, so that excess kinetic energy can be converted into static pressure, thus increasing the efficiency of the turbine [3]. However, its working efficiency and stability are generally decided by flow patterns inside the tube [4]. Poor draft tube design may lead to separated and unstable flow inside the tube, reducing the efficiency and stability of the turbine system. In addition, the flow pattern is hard to measure directly and simulate quantitatively because of the complexity of flow including vortices and secondary flows [5–7].
A vortex generator (VG) is a tiny triangular or rectangular fin, located at a surface with an angle to the incoming flow [8]. A VG is a boundary layer controller, which can induce vortexes. And these vortexes will accelerate high-energy free stream flow to the surface, rather than detaching or separating from the surface [9]. The VGs have been used in applied aerodynamics on airplane wings since 1947 [10]. However, applications of VG in hydrodynamics are quite rare, especially in the draft tube.
Numerous methods have been used to improve the static pressure recovery coefficient (SPRC) of draft tube, for example, adding up gas [11], changing the inlet velocity profile [12], installing jet injections [13–15], installing a splitter [16], and so forth. However, there is no standard method to improve the SPRC of hydropower turbines.
The internal flow in individual or complex part of hydraulic machinery can be simulated by computational fluid dynamic (CFD) [17]. The accuracy of main flow features predicted by CFD is quite high [18]. The validity of CFD is verified in the turbine and draft tube, and it is also considered as an effective way to improve water conservancy machineries [11, 12, 19].
In this study, CFD commercial software CFX 11.0 from ANSYS has been chosen for numeric simulation [20]. The functional mechanism of the vortex generator (VG) in aerodynamics was adopted in hydrodynamics using a model draft tube with VGs. Numerical flow simulations were used to investigate many VG layout options in the model draft tube, and an optimal model draft tube was found. The optimal layout was confirmed by experimental measurements. The influences of the VG layout details on the flow field and the draft tube SPRC were also analyzed.
2. CFD Numerical Simulations
2.1. Geometric Model
The draft tubes are usually expanding tubes or diffusers. The boundary layer flow of a draft tube tends to separate from walls, leading to a lower SPRC. For the convenience of the experiment, a diffuser was chosen as the model draft tube (Figure 1). Two organic glass plates (thickness: 10 mm) were installed on the sides of the diffuser to visually observe the flow pattern as well as conduct measurements. Since the diameter of the testing platform pipes is 300 mm, a convergent section was attached to the expanding section of the diffuser to fit into the test rigs pipes.
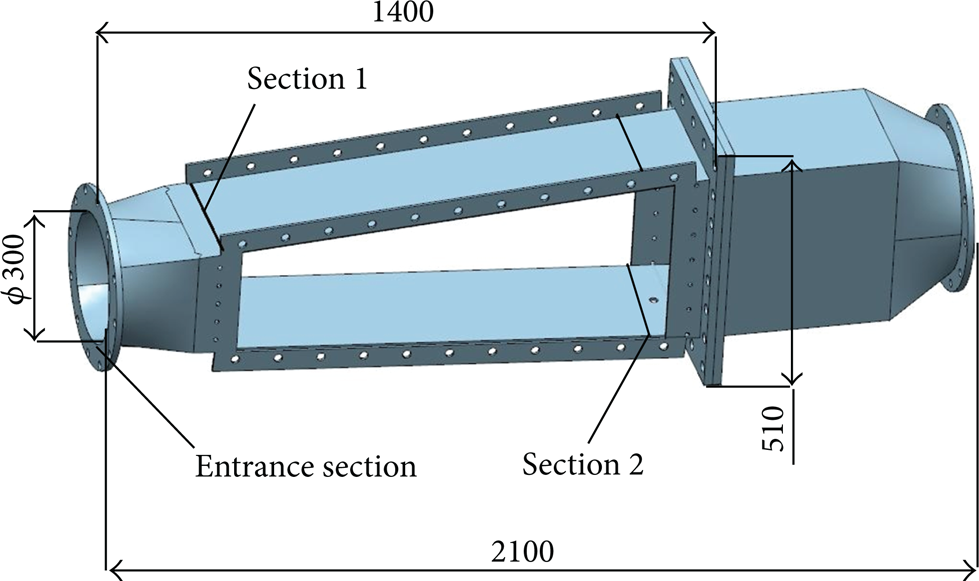
Designed draft tube: Sections 1 and 2 are the measuring section. The water flows from left to right, so the left side coupling flange section was the entrance section, and the VG installing holes were set on the diffuser plane.
The length of the model draft tube was 2.1 m, with a divergence angle of 18° [21]. For installing the vortex generators, there are four pairs of screw hole on each expanding surface, with a distance of 50 mm between each two pairs and 25 mm between two holes in each pair [22, 23]. The distance between the entrance section and the section holding the vortex generators was 0.25 m and 0.79 m, and these two sections were named as vortex development section (VDS) and vortex formation section (VFS), respectively. Also, two measuring holes were created on one expanding surface to measure the inlet and outlet flow properties. The two holes represent two measuring sections, namely, Sections 1 and 2, which were located at distances of 0.20 m and 1.375 m from the entrance section, respectively. The VGs were actually a group of triangle fins, having length of 25 mm and height of 5 mm, respectively. The fin thickness was 1 mm. The installation angle (IA) is represented as α. The distance between each pair is represented as D while the distance between two blades in each pair is d (Figure 2), and the distance between blades and the wall of draft tube is 25 mm. The distances between blades are outlined in Table 1.
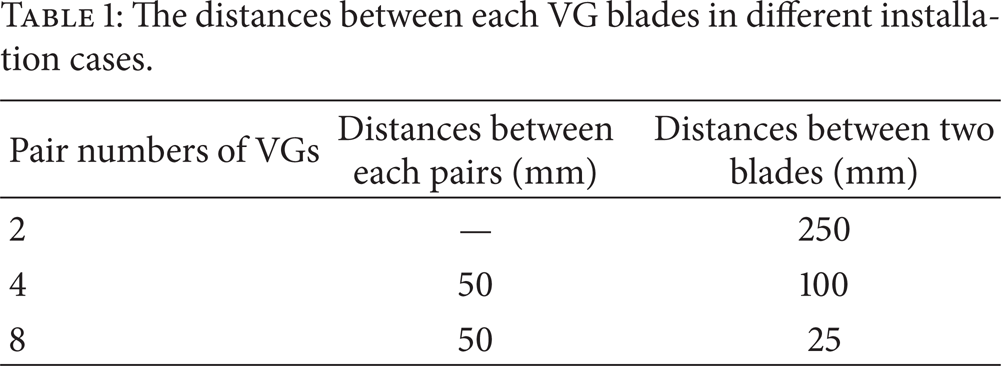
The distances between each VG blades in different installation cases.

The size and installation of vortex generators.
2.2. Full-Ported Structure Grid
Hexahedral cells were generated (Figure 3) for the whole computational domain using Gridgen15.16 [24]. The present grid has 1.66 × 10⁶ cells in all. When the cells number is 3.32 × 10⁶ and 6.64 × 10⁶, the flow rate differences at Section 2 between these models and the present one are 1.04% and 1.92%, respectively. If the grids number is 0.83 × 10⁶, the flow rate difference is 28%. So, the grid size used in the present study is suitable to model the draft tube.

Full-ported structure grid of the draft tube.
The draft tube is composed of three basic parts: the entrance part, the exit part, and the installing part of vortex generator. To ensure that most of the wall cell y-plus falls within the reasonable range, the thicknesses of the first cell from the wall of the three parts are set as 0.4 mm, 0.4 mm, and 0.2 mm, respectively. The size of grids cell is growing as the distance from wall is increasing, so the maximum grid thickness reaches 38.2 mm at the centre of channel. All the values of y-plus were below 45 from ANSYS 11.0, ensuring the quality of the viscous flow simulations.
3. Numerical Simulation
3.1. Static Pressure Recovery Coefficient
The performance of the draft tube can be judged by the static pressure recovery coefficient (SPRC) [25, 26], which can be defined as follows:

where η w denotes the SPRC, P and v are the section average pressure (Pa) and velocity (ms−1), respectively, ρ is the density of pipe water (kgm−3), and the subscripts 1 and 2 represent the measuring Sections 1 and 2, respectively.
3.2. Turbulence Model and Boundary Conditions
Selection of the suitable turbulence model is key to achieving accurate numerical simulation of a flow field. Although the
At the boundary conditions, the inlet flow was water andthe mass flow-rate was 110 kgs−1 (Re = 4.67 × 10⁵); outlet relative pressure was set to 0 Pa, as it is relative pressure; all the other boundaries were set as no slip wall. Residual error of CFX here was set as 10−6. The reference pressure of the flow was 1 atm, and there are no buoyant forces considered. Sections 1 and 2 were defined as Interface in CFX-Pre, as well as (1).
4. Calculation Results and Analysis
In the test model draft tube, the number of pairs (NP) for VGs in draft tube can be 2, 4, and 8 while the installation angle (IA) can be 10°, 15°, and 20°. The installation section (IS) can be vortex formation (VFS) or vortex development (VDS) (Figure 4). The main VG array configurations (AC) can be divided into two types: one for producing counter-rotating, the other for corotating vortices. The corotating type can be further divided into two subtypes: left incline and right incline.
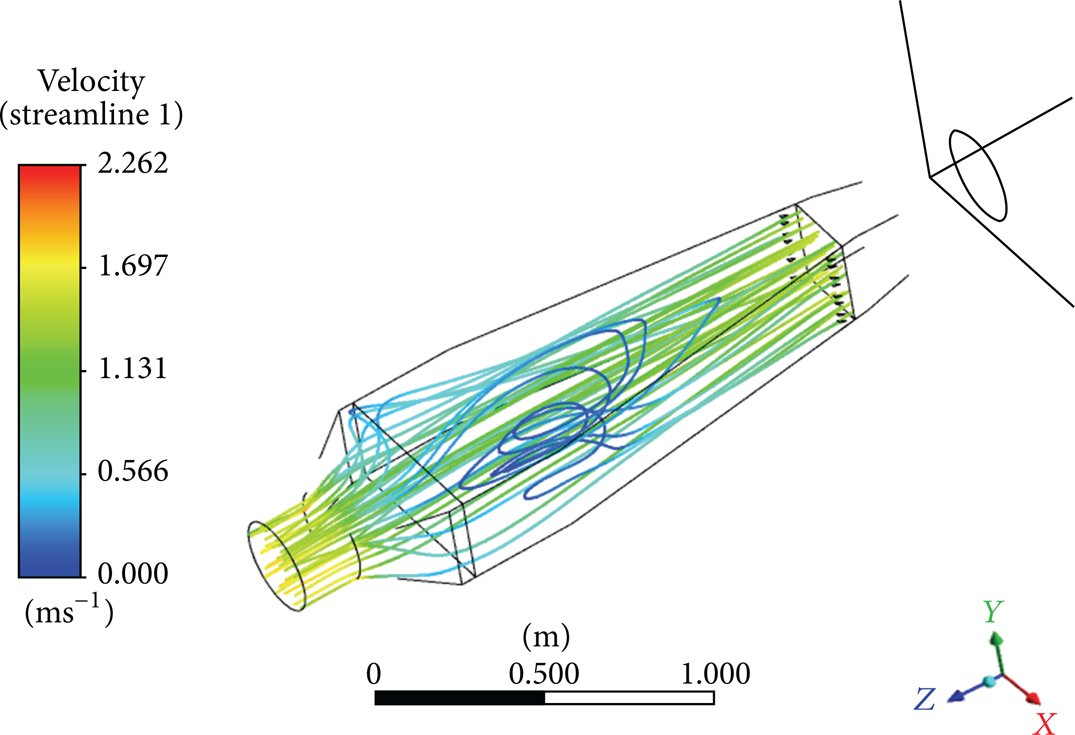
The streamline of draft tube without VG the two rectangle sections in the draft tube are Sections 1 and 2, separately. VFS and VDS are the vortex generator installation sections.
Different VG installations can produce different internal flow pattern so that they can affect SPRC quite distinctively. Numerical simulations were performed for the model draft tube with all 27 types of VG installation at VFS and 27 types of VG installation at VDS, as well as for the model draft tube without VG. In the iteration setup, the RMS residual for judging the convergence was set to 10−6. The computed SPRCs had small fluctuations during the iterations. Therefore, the averaged values during the last 300 iteration steps were taken as the final values which are shown in Table 2.
SPRCs of experimental draft tube.

All the values of SPRCs are percentages, the capital words in the title are the abbreviation of these parameters, AC: Array configurations, IA: Included angle, NP: Number of pairs, IS: Installation section, VFS: Vortex formation section and VDS: Vortex development section.
When positioning the vortex generators at the location of the vortex development section, the SPR coefficients of the draft tube decreased by 7 to 15.4%, independently of the amount of VGs used or of the values of their installation angle (Table 2). However, if the vortex generators were set at the vortex formation section (VFS), an increase of SPR coefficients by up to 4.8% was seen in 10 out of 27 configurations (Table 2). This shows that putting the vortex generators at the location of vortex formation section (VFS) had a greater ability to raise the SPRCs than putting them at the location of vortex development section (VDS).
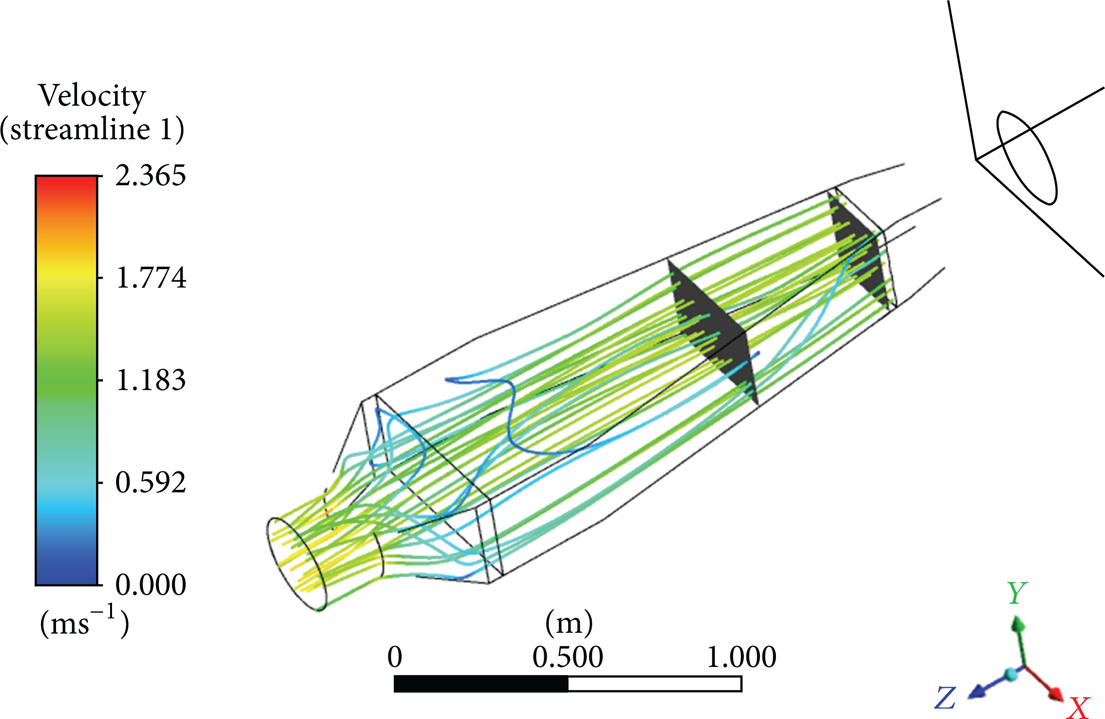
The scheme with 2 pairs counterrotating VG, with a 15° included angle, installed at the vortex formation section (80.1%), displayed the biggest increase (4.8%) compared with the situation without VG (75.3%). And, in the cases of corotating, NP = 8, IA = 15° and 20°, and IS = VFS, the SPRCs increased by 4.2 and 3.1, respectively. The internal 3D streamlines in the installation scheme without VG (Figure 4) and these three schemes (Figures 5, 6, and 7) are quite different.

The streamline of draft tube with optimal VG.

The streamline of draft tube in case of NP 8, IA 15°, left incline corotating VG.
The streamline of draft tube in case of NP 8, IA 20°, left incline corotating VG.
Comparing with these four figures (Figures 4, 5, 6, and 7), it is apparent that in the draft tube without VG, internal streamlines show sign of strong flow separation. There are lots of backflows and vortices inside the draft tube, and there are also some backflows and vortices in the cases of corotating. In the cases of AC = counter rotating, NP = 2, IA = 15°, the streamlines in the draft tube are mostly smooth lines, showing almost no backflows after installing the VG, and the stability of draft tube, in this case, is much better than the others. Therefore, the scheme which has 2 pairs counter rotating VG with 15° angle, installed at the vortex formation section, is the optimum case.
Compared to the velocity distribution of Section 2 in these two cases, the optimum case also showed a big improvement. Section 2 of the draft tube without VG (Figure 8) is very uneven, with the zone having the maximum value of velocity deviating from the center of the section. There exists a large scale of very low speed zone (the zone with velocity close to zero) near the walls. The distribution of this chaos flow is apparently asymmetrical. Its velocity contours have the approximate shape of triangle. Section 2 of the draft tube in optimum case (Figure 9) is relatively more uniform, with the maximum value zone of velocity distributed around the center of the section. Here the very low speed zone disappears and the velocity contours have a more smooth spherical shape.

Velocity at the exit of draft tube without VG: the midline of the section is the measuring line of flow velocity.

Velocity at the exit of draft tube with optimal VG: the midline of the section is the measuring line of flow velocity.
Vortex generator can generate some small vortices in fluid dynamics, and these vortices can influence the flow in the draft tube. The trailing vortices started from the section at a distance of 1.415 m from the entrance section, when the VGs were installed at the section which has a distance of 0.25 m from the entrance section (Figure 10). When they were installed at 0.79 m from the entrance section, the trailing vortices were chaotic, even for an integrated vortex which had not been generated. It can be surmised that (1) the installation angle of VGs can be a certain guider of these trailing vortices direction; (2) if the flow induced by VGs develops fully, the trailing vortices are more sharp than the other. In addition, the corotating vortices may form large, unfavorable vortices, causing additional asymmetry in flow pattern. Therefore the counter-rotating VGs can enhance the stability of working draft tube, since vortices counteract with each other, forming large which vortices become more impossible.

Trailing vortices induced by VGs.
5. Experiment
5.1. Methods
The experiment was carried out with the purpose of verifying that SPRC of the model draft tube can be increased by the optimal VG installation (PN = 2, IA = 15°, andAC = counterrotating). The experiment was conducted on an experimental platform (Figure 11) like a circulating water tunnel, in which the test section is the model draft tube. The flow was driven by a pump which was in turn driven by a motor adjusted by a variable-frequency controller. Metering equipments used include a flow meter, several microdifferential pressure transducers (HAIGE 1151DR, China), and two Pitot tubes. The differential pressure transducer (err ± 1.5 Pa) was used to measure the pressure difference between two sections. The Pitot tubes (err ± 0.01 ms−1) were used to measure the flow velocity inside tube at Sections 1 and 2. The model draft tube was connected with the test rig via flanges. VGs were manufactured from galvanized iron sheet (thickness 1 mm). They were formed as a shape of right triangle (lengths of 25 mm and height of 5 mm, resp.). They were welded to bolts which can be rotated to adjust the installation angle. The joints were filled with waterproof gaskets and waterproof glue to prevent leakage (Figure 12). Supply voltage of variable-frequency pump was 380 V and maximum pump power was 8000 W.
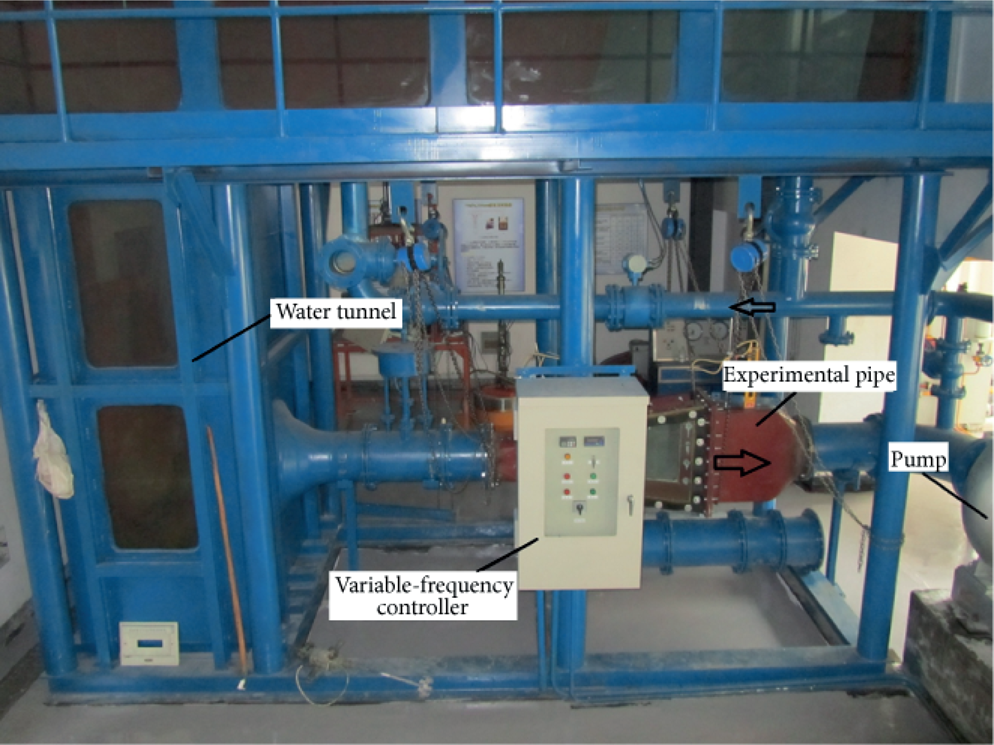
Synthetical experimental system.

Installed vortex generators.
The Pitot tubes in Sections 1 and 2 are named 1 and 2, respectively. Pitot tube 1 was fixed, in order to measure the velocity of “Section 1”; Pitot tube 2 was able to move across Section 2 along a midline. During the measurement, Pitot tube 2 moved from one side to the other side as a step of 5 cm except the last one (the last moves 2.5 cm), resulting in 13 measuring points in all. There is a hole in the entry section of each Pitot tube, which is connected with differential pressure transducer.
Section 1 is a circle where the average velocity can be determined from the measured center velocity by assuming that the pipe flow is fully developed. Section 2 was a rectangle, and as such the area average velocity could not be measured directly. To get the area average velocity of Section 2, the rectangular crosssection was assumed to be an equivalent circular crosssection and the midline measuring points were converted into equivalent radial points to get an average velocity.
The pressure difference between the two sections was measured by a microdifferential pressure transducer. The average of 200 measurements was taken as the measured value of differential pressure. The frequency of the transducer is 1.5 HZ, and each measurement lasted about 2.2 minutes.
5.2. Results
With the methods discussed above, the average velocity of Section 2 was obtained. The pressure difference P1 – P2 can be obtained by using micro-differential pressure transducer. Then SPRC can be derived from different VG installations. The SPRC measured for the model draft tube without VG was 81.37%. The SPRC measured for the model draft tube using the optimum VG installation was 85.42%. The deviation of the increase of SPRC between numerical simulation and experiment was 0.75%.
Comparing the experimental velocity distribution of Section 2 in these two cases (Figure 13), the velocity fluctuation of Section 2 is much weaker in the case of optimal VG (NP = 2, IA = 15°, AC = counter-rotating) installation than in the case without VG. The highest velocity value is much smaller in the case of optimal VG installation than in the other case. Also, the lowest velocity is bigger in the case of optimal VG installation, which is the same as the numerical simulate (CFD) results (Figure 14).

The measurement flow velocity of the “Section 2” of model draft tube using the optimal VG installation and without VGs.

Calculated velocities in the middle line of Section 2.
Some differences between predicted and measured results remain. The calculated and measured area average velocity of Section 2 was 0.653 ms−1 and 0.701 ms−1, respectively, and the pressure differences were 517.654 Pa and 527.06 Pa. In the optimal VG installation, the calculated highest velocity of the midline line in Section 2 was 1.194 ms−1, while the measured worth was 0.920 ms−1. There was no velocity zero-zone in the measurement results (Figure 13), and the minimum velocity without VG was 0.332 m/s. But there are zero-zone and negative-zone in Section 2, both of which were relatively large in the simulation. The numerical simulated SPRCs exceeded the experimental values.
6. Conclusions
54 cases of a model draft tube using different VG installations and without VG have been numerically simulated and analyzed. An optimized VG installation increased the SPRC by 4.8%, relative to a draft tube without VG. This was verified by an experimental test. From the simulation results, several conclusions can be drawn.
Vortex generators are not only a useful solution in aerodynamics, they can also be effectively used in hydrodynamics to improve flow patterns in a draft tube.
The installation section of VG in a draft tube should be at the vortex formation section (VFS), because VG can induce some small vortex, which will prevent flow separation from upstream locations.
The inclined angle of installed VG has a big has a major effect on the direction of these trailing vortices, and a counter rotating arrangement outperforms a corotating arrangement, because the VGs also have some redundant eddies which, if amplified by corotating installation, will have a negative effect on the draft tube flow. If we take the counter rotating installation, the redundant vortices will disappear by the self-canceling effect of the counter-rotating VG installation. It was also found that left incline corotating instillations were better than right incline corotating installations.
Due to the difficulties in measuring small velocity using Pitot tube, the measured velocity value near the wall may be inaccurate (Figures 6 and 9), because the negative velocity cannot be measured by Pitot tube. It also seems that the existing of obstacle, vortex, and so forth in the flow may cause reduction in velocity measurements. This may explain why measured velocity near tube wall exceeded the numerical simulated values.
Footnotes
Acknowledgments
This study was supported by the following funding Research on hydraulic vibration of large Francis turbines (the National Science Foundation of China, no. 51076041) and Improvement analysis of model draft tube by vortex-generators (the Young Innovation Project of Jiangsu Province, no. CXZZ12-0251). The Chinese Scholarship Council supports the first author for studying in the University of Helsinki (Finland), where this paper was competed. The authors also thank Brian Hayden (the University of Helsinki) for correcting some grammatical and language errors.