
Abstract
In order to improve the reliability of fault diagnosis, total energy growth rate of rolling bearing during run-up is defined and applied to bearing detection. Firstly, an approach of merging short-time Fourier transform (STFT), linear fitting and median filtering is developed to extract the total energy growth rate. Secondly, the relationship between the total energy growth rate and different running conditions is discussed. Thirdly, the total energy growth rate is adopted to diagnose faults as input vector of radial basis function (RBF) neural network. Experiment results show that the total energy growth rate is an effective failure symbol for fault diagnosis of rolling bearing during run-up.
1. Introduction
Rolling bearings, considered as critical mechanical components, are widely used in industry. If defects occur in these bearings without timely diagnosis, malfunctions even catastrophic accidents would happen [1]. Hence, it is significant to detect rolling bearing to improve the reliability and security of mechanical equipment [2].
As an important part in the entire workflow, vibration signals of the run-up process can be used to diagnose fault state [3]. Some failure symptoms, hardly appearing in stationary process, may emerge during run-up due to the change of rotating speed. Besides, it is more timely to find faults by monitoring the run-up process than the stationary. Therefore, fault diagnosis during run-up, especially for large rotating machinery which need to run up frequently, such as mine hoist, plays an important role in improving the detection reliability. Hitherto, many scientific researchers have focused on these fields. Tadina and Boltežar [4] established a bearing model, assuming that the inner race has 2 DOF and the outer race is flexible in the radial direction. Söchting et al. [5] examined the influence of simulated launch vibration on the friction and lubrication of ball bearing. Using run-up and run-down simulation methods, Tian et al. [6] showed the effects of outer clearance on the bearing dynamic behaviors. Kim et al. [7] compared fast Fourier transform, STFT, Wigner-Ville distribution, and discrete wavelet transform on damage detection in speed-varying process. Subrahmanyam and Sujatha [8] suggested a neural network based on error back-propagation and adaptive resonance theory 2 (ART2) to diagnose the localized defects in ball bearings under various loads and speed conditions. With envelope analysis and empirical mode decomposition (EMD), Tsao et al. [9] presented an insight concept to choose an appropriate resonant frequency band for bearing faults. The aforementioned research is focused on model construction, data simulation, and fault recognition.
This research is about the total energy growth rate of rolling bearing during run-up. An effective failure symptom, which is extracted from a time-frequency spectrum obtained by the STFT, is defined and used to diagnose faults of rolling bearing by RBF neural networks.
2. Total Energy Growth Rate of Rolling Bearing
A rolling bearing, as shown in Figure 1, is composed of inner and outer races, cage, and rolling elements. Defects may occur in any of the parts and cause abnormal vibrations [10]. The energy of the abnormal vibrations is generally recognized as an important symbol for fault diagnosis. The energy of the rolling bearing is usually characterized by vibration data which are collected by an accelerometer installed on the top of the housing.

Structure of rolling bearing.
The vibration energy at the measurement point comes from the shaft rotation through the transmission medium of the rolling bearing and housing. With the performance degradation, there may be fault spots on the track of outer or inner raceway of the bearing. Extra shocks that cause abnormal impact energy will occur when rolling elements pass the fault spots. The impulse response of the structure decides the bearing transfer function which determines the vibration response [11]; the affection of fault spots to energy in inner race is different from that in outer race. The energy transmitting from the shaft to the measurement point changes with the change of the bearing failure state.
The total energy is the summation of all the amplitudes in the Fourier spectrum. According to Parseval's theory, the energy of the aperiodic signals is equal to the energy in frequency domain [12]. The trend in the amplitudes of the peaks in the frequency spectrum can be used for bearing detection [13]. When the shaft runs up, the energy of the shaft grows with the speed. Due to affections of different bearing failure states, the total energy growth trend at the measurement points changes and thus can be recognized as a fault symptom to diagnose bearing faults.
Accordingly, we present total energy growth rate to quantize the energy growth trend during run-up. The extraction steps of the total energy growth rate are defined as follows:
simulating different running conditions of rolling bearing and acquiring the vibration signals with accelerometer;
obtaining time-frequency spectrum of rolling bearing by processing the vibration signals with the STFT, defined as [14]

where t is the time, ω is the frequency, τ is the window width, f(t) is the signal, and g(t) is a window function. With high computation efficiency, the STFT, which can retain the energy and frequency properties of raw vibration signals, is widely applied to processing nonstationary signal;
computing the total energy of rolling bearing at a series of certain time points by summing the frequency amplitudes of each time point, respectively;
dividing run-up process into time slices equally and adopting linear fitting to acquire the growth rate of total energy of every slice;
collecting all the growth rates and using median filtering to remove the disturbance of noise and critical speed which may affect the overall trend;
obtaining the final total energy growth rate of rolling bearing during run-up.
Many large rotating machinery run up softly with variable acceleration. Different accelerations may affect the total energy growth rate in the same process. Consequently, we research the total energy of the rolling bearing under different failure states and accelerations.
3. Experiment Setup
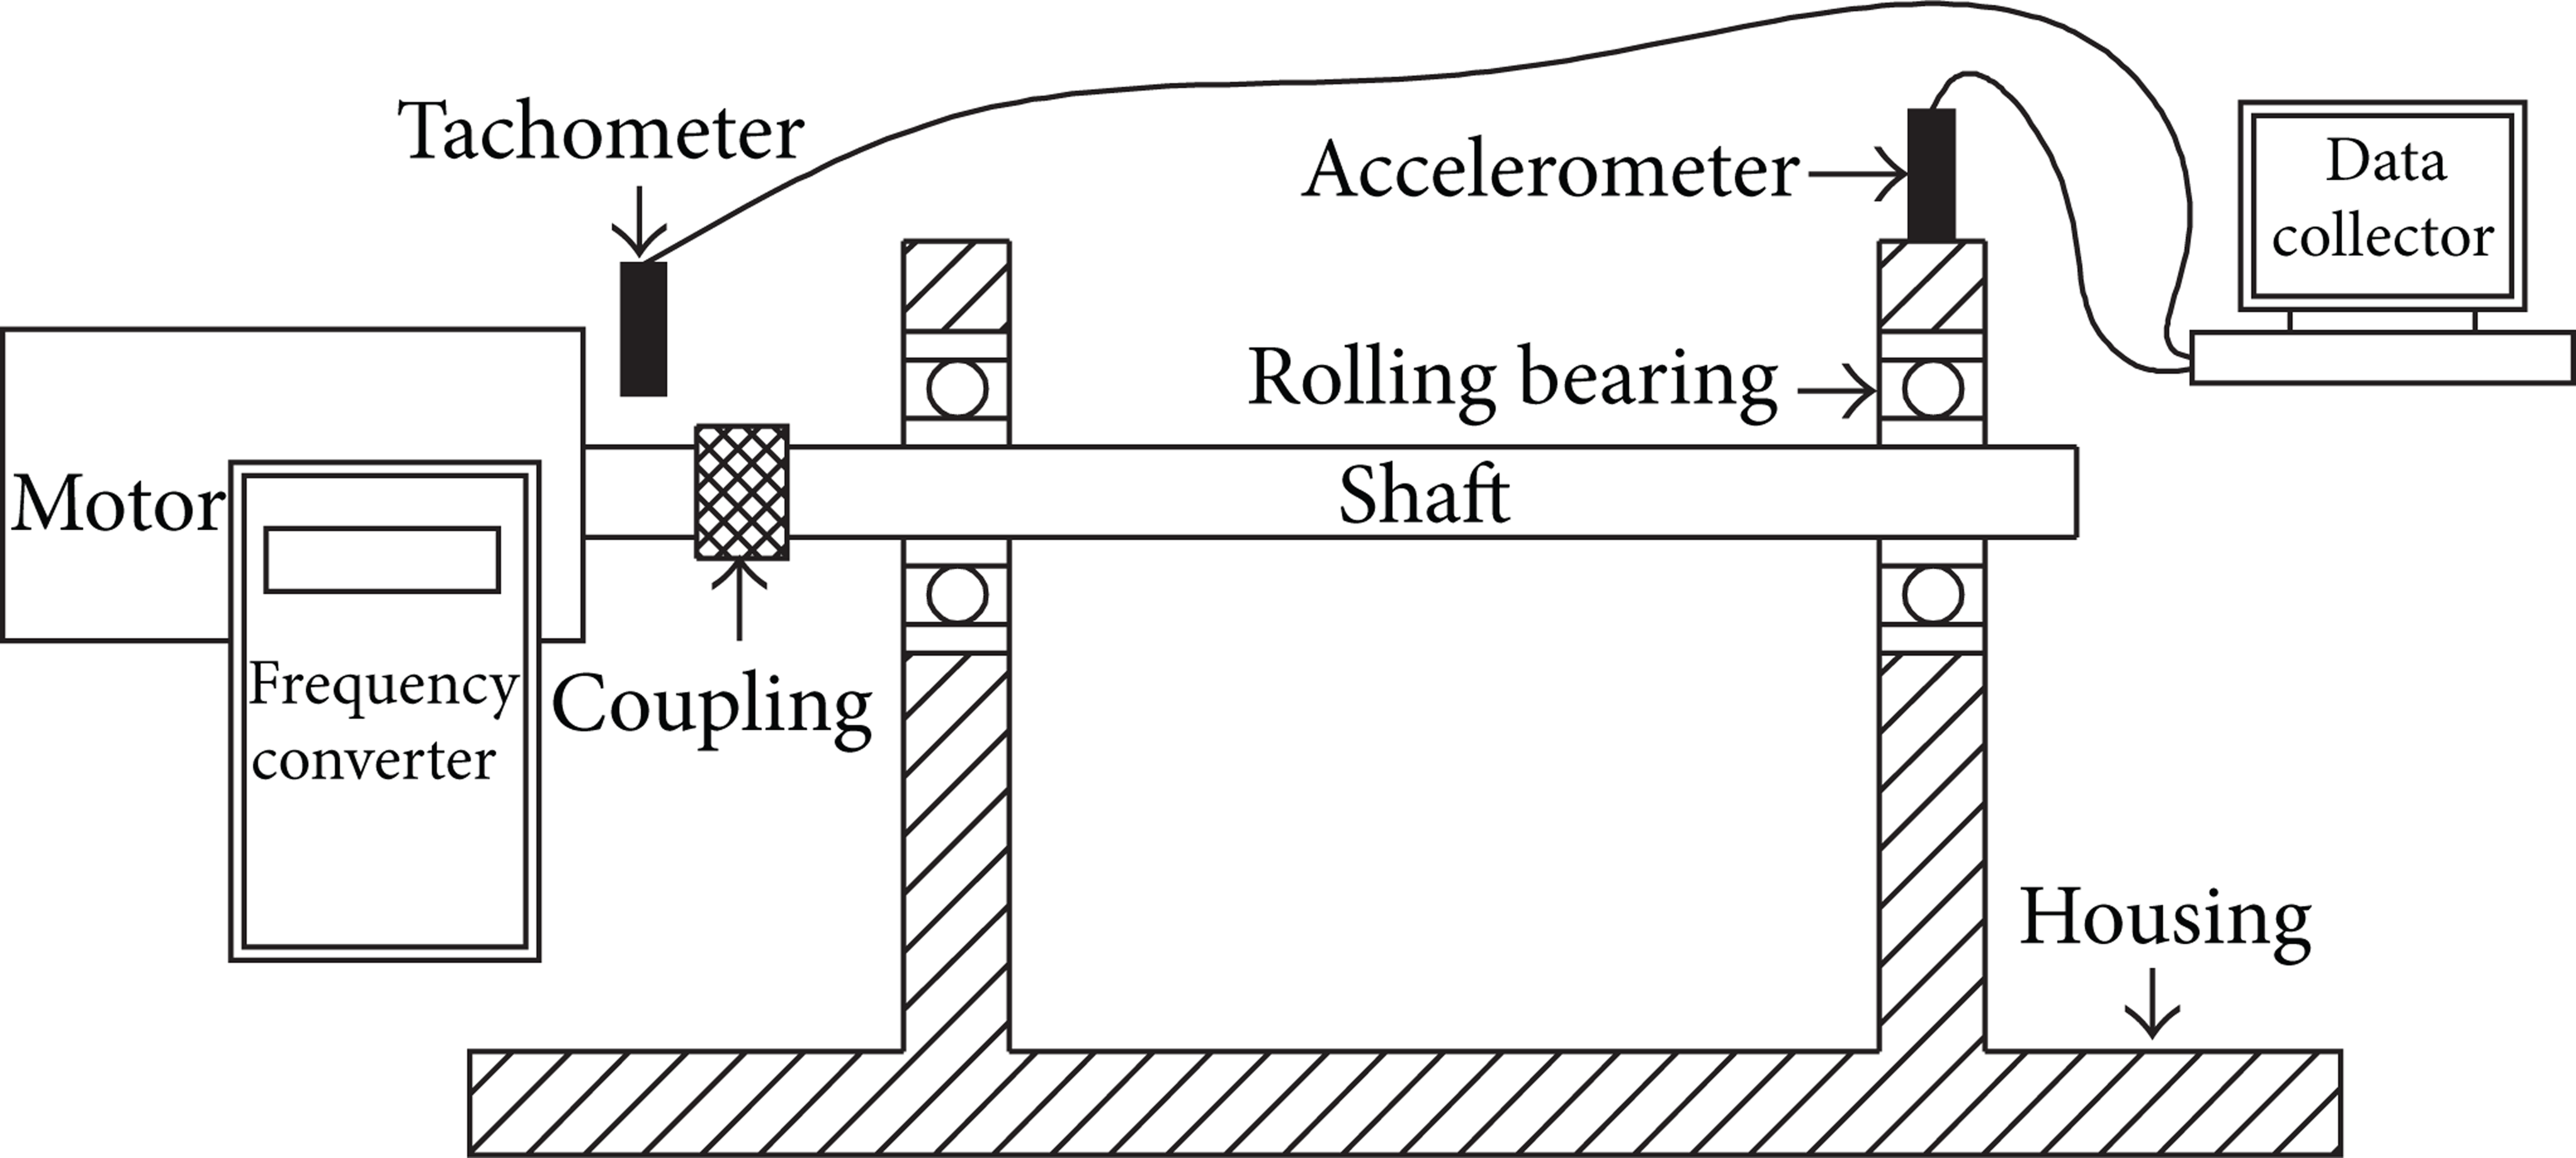
In this section, actual rolling bearing vibration data were collected to verify the feasibility of applying total energy growth rate to detect bearing. The vibration data were generated by the machinery fault simulator manufactured by SpectraQuest, Richmond, USA. The machinery fault simulator, described in Figure 2, can simulate various bearing fault vibrations by replacing the rolling bearing with a bearing of known fault. An accelerometer is installed on the top of the housing over the shaft to collect the vibration data of bearing. The shaft rotational speed is collected by a tachometer installed over the shaft. The signals from the accelerometer and tachometer are transmitted to a data collector. The geometric structure of the bearing used in the experiment is depicted as follows: rolling diameter 0.3125 in, bearing pitch diameter 1.318 in, BPFI 3.048 × Speed, BPFO 4.95 × Speed, and number of the rollers 8. The manufacturer provides the defect bearings without detailed information (size and geometry) of the defects. The data acquisition system is shown in Figure 3.
Rolling bearing fault simulator drawing.

Rolling bearing vibration data acquisition system.
Three kinds of bearing running conditions containing normal, inner race fault and outer race fault were generated by the machinery fault simulator with the sample frequency of 20000 Hz. To simulate run-up with different accelerations, we set the motor under each running condition to change the speed from 0 to 10 Hz, 0 to 15 Hz, and 0 to 20 Hz within the same time of 10 seconds. In other words, the accelerations are 2π rad/s2, 3π rad/s2, and 4π rad/s2, respectively. The 9 conditions are defined as follows:
F1: normal with 2π rad/s2,
F2: normal with 3π rad/s2,
F3: normal with 4π rad/s2,
F4: inner race fault with 2π rad/s2,
F5: inner race fault with 3π rad/s2,
F6: inner race fault with 4π rad/s2,
F7: outer race fault with 2π rad/s2,
F8: outer race fault with 3π rad/s2,
F9: outer race fault with 4π rad/s2.
For the convenience of contrastive analysis, only the first 0 to 10 Hz rotation frequency of every running condition is collected.
4. Experiment Results
The raw acceleration signals are shown in Figure 4, where the horizontal axis represents the rotation frequency of shaft and the vertical represents the acceleration. These signals are processed by means of the STFT with Hanning window of 8192 data width. Total energy of the rolling bearing is obtained by summing all the frequency amplitudes of each time point, respectively. The run-up process is divided into 180 time slices equally. The growth rate of the total energy of every slice is acquired by linear fitting, shown in Figure 5. With median filtering, all the growth rates are ranked by size. sixty growth rates in the middle are averaged to obtain the final growth rate, shown in Table 1.
Total energy growth rate of rolling bearing.

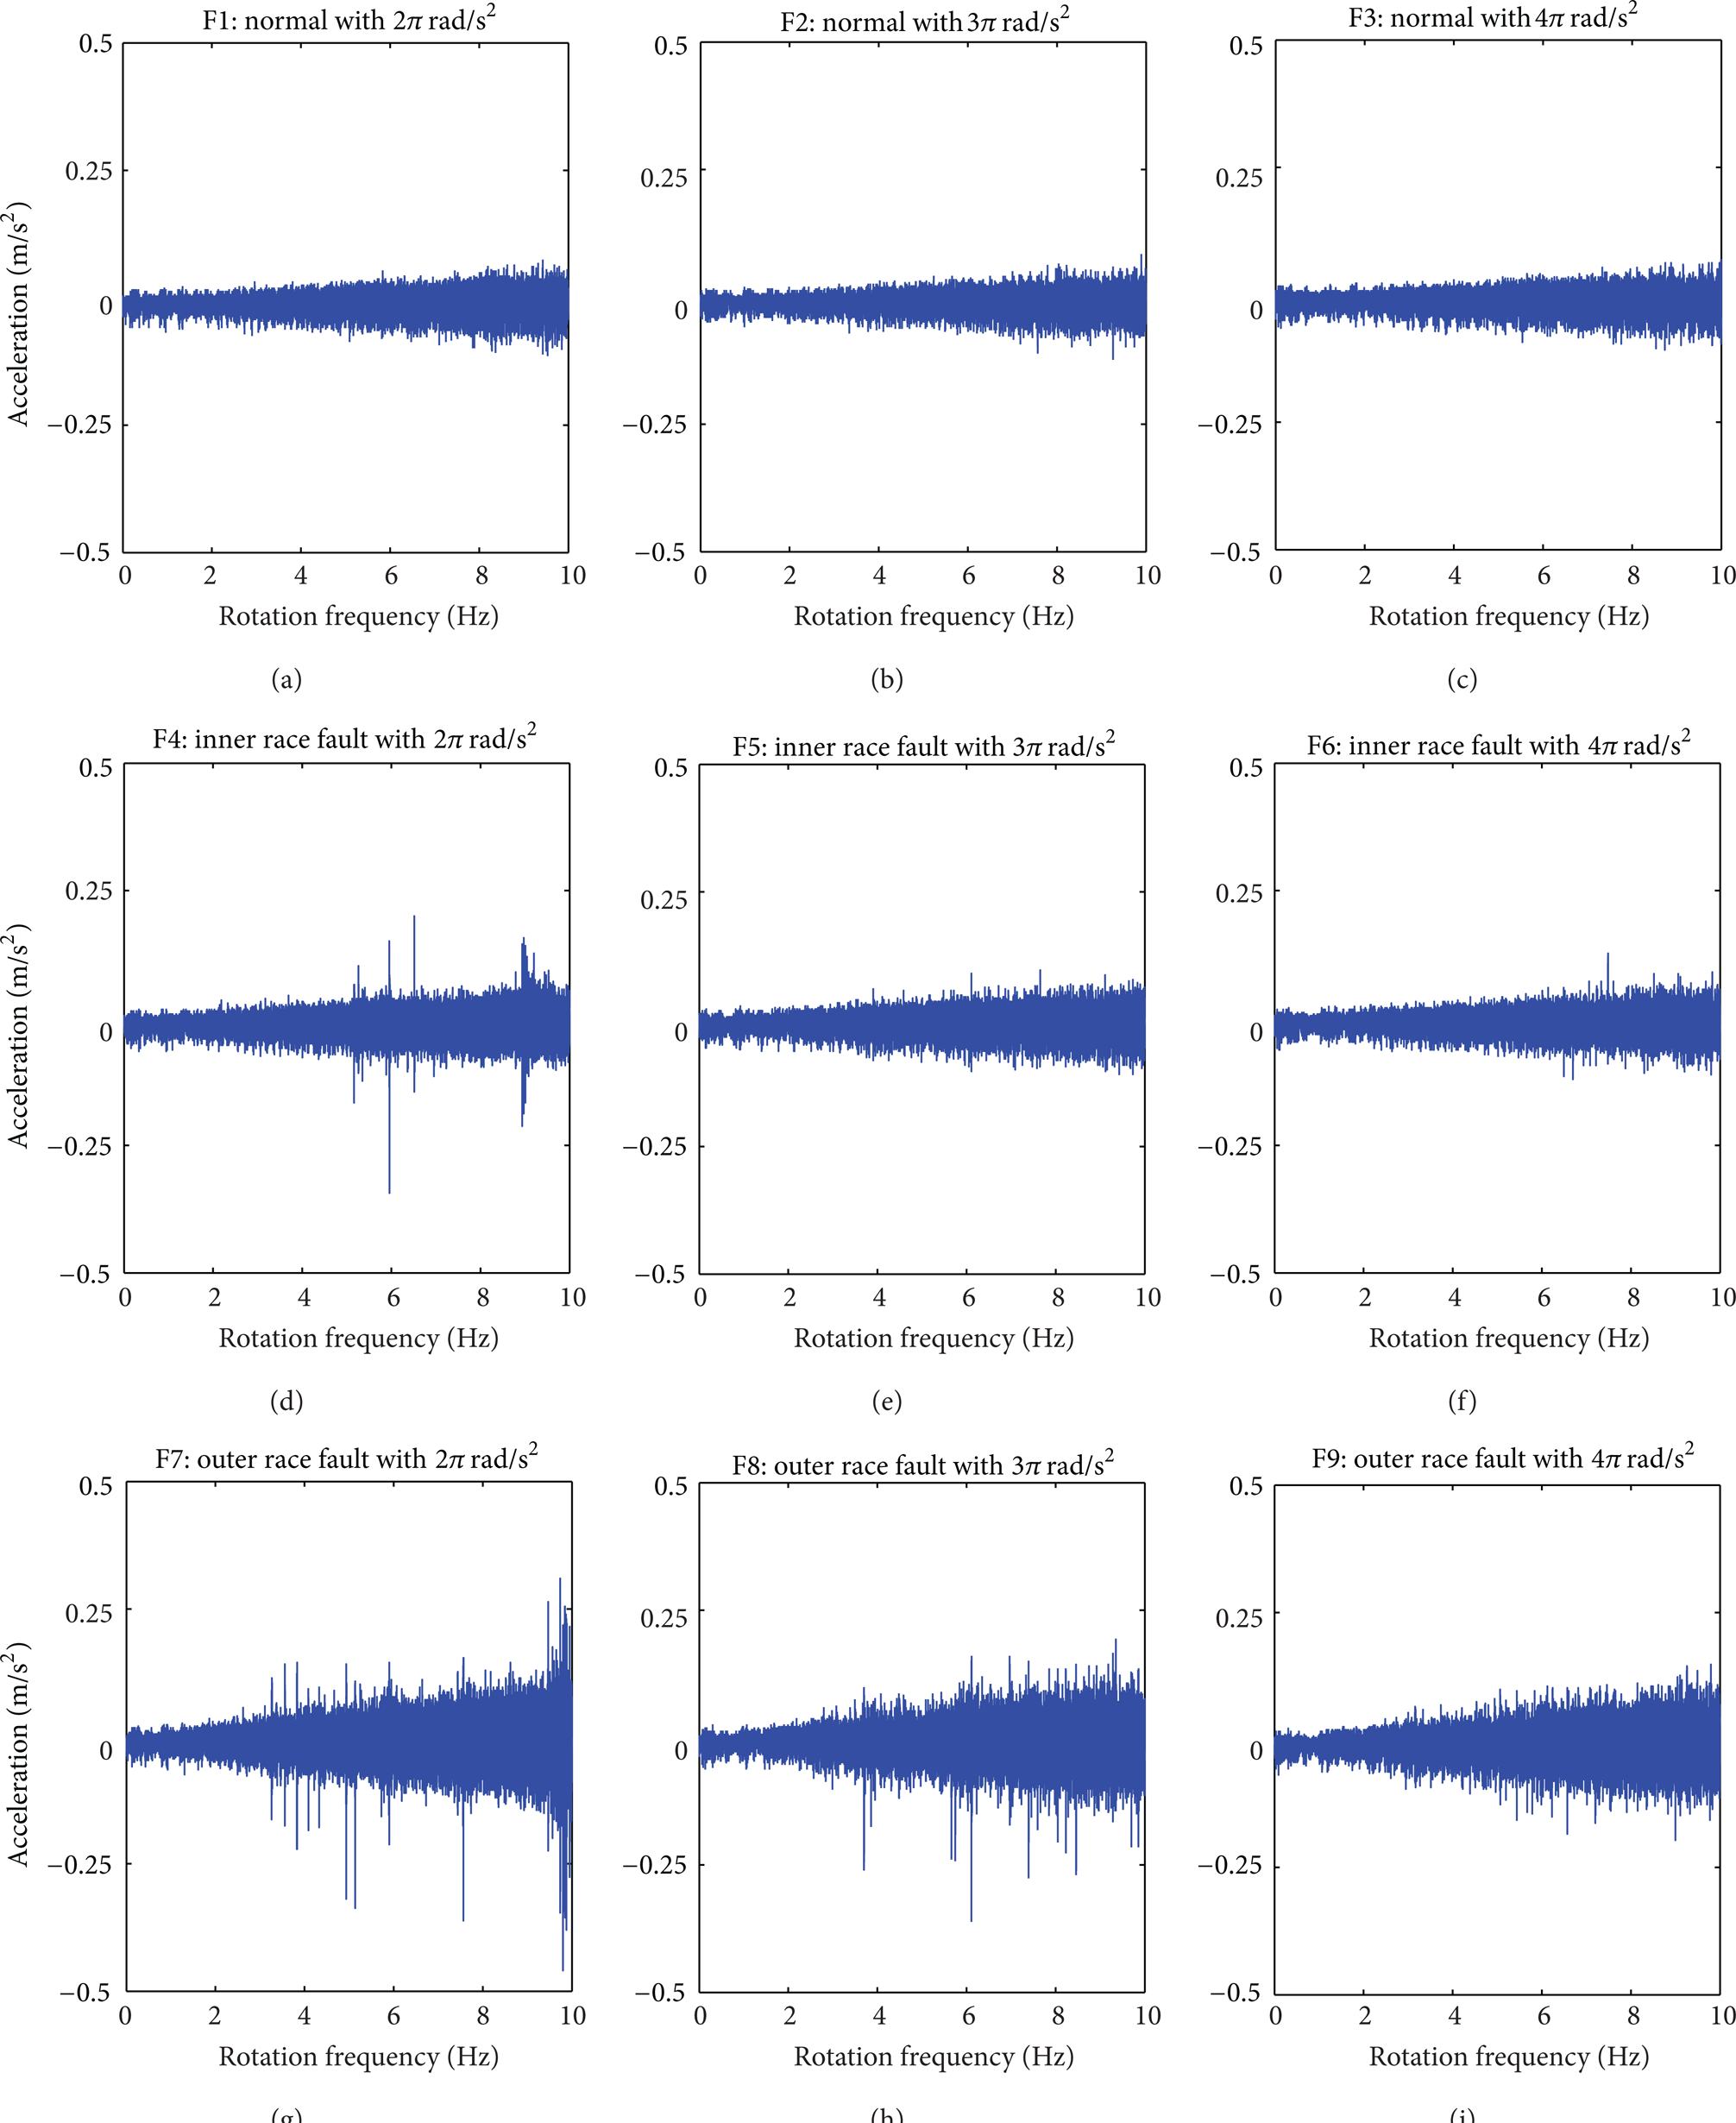
Raw vibration signals of rolling bearing under different running conditions.

Total energy of the rolling bearing and linear fitting of the growth rate.
As shown in Figure 4, the total energy of the rolling bearing, represented by the blue lines, increases with the rotation frequency as a whole. Some fluctuations emerge as the rotate speed increases, shown in Figures 4 (d), 4 (g), and 4 (h). Probably triggered by noise and critical speed, the fluctuations are unable to disturb the growth trends. The linear fitting results, represented by the red lines, indicate the growth rate of the total energy. As can be seen from each row of Table 2, the total energy growth rate is approximately equal to each other under different accelerations in the same running condition. Nevertheless, under the same acceleration in different running conditions, the total energy growth rates are quite different, shown in each column of Table 2.
Test results of RBF neural network.

Consequently, we can draw the following conclusions.
Under different running conditions and accelerations, total energy of the rolling bearing increases with rotation frequency as a whole regardless of the disturbance of noise and critical speed.
Under the same running condition, the total energy growth rate is essentially constant and less affected by different accelerations.
With the same acceleration, the total energy growth rate changes with different running conditions clearly.
5. Fault Diagnosis
Based on the aforementioned data results, the total energy growth rate is regarded as a powerful failure symptom and can be used to diagnose fault by the RBF neural network, expressed as [15]
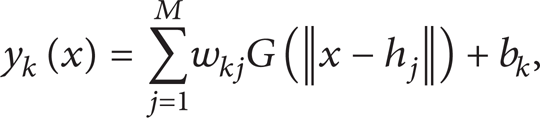
where y
k
is the output of the network related to the input vector x, M is the number of neurons in the hidden layer, h
j
is the vector determining the centre of the basis function G(·),
In this research, the vibration of the rolling bearing with the acceleration of 4π rad/s2 during run-up is taken as an example. Ninety vibration samples, in which 80 samples are extracted randomly as training samples and the rest are taken as test samples, are collected. The input layer of the RBF neural network has one neuron that refers to the total energy growth rate. The output layer has three neurons, given as follows: normal [1 0 0], inner race fault [0 1 0], and outer race fault [0 0 1]. Trained by training samples, the RBF neural network is used to test samples to determine different fault patterns of rolling bearing. Test results are listed in Table 2.
As can be seen from Table 2, the diagnosis results of the 10 test samples coincide with the actual running conditions. The errors between the actual and ideal RBF results are small. There exist large differences in the actual RBF results of the normal, inner race fault, and outer race fault. According to Tables 1 and 2, the total energy growth rate of the rolling bearing is sensitive to the running conditions. Thus, fault diagnosis of the rolling bearing during run-up based on the total energy growth rate is effective and superior to those with the EMD energy entropy [16], spectral kurtosis energy [17], and first left and right singular vectors of time-frequency spectrum [18] in computational efficiency and accuracy.
6. Conclusion
In this research, total energy growth rate of the rolling bearing under different running conditions during run-up is defined. An approach with STFT, linear fitting, and median filtering is adopted to acquire the final total energy growth rate, which is trained as an effective failure symbol for fault diagnosis by the use of the RBF neural network. Experiment results show that fault diagnosis based on the total energy growth rate is powerful.
However, there still exist many problems on fault diagnosis of rolling bearing during run-up due to the complex vibration mechanism and running conditions. The research will be done on finding out the relationship between the total energy growth rate and other different running conditions, such as unbalance and misalignment. Besides, how to realize the cooperative diagnosis with other failure symptoms is another research in the future.
Footnotes
Acknowledgments
The research is supported by the National Natural Science Foundation of China (51275513) and the Fundamental Research Funds for the Central Universities (2012LWB33).