
Abstract
Large eddy simulation of inertial particle dispersion in a turbulent flow over a backward-facing step was performed. The numerical results of both instantaneous particle dispersion and two-phase velocity statistics were in good agreement with the experimental measurements. The analysis of preferential dispersion of inertial particles was then presented by a wavelets analysis method for decomposing the two-phase turbulence signal obtained by numerical simulations, showing that the inertial particle concentration is separation from the Gaussian random distribution with very strong intermittencies. The statistical PDF of vorticity seen by particles shows that the inertial particles tend to accumulate in low vorticity regions where ∇
1. Introduction
Recently, inertial particles have been found to be asymmetrically dispersed in a multiscale coherent turbulence field. This kind of particle uneven dispersion cannot be revealed by the statistical Fickian diffusion law, because the diffusion models fail to take into account the particles dispersion dominated by the multiscale turbulence structures and the effects of damping or distortion on turbulent eddies by particles clusters.
Some researches, by means of numerical simulation and experimental measurements, have been carried out on particles asymmetric dispersion in free shear flows which are dominated by large-scale vortexes, for instance, Kobayashi et al. [1], Lazaro and Lasheras [2, 3], Tang et al. [4], Longmire and Eaton [5], Luo et al. [6, 7], and Vuorinen et al. [8]. They found that small inertial particles were flung away from the vortex cores and collected in rings surrounding the vortices in many cases. By using Direct Numerical Simulation (DNS) for homogeneous isotropic turbulence, Squires and Eaton [9] and Lian-Ping Wang and Maxey [10] also found that high and low particle concentrations appear in convergence zones and eddies, respectively, and at the same time local particle concentration is up to 30 times of the mean concentration, when the particle Stokes number is about one based on the Kolmogorov time scale. However, understanding of inertial particle dispersion in turbulent flows is not well presented.
Fessler et al. [11] conceptually proposed the particle preferential concentration (Figure 1(a)) through the experimental investigation of a turbulent channel flow. They observed that particles are dispersed in turbulence neither uniformly nor randomly, preferring some characteristic regions, resulting in particles “clouds.” When the particle Stokes number is approximately one, the particles have the maximum departure from a random distribution. Since then, the particle preferential dispersion has become one of the highlights in studies of two-phase turbulent flows [12–14]. Winkler et al. [15] demonstrated that particles accumulated in regions of low vorticity by applying one-way coupled large eddy simulation in a fully developed turbulent square duct flow. Wang and his coworkers [16–20] studied the particle preferential dispersion in the turbulent flows over a backward-facing step and particle-laden turbulent channel flows. They also performed numerical and experimental investigations on particle preferential dispersion in turbulent jets [21–23]. Although investigations on the particle dispersion, especially the inertiaparticle preferential dispersion, have become increasingly popular, the characteristics and mechanisms of preferential dispersion are still not very clear, especially in turbulent flows over a backward-step laden with initial particles, which is an important prototype flow widely occurring in industrial and environmental engineering.

Particle preferential dispersion in turbulent flow fields. (a) Experimental snapshot picture by Fessler et al. in a turbulent channel flow (in [11, Figure 5]) for 28 μm lycopodium particles with Stokes number 1.7. (b) Scatter of 20 μm glass particles with Stokes number 1.11. (c) Vorticity isocontours.
In this paper, a large eddy simulation is first performed to numerically compute two-phase turbulent flows over a backward-facing step, and then the analysis is done based on the numerical results. The temporal and spatial evolutions of preferential distribution of particle dispersion are studied by using the wavelets analysis and PDF statistical methods.
2. Mathematical Descriptions and Numerical Results
2.1. Numerical Methods
Large eddy simulation is adopted to simulate the gas-phase turbulence. The flow field variables are separated into a large-scale component and a subgrid-scale (SGS) component by filtering. The SGS stress term is modeled by the Smagorinsky model. The governing equations are written as
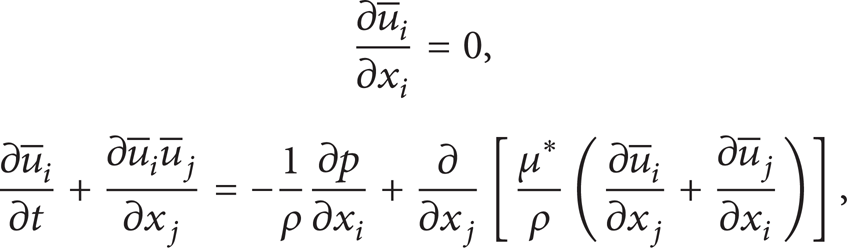
where the efficient viscosity μ* = μ/Re + μ T ; the Reynolds number is given by Re = ρU0H/μ, where μ is the molecular kinematic viscosity. H is the channel height; U0 is the channel inlet mean velocity.
The eddy viscosity μ T is defined as

where CSGS is an empirical constant, taken as 0.13 in this paper, and the strain rate tensor is taken as

Equation (1) is solved numerically using the fractional step method as described by Wu et al. [24]. A nonsolenoidal velocity field
A Lagrangian approach is used to track each particle released in the flow field. The drag force is taken as the dominant force on each particle in this paper. The nondimensional dynamic equations for a particle along its trajectory are

where
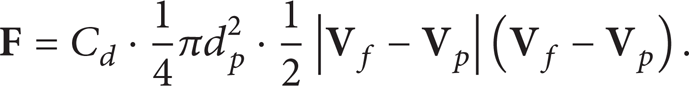

Re p is the particle Reynolds number defined as

The effects of subgrid-scale (SGS) turbulence on particle motion are neglected in this study. For the high-inertia particles, the dispersion of particles by turbulence mainly happens at the grid scale, that is, resolved scale, contrary to the expectation that the dispersion mainly happens at scales around or smaller than the subgrid-scale. Large-scale turbulence structures that disperse particles are the primary modes of particle dispersion. Particle inertia plays an important role in filtering turbulence fluctuation, which prevents couplings of SGS components from causing significant effects on turbulence intensities in the high-frequency sphere. Negligibly small differences were found between the statistical velocity results considering the SGS coupling and those considering only the grid-scale coupling mean velocity, which can be referred in to [19].
The particle Stokes number, used to characterize particle motion, is defined as
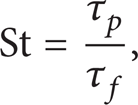
where τ p = ρ p d p 2/(18μ) is the particle relaxation or aerodynamic response time scale and τ f = H/U0 is the fluid time scale.
Impactions between particles and the wall are considered to be fully elastic. Therefore, only the wall-normal component of particle velocity is reverse in the direction after colliding with the wall
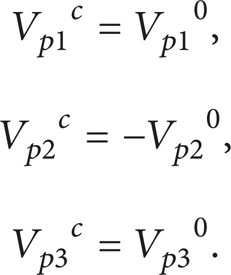
The superscript “c” means the velocity after collision, while “0” means the velocity before collision.
The intercollisions of particle-particle are neglected in this study. The effects of interparticle collisions on evolutions of preferential dispersion are not discussed in the present paper.
The detailed numerical procedure of two-phase governing equations can be referred to in [16, 19].
2.2. Numerical Results
In this paper, the flow Reynolds number is taken as 13,800 for the simulated two-phase turbulent flows over a backward-facing step. Particles, made of glass (ρ p = 2500 kg/m3), in diameters of 2, and 20 micrometers are chosen in the simulations.
The large eddy simulation was verified and validated by comparing the two-phase velocity statistics, detailed analysis is referred to in [16].
The numerical results of particle dispersion are compared with the previous experimental results, shown in Figure 1. 20 μm glass particles, with the particle Stokes number around 1, show preferential distribution in turbulent flow fields. The instantaneous gas-phase vorticity iso-contour at an instant time is shown in Figure 1(c). It is shown that the large eddy vortexes evolve spatially with the separation behind the step and the reattachment on the lower wall.
The particle preferential dispersion can usually occur in a limited range of particle Stokes number, which depends on the turbulence and particle properties. Therefore, the snapshot picture in Figure 1 cannot be implemented in all different particles, but represents the general characteristics of preferential dispersion for particles that can occur. In particular, for the present study in the Figure 1, the particle Stokes number is around 1 both for the experimental observation and numerical simulation. That is to say, once the particles disperse preferentially in turbulence, the snapshot like Figure 1 can represent the basic contours.
3. Analysis of Particle Preferential Dispersion
The temporal signals of turbulence sampled at some typical positions in the flow field, shown in Figure 2(a), are obtained and analyzed, for example, at a position (x/H = 12, y/H = 1, z/H = 2) in the main developing region. The multiscale analysis of turbulence is based on wavelets methods proposed by Farge and coworkers [26, 27].

Wavelets analysis of the turbulence temporal signal at a specified position: (a) the temporal turbulence signal, (b) the grey contour of wavelets coefficients in different scales.
The wavelet coefficients in wavelet analysis represent the energy in the corresponding scales. Therefore, they can show the energy cascades of turbulence in different scales and also the intermittency of turbulence energy. As shown in Figure 2(b), the signal is decomposed in different scales by means of wavelets analysis. The low frequency large scales are split into high-frequency abundant small scale structures, known as the classical “vortex cascade.” Energy is transferred from large-scale eddies to small scale eddies.
Particles scatters together with the isolines of gas-phase vorticity are shown in Figure 3(a), where dots represent particles. By counting the particle number in each cell, particle number density is obtained. The particle number of 20 μm glass particles at a fixed cell as a function of time is shown in Figure 3(b). It is found that particle number density temporal signal is not steady, containing very strong fluctuations.

Particle concentration analysis: (a) particle scatters, (b) a temporal signal of particle number density at a fixed cell, (c) flatness factor obtained by means of wavelets transform, (d) skewness factor obtained by means of wavelets transform.
The wavelets transform is used to analyze the particle number density signal, for example, the glass particles. The skewness factor and flatness factor, which can examine the intermittency contained in the signal, according to the wavelets coefficients W(a, t) at time t and scale a, are defined as
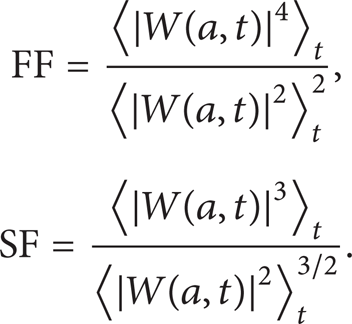
The values of FF and SF are 3 and 0, respectively, for a signal obeying Gauss random distribution. As shown in Figures 3(c) and 3(d), the particle concentration signal is separation from the Gaussian random distribution, containing very strong intermittencies, correlated with turbulence structures, which indicates that the particles preserve the preferential dispersion in turbulence.
The preferential distribution is dominated by both turbulent coherent structures and particle inertia. The particle preferential concentration characteristics are theoretically analyzed as follows.
Let

where D/Dt is total derivative following the fluid element, and a is the modified acceleration,
Taking the approximate expression of above equation with accuracy O(τrp2) and taking divergence of both sides of simplified equation,
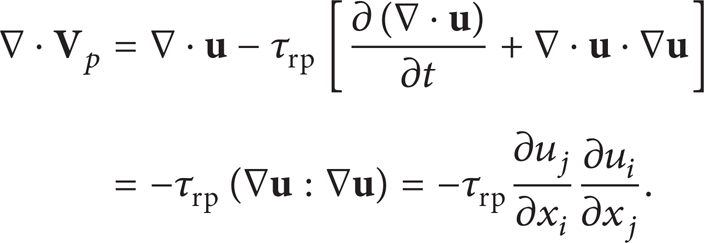
Equation (12) indicates that the Eulerian particle velocity field is not divergence-free. If the Eulerian formulation for the particle velocity field is considered, the particle phase is continually taken as a “pseudo” fluid phase.
The particle-phase continuity equation is written as,

where ρ
p
is particle-phase density and
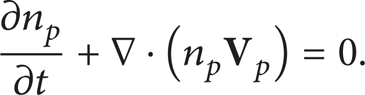
From (14), the particle number density can be obtained as

Substitute (12) for (15) and settle to obtain

To estimate the particle number density, that is, the particle volume concentration, at location
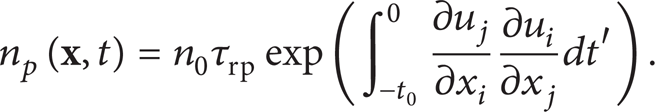
From the above analysis, it is summarized as follows.
Particles are advected by an effective velocity field
The inertial particle concentration distribution has the historical effects; that is, the present particle concentration is obtained considering the previous particle concentration distribution.
The vorticity PDF distribution is compared in a specified window field in the region x/H = [7, 12] and y/H = (0, 2.5) in the central plane in the spanwise direction, in order to reveal where particles preferentially accumulate in the turbulent flow fields. The PDFs of both continuous-phase fluid vorticity at each computation grid point and vorticity seen by particles at each particle position, interpolated from the value of nearby points by a 6th order Lagrange interpolation method, are statistically obtained.
Figure 4 shows the results of PDF statistics at two different instantaneous dimensionless times t = 135 and t = 142, for two different particles in diameter of 2 μm whose particle Stokes number is 0.11 and 20 μm whose particle Stokes number is 1.1.
Comparison of PDF of vorticity of fluid phase and vorticity seen by particles in a specified window field: (a) and (b) t = 135, (c) and (d) t = 142, (a) and (c) laden with 2 μm glass particles, (b) and (d) laden with 20 μm glass particles.
The PDF of vorticity seen by particles shows a concentrated value in the low vorticity region, compared with that of fluid phase. Particles accumulate around the circumference of a vortex and the braid between two vortices. For different particles in diameters, with different inertia, the dispersion distinguishes from each otherin these special regions, due to different response to turbulence.
There are differences of PDF distribution between fluid vorticity and fluid vorticity seen by particles. In general, the PDF of fluid vorticity seen by particles is more concentrated and has a higher value. The difference is induced by the inertial particle's crossing trajectory effects. Inertial particles are supposed to follow the fluid inertia-free particles initially, but they will subsequently separate from the initial fluid particles due to the inertia and lag response. Once these particles are flung to the edges of large vortices, they will see lower vorticity.
The analyses of particle concentration in other time instants are also performed and the same conclusions are drawn. The particle preferential distribution in turbulence is dependent on the particle inertia and turbulent transport.
4. Conclusions and Remarks
The inertial particle dispersion in turbulent flows over a backward-facing step is simulated by means of large eddy simulation with Lagrangian particle trajectory method. The particle instantaneous preferential dispersion is obtained numerically and agrees with the experimental flow visualization.
The particle concentration increases in regions with low vorticity, corresponding to the edge of vortex, and it decreases in regions with high vorticity, corresponding to the center of vortex. The inertial particle dispersion will become asymmetric and preferential at the next instants, even if the initial particle distribution is uniformed at an arbitrary instant t0. The particle preferential concentration preserves the historical effects.
The particles preferential dispersion depends on not only the characteristics of gas-phase flow, the multiscale structures, but also the properties of particles themselves, the inertia. τrp is a key parameter in analyzing the particle preferential dispersion. For the smaller particles, the preferential concentration is retrained for small τrp. For the larger particles, they do not respond fluid fields quickly due to their large inertia, and their instantaneous distribution does not show a preferential concentration. For the medium particles, their instantaneous distribution shows obvious preferential concentration due to proper τrp.
Furthermore, the smaller particles accumulate around the circumference of a core of a vortex, which leaves some small “blank” regions in which few or none solid particles are found. The median particles accumulate around the circumference of a vortex and along the braid between two vortices, which leaves some large “blank” regions in the flow fields.
The present conclusions are valuable for establishing more accurate particle dispersion models applied in particle-laden turbulent flows in practice. The analyses are performed in an individual high flow Reynolds number in the present study. Even if the particle preferential dispersion is found commonly to exist in high Reynolds number turbulent flows, the effects of flow Reynolds number on particle dispersion are to be investigated further.
Footnotes
Acknowledgments
The first author gratefully acknowledges the financial support partially by NSFC under Grants. nos. 50706021 and 11132005 and partially by the Ph. D. Programs Foundation of Ministry of Education of China under Grant. no. 20070003018.