
Abstract
The present paper is an account of an experimental analysis carried out to investigate to what extent the flow characteristics in the intake system of a 4-valve, spark ignition internal combustion engine depend on the experimental conditions at the steady flow test bench. In this respect, the study is aimed at determining the influences of the intake adaptor, test pressure, adaptor length and diameter, adaptor roughness, paddle wheel diameter, and asymmetric valves lifting on the flow coefficient and the swirl intensity measurements. In studies of this kind, researchers generally tend to adopt different test parameters to arrive at a nonuniform base to compare results from several investigations. This work is aimed at verifying the quantitative differences detected using these test parameters. The findings revealed that the swirl intensity depends on the pressure test, adaptor length, and the entry type to a significant degree. Moreover, it was observed that the intake adaptor is the most effective test parameter on the flow coefficient. Finally, the sensitivity analysis has been performed in order to investigate the experimental results and to correlate them with the test parameters.
1. Introduction
A deep knowledge of the intake and exhaust processes is fundamental to design and optimize modern internal combustion engines. The development of efficient intake and exhaust systems, in fact, plays a key role both in reducing exhaust emissions and fuel consumptions and in improving the performances of actual engines [1, 2].
In-cylinder charge motion has been receiving increasing attention since the introduction of new technologies such as gasoline direct injection or homogeneous charge compression ignition. Therefore, understanding the dynamics of the in-cylinder flow structures is the first step to control fuel stratification, turbulence, and heat transfer efficiently.
An air flowbench (steady flow test) is essentially a device used to measure the resistance of a test piece (such as the cylinder head, manifold, carburetor, throttle body, exhaust systems, etc.) against air flow [3, 4]. In addition, it is easy to implement and is considered as a low-cost option to estimate the ability of the cylinder head to convert the linear motion of the inlet flow to rotational motion including swirl and tumble flow (Figure 1). It is due to these features that currently such tests are being widely used to estimate the effects of geometric changes on the cylinder head and the inlet port with the aim of comparing and thus improving engine performance.
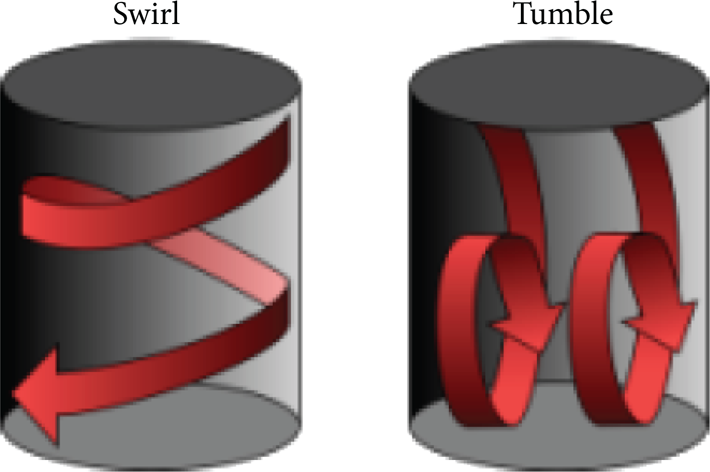
Swirl and tumble in the engine cylinder.
Although considerable efforts have been made by researchers to explore the most effective methodology for steady flow tests, there are substantial diversities in the definitions of the technical terms and the techniques used in the existing experiments [4, 5] and thus the configurations of the flow bench vary considerably from user to user.
The absence of a standard methodology has obviously raised difficulties in the interpretation of the available data and has posed an obstacle in drawing comparisons between the intake flows characterized by different engine groups [6]. Therefore, it is important to report not only the test results but also the test conditions [7–9].
The experimental techniques, their implications, and the important technical issues involved in the steady flow bench test have been discussed in the early works [10–12]; however, the literature appears to lack a comprehensive study of the effect of the test parameters on the steady flow test results. In this regard, the current paper presents and discusses the sensitivity of various test parameters to the flow coefficient and the swirl intensity measurements. This study is expected to be of much application to engineers working on the development of engine cylinder heads, particularly those involved in the steady flow tests.
In this study, basic test parameters are first considered and then are modified so that the effect of each parameter on the flow coefficient and the swirl intensity can be studied.
2. Experimental Test
The experimental setup is schematically presented in Figure 2. Special mechanisms and fixtures are used to set valves lift by clock (1) (Figure 3). In standard tests on engines with four valves per cylinder, inlet or outlet valves are open simultaneously. The test is performed on a cylinder head (2) and a dummy cylinder (3) is used with a diameter equal to the engine bore. Pressure drop is measured with a stagnation pressure gauge (4) relative to atmospheric pressure. A manometer (7) is also utilized to determine the pressure drop in orifice (8) and consequently to measure the volume flow rate. Desired differential pressures are supplied with a bypass valve (10) and the air flow temperature is recorded using a temperature gauge (11) for air mass flow rate correction. In the orientation shown in Figure 2, the swirl meter (12) generally measures the tumble intensity. In this paper, however, the swirl meter is placed under the dummy cylinder (Figure 4) to measure the swirl intensity.
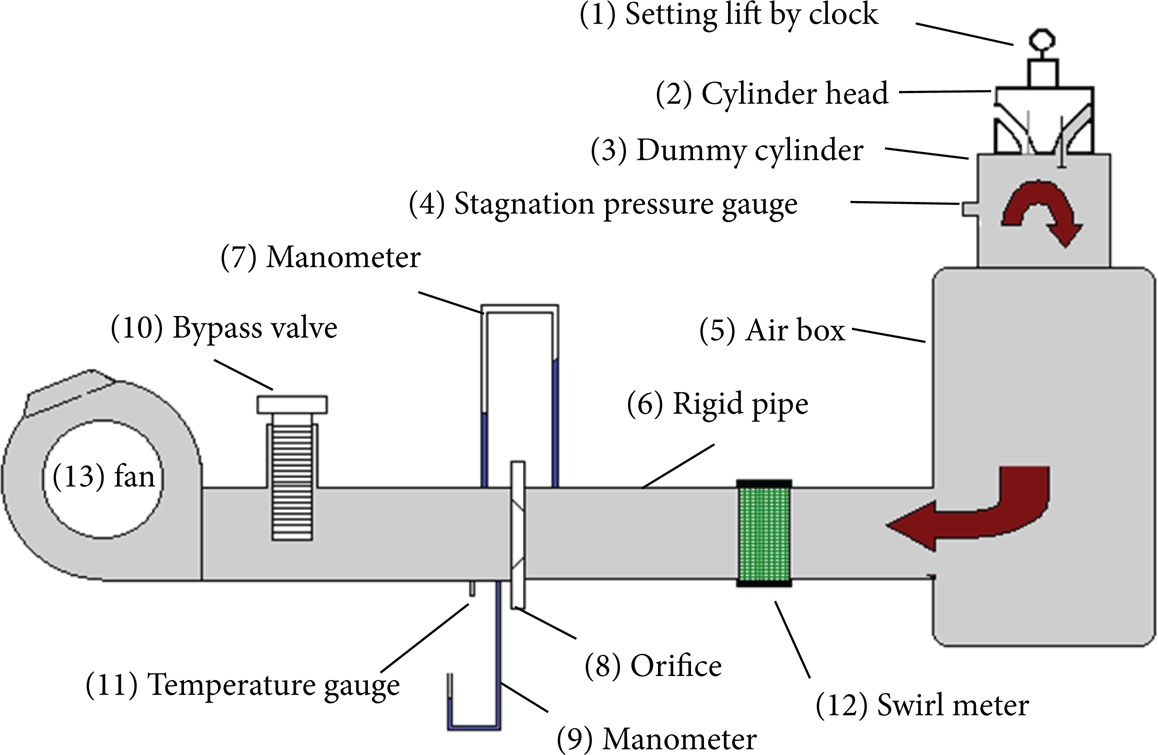
Schematic diagram of the flow bench.

Valve lift adjustment with fixtures and dial indicator.

Swirl meter types: (a) rotational speed measurement and (b) torque measurement [13].
Besides, a fan (13) is employed to suck the air from the ambient to simulate actual state in the engine.
The nature of the swirling flow in an actual operating engine is extremely difficult to determine. Accordingly, steady flow tests are often used to characterize the swirl. To this end, the air is blown steadily through the inlet port and the valve assembly in the cylinder head of an appropriately located equivalent cylinder.
The swirling flow is usually characterized by the light paddle wheel, pivoted on the cylinder centerline (with low friction bearings) (Figure 4(a)) or by the moment of angular momentum about a chosen axis (Figure 4(b)). In this paper, the rotation rate of the paddle wheel is used as a measure of the air swirl and is reported as the swirl intensity (ω).
Given the present study, at the time of measurement, the valve is first adjusted to the desired lift (from 1 mm to 9 mm with 1 mm increment). Then at each valve lift, the mass flow and the swirl intensity are recorded for 5 times and their average value is reported. Finally, the test procedure is repeated 10 times. Based on the described repetition instruction, the uncertainties of the flow coefficient and the swirl intensity measurement are calculated to be about 1% and 3%, respectively (Figures 5 and 6).

The effect of the valve lift on the flow coefficient (base test) including error bar.
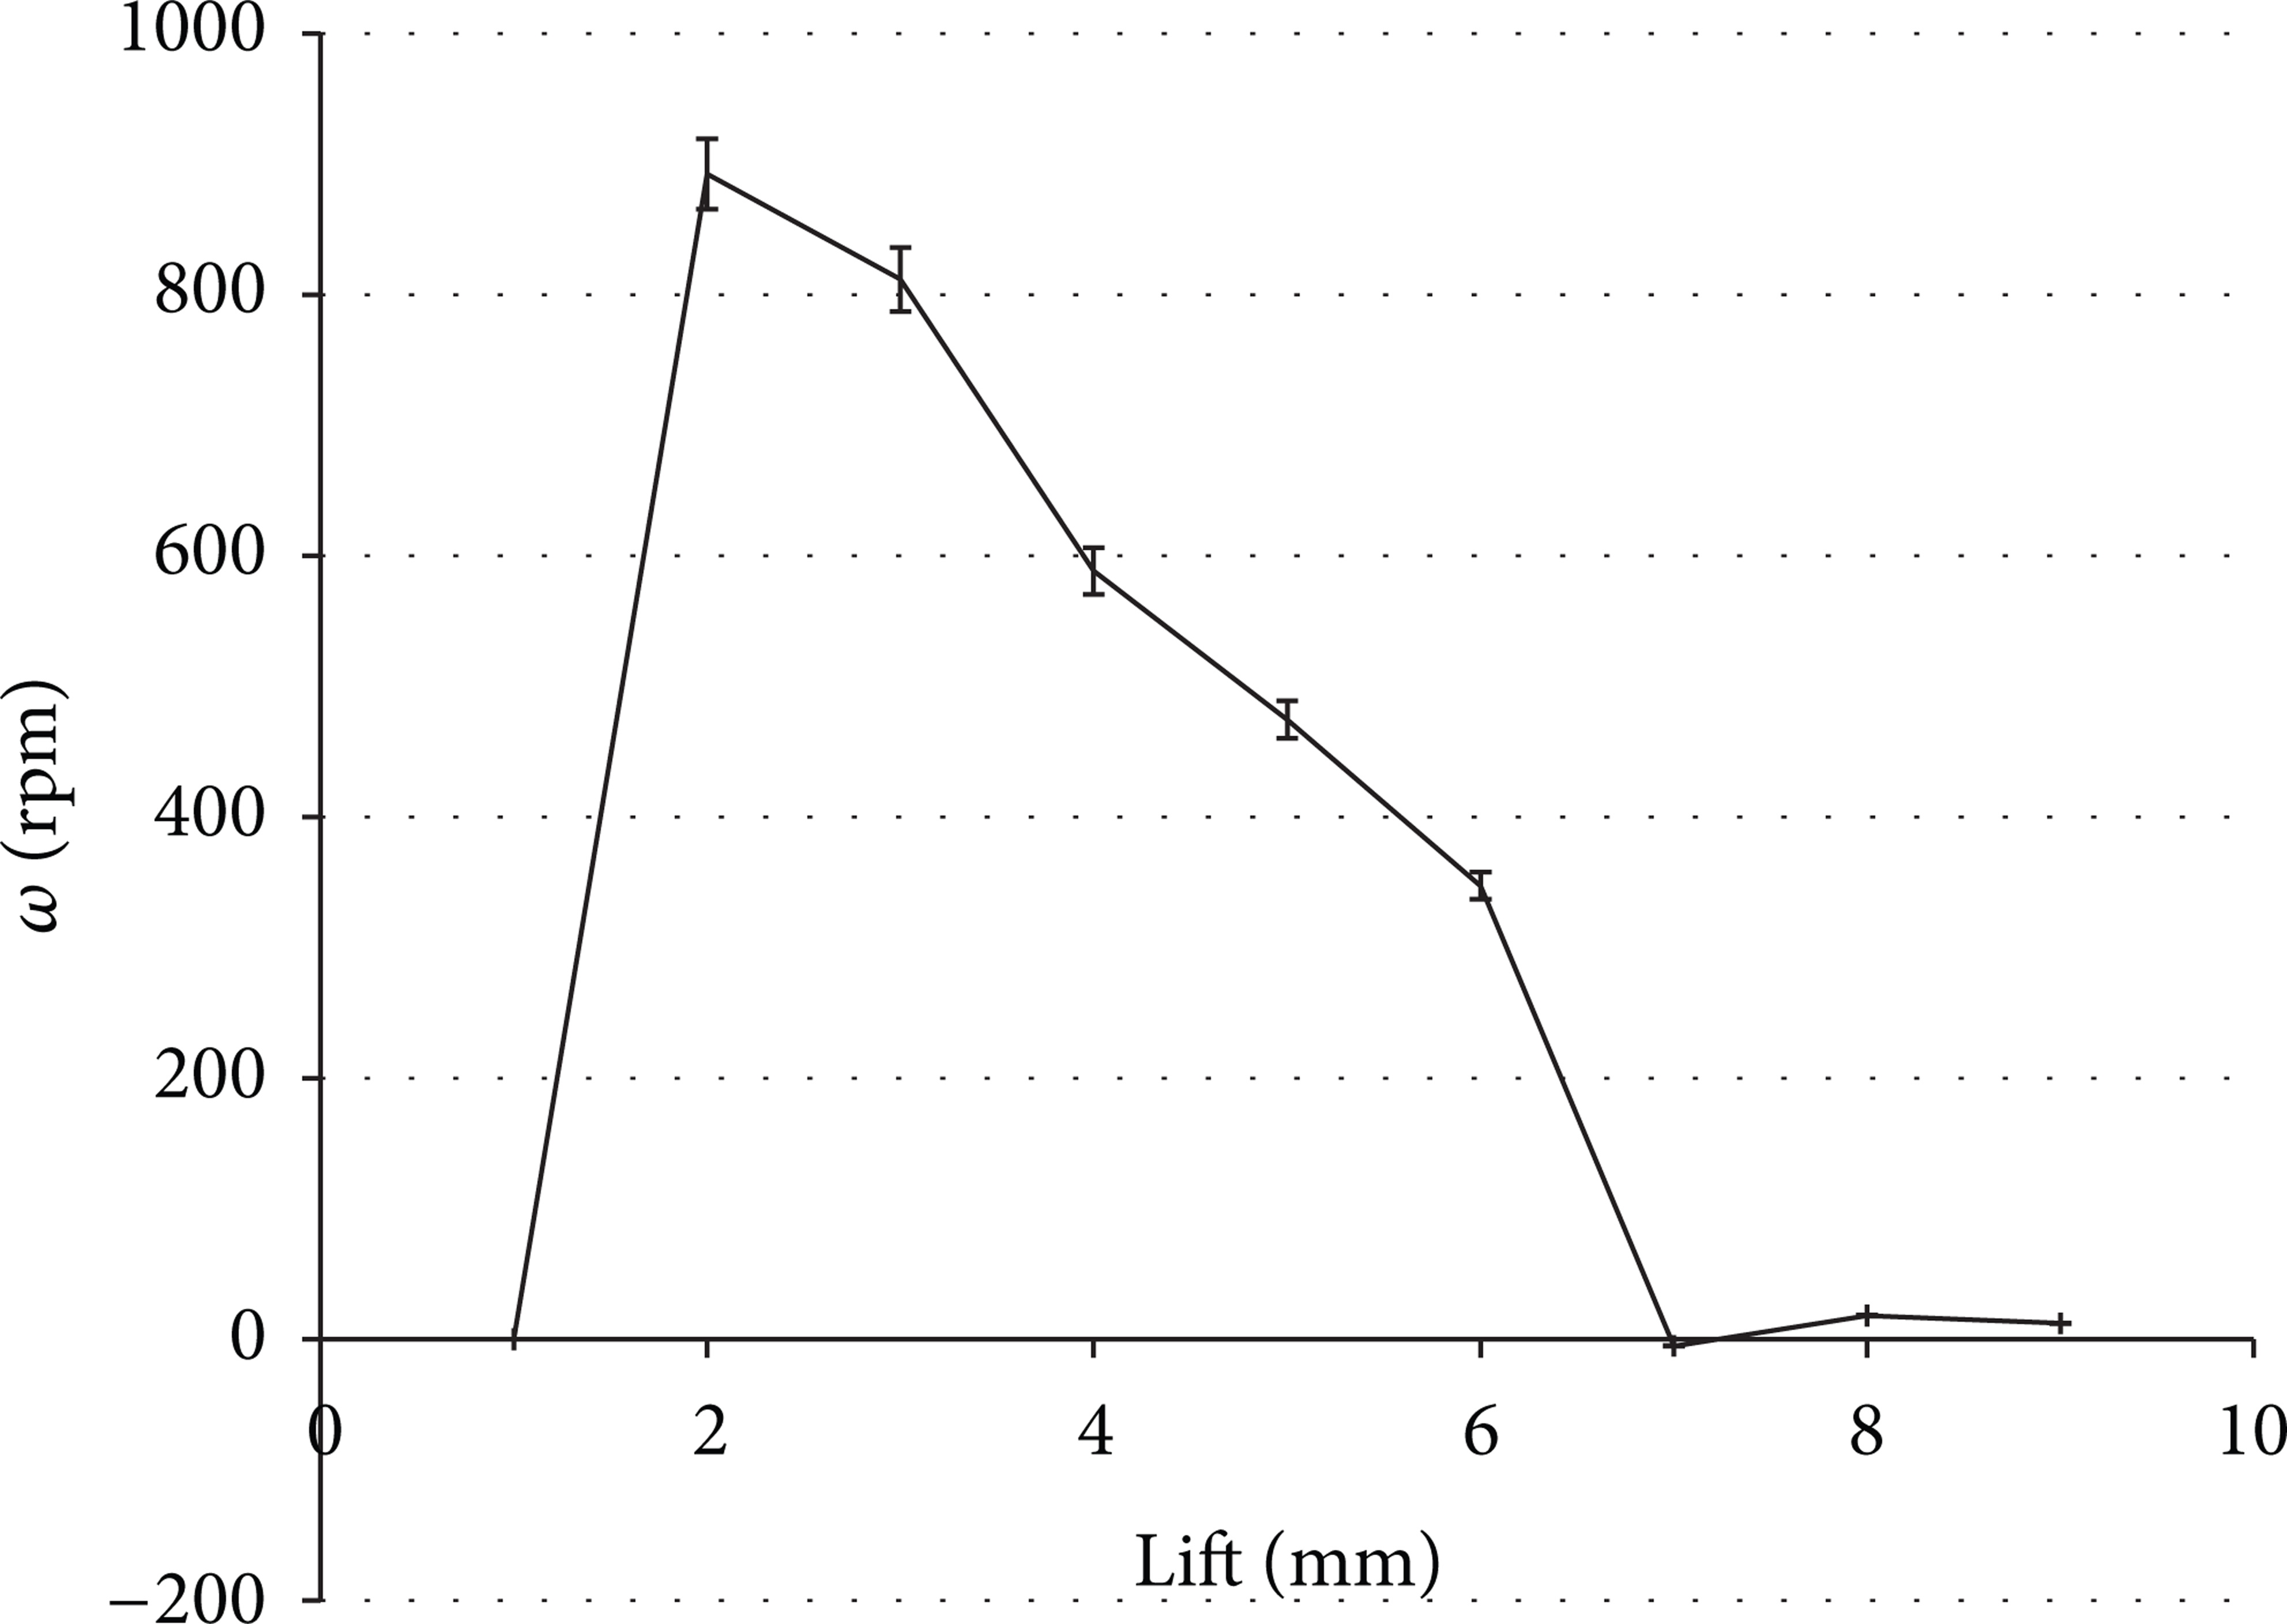
The effect of the valve lift on the swirl intensity (base test) including error bar.
3. Governing Equations
The flow and discharge coefficient are defined as the ratio of the experimentally obtained mass flow rate

If the flow is subsonic, the reference mass flow rate can be arrived at by the following formula:

At the same time, if the flow is choked, the mass flow is calculated as follows:

where p0 is the intake system pressure, p T is the cylinder pressure, T0 is the intake system temperature, and Aref is the reference area.
It is noteworthy here that the difference between the discharge and flow coefficient lies in the definition of the reference area Aref [10].
Regarding the discharge coefficient, the reference area is the valve curtain area and, therefore, it is a linear function of valve lift L v , expressed as

Given the flow coefficient, however, the reference area is defined as the valve inner seat area:

Furthermore, the mean flow coefficient

Considering the above formula, it can be viewed that the value of
The rotation of the cylinder charge is measured by a paddle wheel anemometer as the swirl intensity (ω) at each valve lift. The “mean swirl intensity”

4. Reference Test
In this section, the results of the reference test for the base configuration and test parameters are investigated so that comparisons can be drawn against the results obtained from other tests. The test is performed on the cylinder head of a 4-valve spark ignition engine. The engine specifications are given in Table 1.
Engine specification.

The reference test used for the purpose of this study is of the following features:
50 cm-H2O differential pressure;
inlet flow temperature = 30°C;
volume flow rate measured by the orifice, in the range of 20–71 liters per second;
symmetric intake valve lifting from 1 mm to 9 mm.
Figures 5 and 6 illustrate the flow coefficient and the swirl intensity versus the valve lift, respectively. As it is viewed in Figure 5, in the case of the low valve lift region, the value of the flow coefficient linearly increases with the valve lift. On the other hand, in the case of a high valve lift region, the flow coefficient converges to the specific value based on port design and is independent of valve lift. The flow coefficient is calculated according to the equations described in the previous section.
Figure 6 represents the reference test for swirl measurement. Theoretically, because of the symmetry in the ports, the swirl intensity in 4-valve SI engines is nearly equal to zero, yet some factors such as nonuniformity in the ports production and asymmetric valve lifting can create swirl in the cylinder.
According to Figure 6, at the lift of 1 mm, the swirl intensity is zero, while the maximum swirl intensity is at the lift of 2 mm. Following this lift, the swirl intensity gradually decreases toward zero.
5. Results and Discussion
In this section, the effects of some parameters on the flow coefficient and the swirl intensity is studied and comparisons are made with the reference test.
5.1. Entry Types
In the steady flow test, in order to allow the air to evenly enter into the intake duct, generally one of the following parts are added to the air entry location:
the intake manifold (Figure 7);
the flexible materials such as pulp (Figure 8);
the radius inlet guide (Figure 9) provides a smooth approach to the port being tested and decreases the “edge effect” at the port flange. The radius used should be as large as possible and be at least 1/2″. The thickness of the inlet guide and the size outside the port cross section should be at least 1/2 of the height of the port so that all directions have a smooth approach.

The intake manifold on the air entry location.

The flexible materials such as pulp on the air entry location.

Cylinder head with radius inlet guide in place.
Figure 10 illustrates the variations of the flow coefficient as a function of the valve lift for various types of entry. The pulp has a significant influence on the flow coefficient; that is, the value of C f increases as the pulp is added. The results also reveal that the rate of the increase in the case of high valve lift is more remarkable. There is a difference of about 1.5 percent in the lift of 3 mm and more than 14 percent in the lift of 8 mm. It is with the help of the pulp that the sharpness of entrance decreases which in turn reduces the pressure drop.

The effect of the entrance on the flow coefficient.
In the case of connection intake manifold to the air entrance location, as it is shown in Figure 10, because of the longer flow path, the pressure drop increases and consequently, the flow coefficient decreases slightly. The decrease of C f in the case of high valve lift is more significant between 3 and 4.5 percent.
The effect of mounting the intake manifold and the pulp on the swirl intensity is represented in Figure 11. As it can be observed, in both cases, the swirl intensity increases due to the even entry of the air into the intake duct. It is visible that the swirl intensity at the lifts of 1 and 9 mm is close to zero while at the lift of 2 mm, the swirl intensity of all entry types is near. The graph also indicates that the swirl is more significantly affected at the middle valve lifts.

The effect of the entrance on the swirl intensity.
5.2. Test Pressure
As it was discussed in the previous section, in this study, a pressure drop of 50 cm-H2O is considered as a reference. The effects of air pressure drop (between the ambient pressure and the cylinder pressure) on the flow coefficient and the swirl intensity are illustrated in Figures 12 and 13, respectively.

The effect of the flow test pressure drop on the flow coefficient.

The effect of the flow test pressure drop on the swirl intensity.
As it can be seen in Figure 12, the effect of pressure drop on the results is in the same order as that of the measurement errors. That is, a 25 cm-H2O increase in the test pressure drop increases the flow coefficient by about 1% at the middle lifts and by about 1.5% in the case of the high lifts.
In a similar vein, according to Figure 13, increasing the inlet mass flow rate escalates the paddle wheel rotational speed and the swirl intensity at the lifts of 1, 8, and 9 mm remains near zero. Interestingly, at the lift of 6 mm, the swirl intensity appears to be independent of the test pressure. With a 25 cm-H2O increase in the pressure drop, the maximum difference is about 50% at the lift of 2 mm.
The adaptor length (distance H), which is depicted in Figure 4, is generally considered as a function of the cylinder bore (e.g., 1.75 times of the cylinder bore) or a fixed length (e.g., 100 mm).
5.3. Adaptor Length
As another part of the study, analyses were carried out to investigate the effects of different lengths on the flow coefficient as well as the swirl intensity. As displayed in Figure 14, in the case of the middle and high valve lift region, the value of the flow coefficient decreases as the adaptor length increases. Similarly, when the adaptor length increases to 4 times as long as the original length, the flow coefficient is reduced by 5%.
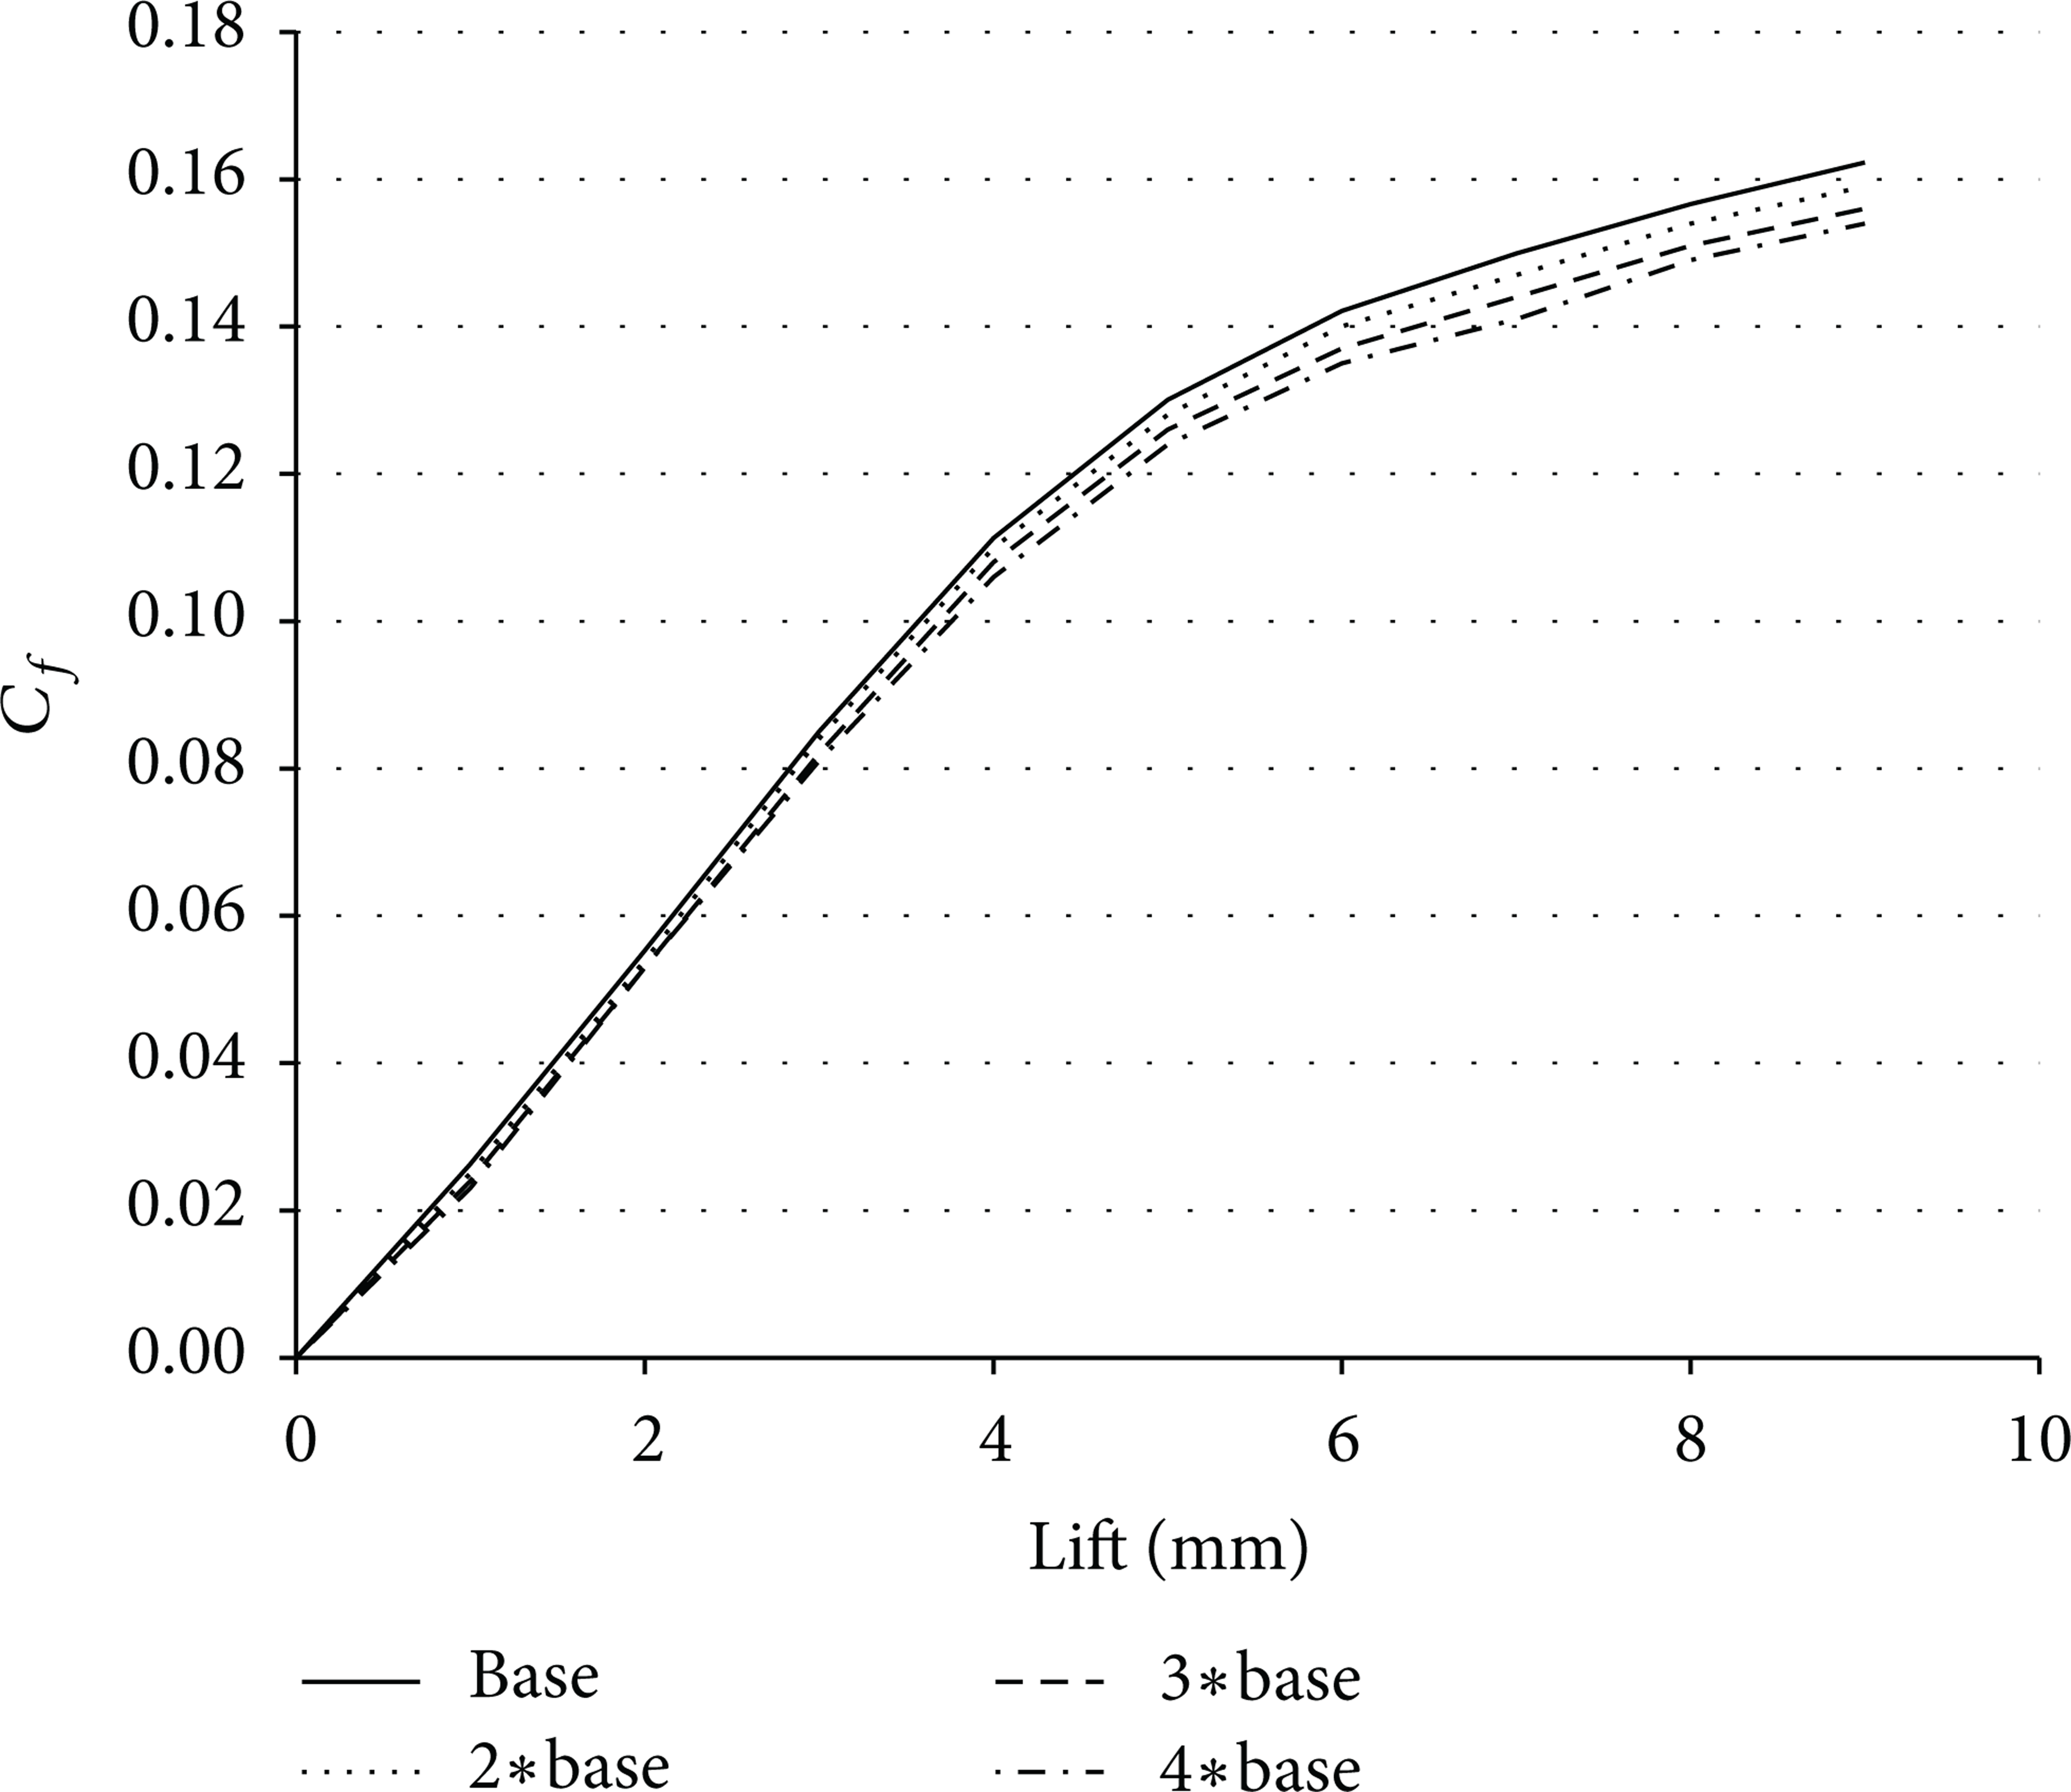
The effect of the adaptor length on the flow coefficient.
As indicated in Figure 15, the adaptor length has an influence on the swirl intensity and the rotation rate of the paddle wheel decreases as the adaptor length increases. The results also imply that the rate of the increase is more remarkable at the medium valve lift region. This is due to the fact that the radial flow weakens through the longer adaptor.

The effect of the adaptor length on the swirl intensity.
5.4. Diameter and Roughness of the Adaptor
The adaptor diameter is typically equal to the cylinder bore. In this section, the effect of the adaptor diameter on the flow coefficient and the swirl intensity is being studied. Figure 16 illustrates the variations of the flow coefficient as a function of the valve lifts for three various adaptor diameters. As one can clearly view, this parameter is of no influence on the flow coefficient. It can also be understood from the figure that the effect of the surface roughness is not considerable. In the case of the polished adaptor surface though, the flow coefficient increases by about 3%.

The effect of the adaptor diameter and roughness on the flow coefficient.
Since with the increase of the adaptor diameter the paddle wheel diameter remains fixed, it is predictable that the angular momentum at the adaptor edges is not detectable by the paddle wheel. This fact is depicted in Figure 17. It is also revealed that this parameter is not significantly influenced by the surface roughness.

The effect of the adaptor diameter and roughness on the swirl intensity.
5.5. Paddle Wheel Diameter
At this stage, a larger diameter (83 mm instead 79 mm) is considered for the adaptor in order to study the larger paddle wheel diameters.
Figure 18 illustrates the variations of the flow coefficient as a function of the valve lift for various paddle wheel mean diameters. As the figure implies, this parameter has no influence on the flow coefficient.

The effect of the paddle wheel diameter on the flow coefficient.
Figure 19 also indicates that at the lifts of 2 and 3 mm, the smaller diameters lead to a larger swirl intensity, while at the lifts of 5 mm until 9 mm, a larger swirl intensity is obtained for larger diameters. Therefore, the findings signify that the effect of paddle wheel diameters on the swirl intensity is not substantial.
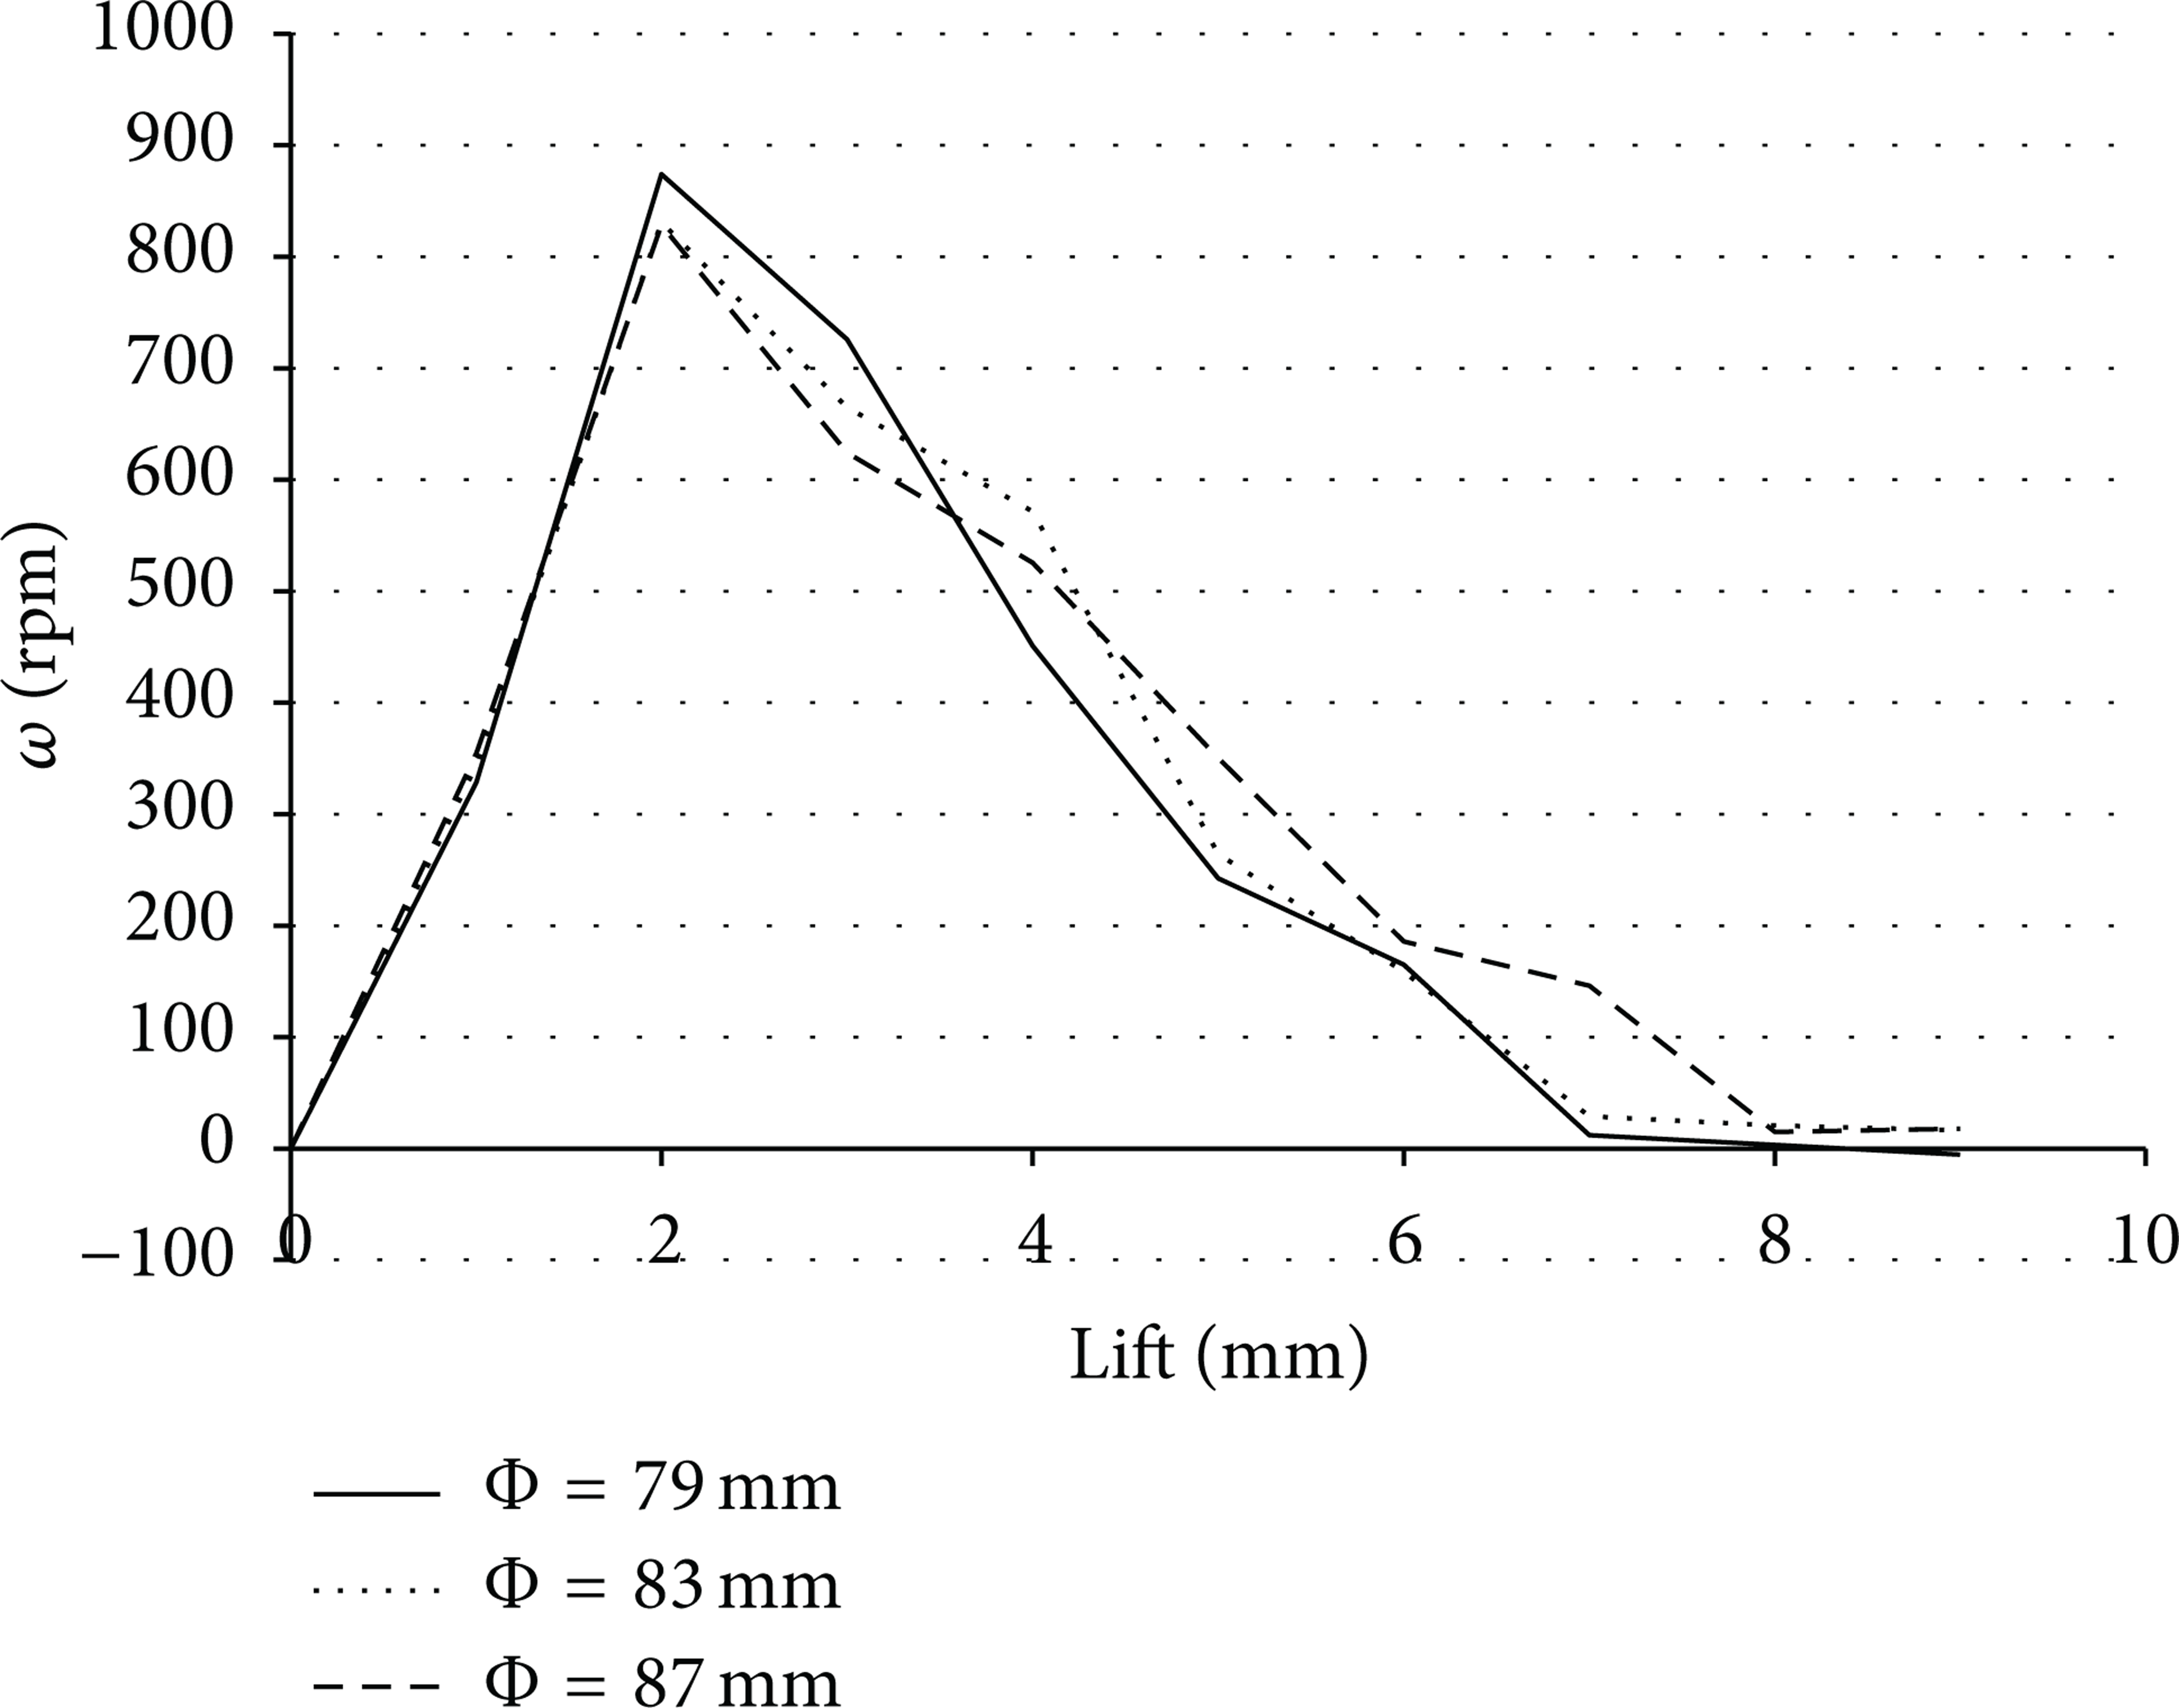
The effect of paddle wheel diameter on swirl intensity.
5.6. Asymmetric Valve Lifting
In the standard test of a four-valve engine (two intake and two exhaust valves), the intake valves should be open uniformly, and the previous diagrams are obtained based on this condition. Sometimes, the asymmetric valve lifts occur due to following reasons: (1) creation of a vortex flow, (2) inaccurate production processes, and (3) nonprecise valve lift fixtures.
The interactions of valve lifts signify the ability to vary the cylinder swirl by having asymmetric lifts or complete valve deactivation. Tests were carried out with the lifts of left and right intake valves varying separately. Figures 20 and 21 represent the results obtained for the flow coefficient and the swirl intensity, respectively. As it is observable in these figures, when the lifts of left and right valves are changed simultaneously, the intensity of the swirl remains about zero, whereas the flow coefficient increases with the increase of the valve lift. Furthermore, a significant increase in the swirl is observed when a valve is completely deactivated.

The flow coefficient at the different valves lifts.
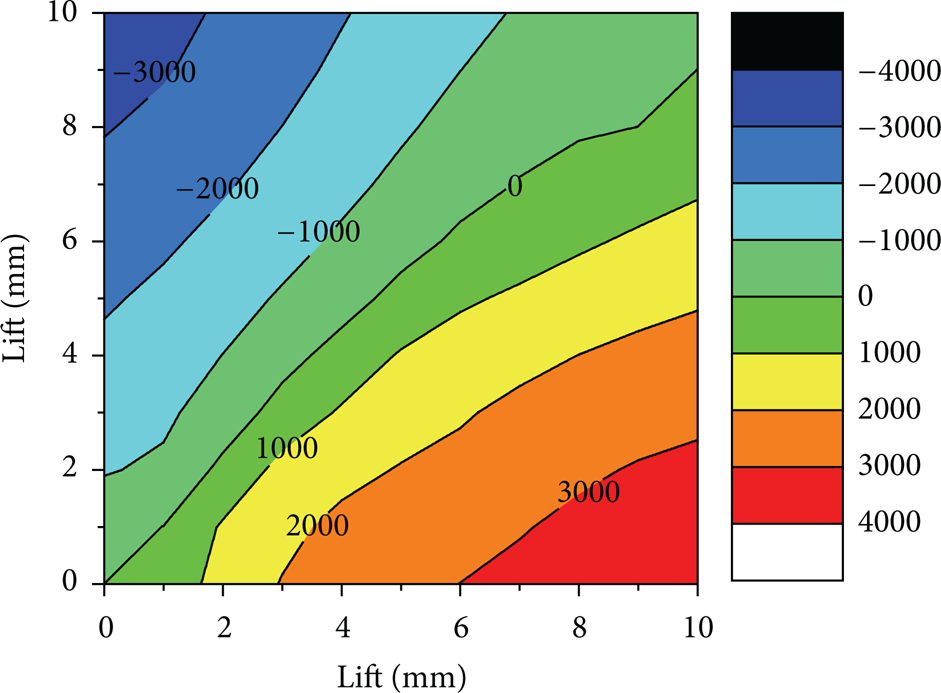
The swirl intensity at the different valves lifts.
At each position of the engine performance map, one of these conditions might be met to cause a better compromise between the combustion efficiency and volumetric efficiency.
6. Data Correlation
In order to conduct the analyses, first the mean flow coefficient and the mean swirl intensity of each test are calculated based on the above results (6), (7). The values obtained for

The mean flow coefficient

The mean swirl intensity
According to Figure 22, the entry type and the adaptor length have significant influences on the mean flow coefficient
In order to find out the relationship between the effective and quantitative test parameters, including the test pressure, the adaptor length and the adaptor diameter, and the
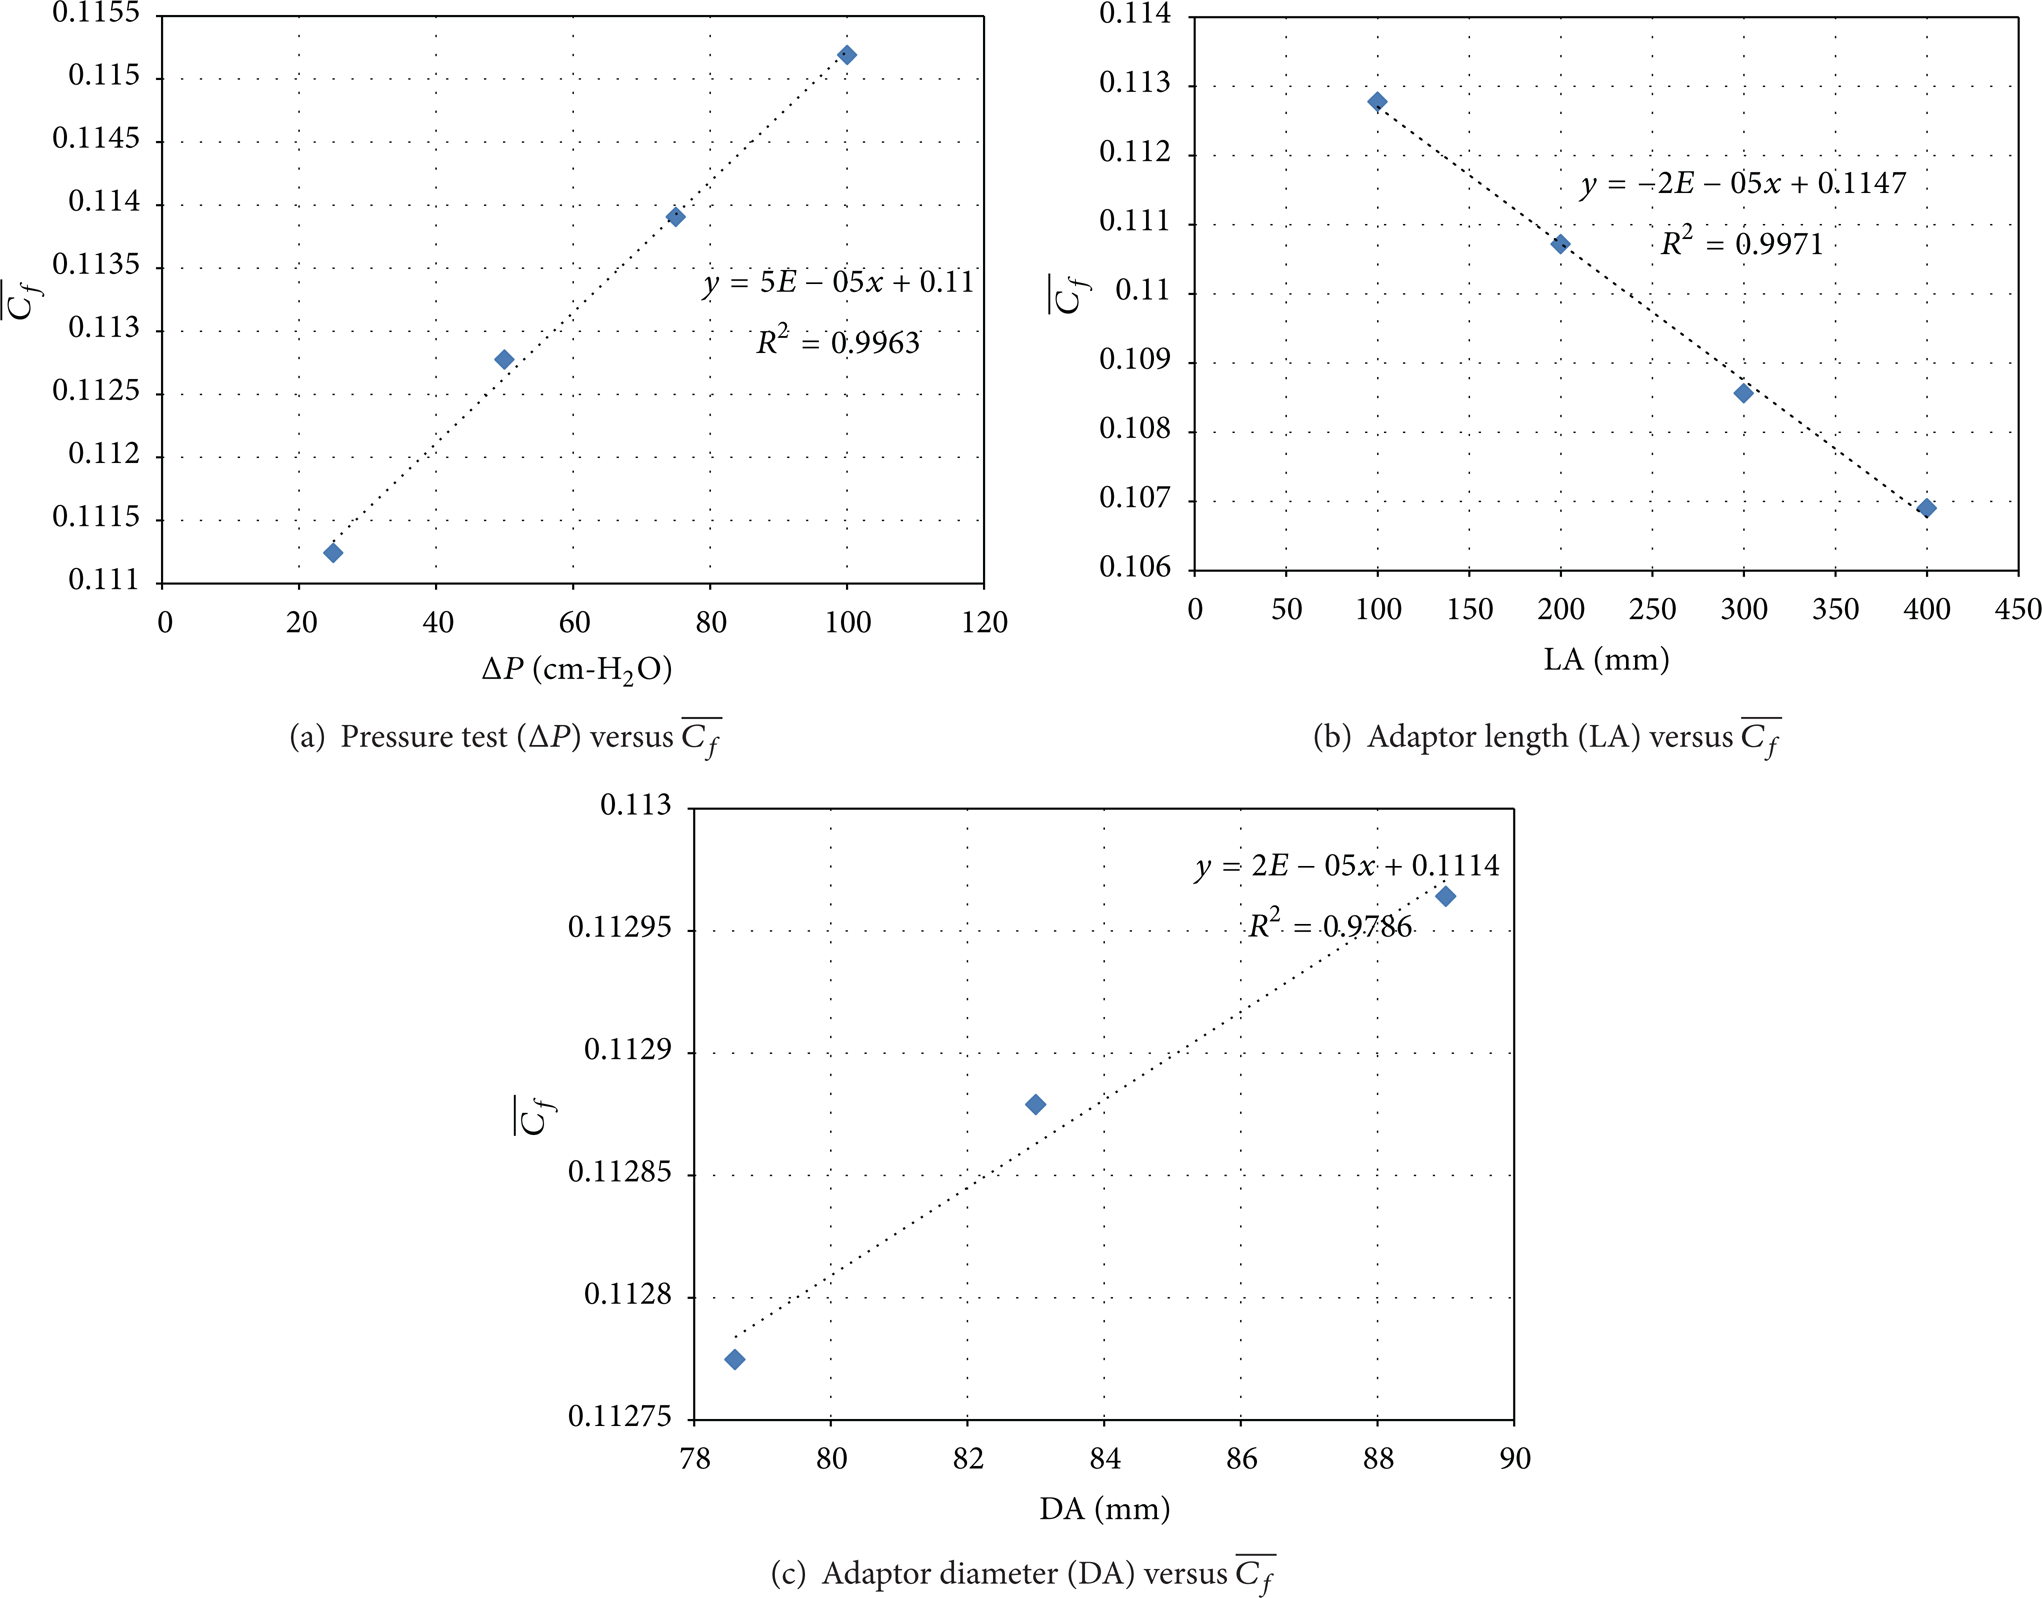
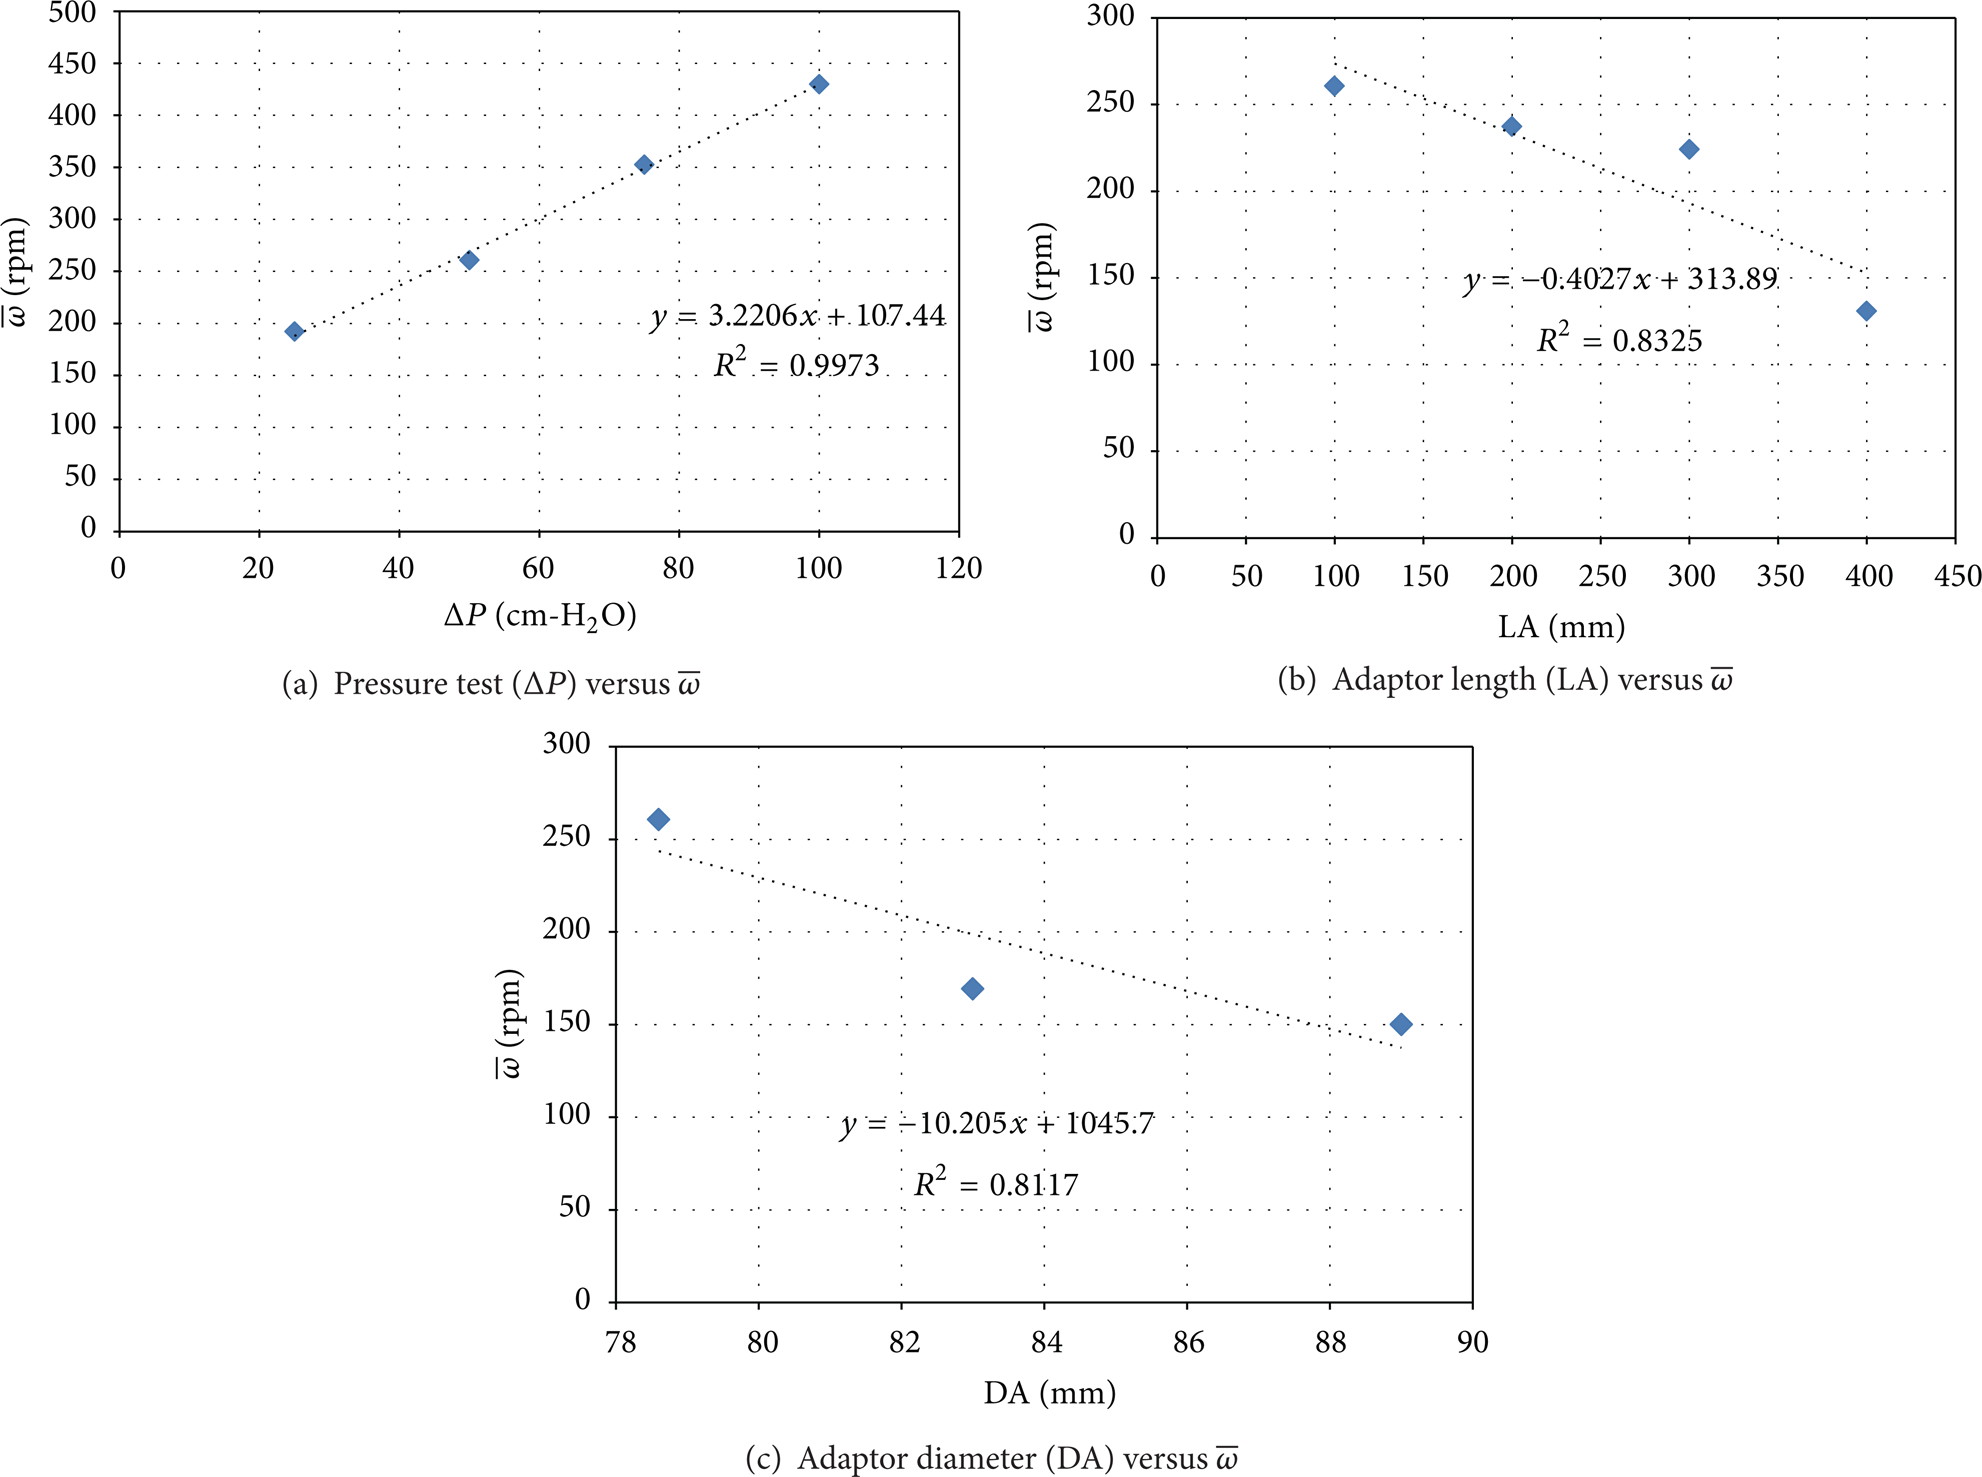
Finally, the correlation equations from the analysis could be obtained as shown in (8) and (9) below:


The errors between
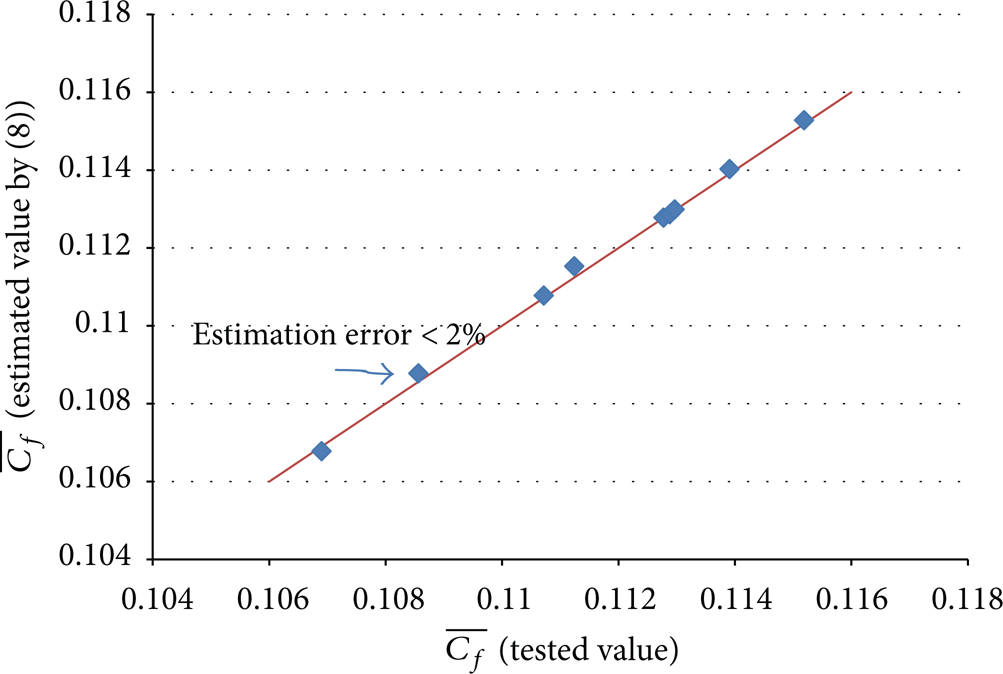
The comparison of measured and estimated

The comparison of measured and estimated
Through this analysis, it was found that the most effective parameter on
The correlation equations achieved can be used for further investigation of the test parameters effects to prevent unnecessary additional works. In some aspects, it will be also useful to compare different results obtained with regard to different test conditions.
7. Conclusion
The experimental work presented in this paper was aimed at analyzing the influence of different steady flow test bench test parameters on the flow coefficient and the swirl intensity. The analyses results indicated that mounting the pulp at the intake port increases the flow coefficient in the case of the high valve lift region, while when the intake manifold is mounted, because of a longer flow path, the flow coefficient decreases. In addition, it was observed that the rotational speed of the swirl meter (swirl intensity) increases when the pulp or the manifold is connected to the cylinder head. The tests also revealed that the mass flow rate increases slightly as the drop pressure grows, while the swirl intensity increases considerably. Furthermore, the flow coefficient and the swirl intensity decline as the length of the adaptor increases.
In the limited range of paddle wheel diameter variation, no change in the flow coefficient was observed and the effect of this diameter on the swirl intensity turned out to be negligible.
Therefore, based on the observations made, it can be concluded that, except for the type of the intake adaptor and asymmetric valve lifting, the other parameters have no clear effect on the flow coefficient. In fact, with mounting the standard intake adaptor and precise symmetric valve lifters, the result of various test centers can be used by others. Yet it has to be noted that the swirl intensity is sensitive and varies with different test parameters.
Moreover, asymmetric valve lifting can be used for load control of a spark ignition engine. In the idle mode or low load of an engine, because of the low turbulence in cylinder, it is possible to use this concept to increase the turbulence with swirl intensity.
Finally, the analyses were performed to correlate some test parameters with the mean flow coefficient and the mean swirl intensity.