
Abstract
The thermal characteristics of an alternating current light-emitting diode (AC LED) chip based on a three-dimensional unsteady numerical simulation are discussed. In this model, the difficulties due to the tiny scale and extra-low aspect ratio of the AC LED microchip geometry are resolved. A time lag between the maximum forward voltage and the highest mean junction temperature is observed. The influence of different input power frequencies on the thermal fields is also investigated for AC LEDs with 600 μm × 600 μm area. A numerical simulation of the junction temperature distributions shows that the AC LED has a better performance under a higher frequency than under a lower frequency.
1. Introduction
Light-emitting diodes (LEDs) have many advantages compared to the conventional light sources, such as their narrow spectrum, long lifetime, and good mechanical stability [1]. High-brightness LEDs have demonstrated excellent ability for functioning in back and general lighting applications [2]. LEDs are usually considered DC devices, powered by a few volts of direct current. The fabrication process and frequency response of alternating current (AC) polymeric LEDs (e.g., polyaniline, 3-hexylthiophene) have already been discussed in the literature [3, 4]. The structure of the polymer and the frequency of the input AC have an influence on the experimental results, including the luminance and response time of the LEDs. Tamura et al. [5] assembled 697 InGaN-based white LEDs with a series of connections on a glass epoxy substrate to form a 10 candela LED AC 100V-powered array. They then measured the temperature and the basic illumination characteristics of the array. Ao et al. [6] successfully designed a blue 40-chip AC LED array powered by alternating current, which led to the development of chip-level semiconductor AC LEDs. A single device had a chip size of 150 μm × 120 μm while the LED array had a total size of 1.1 mm × 1 mm, and an output power of 40 mW under AC 72 volts. A novel chip design for an AC LED was proposed by Yen et al. [7], which increased the lighting area in each bias direction to improve the device efficiency through the use of a Wheatstone bridge circuit design.
There have been some previous studies focusing on the structure, fabrication, and thermal issues of the DC LED. However, the input power of an AC LED is an alternating current, so the thermal effect is not the same as that for a DC LED. Hwu et al. proposed a method for measuring the mean junction temperature of an AC LED [8]. In the present study, we apply a three-dimensional unsteady numerical model to simulate the thermal behavior of an AC LED chip. The temperature oscillation under AC operation can thus be obtained through numerical simulation.
2. Numerical Model
The AC LED sample consists of a 12 volt AC microchip array, as shown in Figure 1(a); a schematic representation of a cross-section of a microchip in the lateral direction is shown in Figure 1(b). The chip size is 600 μm × 600 μm × 106 μm. The AC LED chip consists of an ITO layer (0.5 μm), p-GaN layer (0.2 μm), MQW (0.8 μm), n-GaN layer (4.5 μm), and sapphire substrate (100 μm). The directions of current flow in the array for the positive half period and negative half period under alternating conditions are shown in Figures 2(a) and 2(b), respectively. A self-developed code coupling the thermal and electrical equations is added to the finite element method (FEM) software COMSOL Multiphysics which is used to obtain the temperature in the AC LED chip. The simulation was performed in a three-dimensional, unsteady condition. The meshes of the AC LED are shown in Figure 3. There is a total of 58567 tetrahedral elements. The relative tolerance for the numerical value of the temperature is selected to be 1 × 10⁻⁴.

(a) Photograph of the AC LED chip, and (b) the schematic representation of a cross-section in the lateral direction of a microchip.

Directions of current flow in the chip array.

Tetrahedral element structure of the AC LED chip.
Following our previous work [9], the current through the active layer is assumed to be in the direction perpendicular to the layer. The specific p- and n-contact resistances also follow previous work. The unsteady governing equation of conduction heat transfer with the heat source is
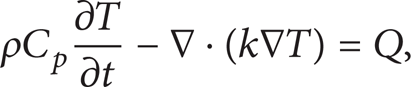
where ρ is the density; C p is the specific heat; T is the temperature; t is the time; and k is the thermal conductivity. The heat generation term Q in the active layer is as follows [9]:
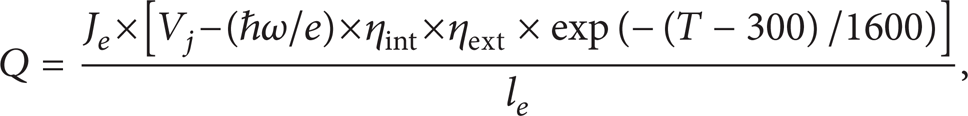
where J e is the elemental current density; V j is the voltage drop between the active layer; ℏ is the reduced Planck constant; ω is the angular frequency; η int is the internal quantum efficiency at room temperature; ηext is the light extraction efficiency at room temperature; and l e is the elemental thickness of the mesh. The term ℏω is the energy of the photon, thus (ℏω/e) is the electrical potential converted from the energy of photon. The values of the external quantum efficiency (η int × ηext), as obtained in the literature [9], are between 13% and 43%. Thus, in the present study, η int × ηext = 25% is selected.
The heat generation term per unit volume Q due to Joule heating in the other layers of the LED chip is

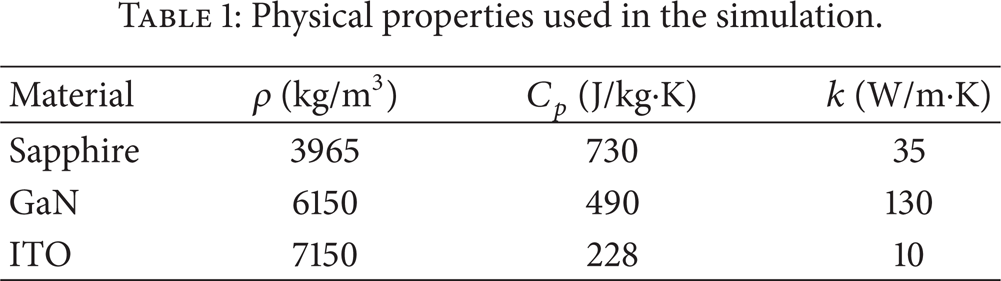
The physical properties of the materials are summarized in Table 1 [10, 11].
Physical properties used in the simulation.
The boundary conditions of the top and lateral surfaces of the AC LED chip are shown by

where
The boundary condition at the bottom surface of the AC LED chip is assumed to be

where h e is the equivalent heat transfer coefficient. A copper slug with a board is usually used to dissipate the heat generated from the AC LED chip. The size is set to be about 7.2 cm2 in the present study. Under natural convection conditions, the Biot number for the slug is very small, therefore, the temperature variation along the main heat flow direction inside the slug is insignificant. For this case, h e is about 160,000 W/m2·K.
3. Results and Discussion
Figures 4(a)–4(i) show the temperature distributions in the AC LED chip under 12 volts of AC current and a frequency of 60 Hz in one alternating period (t = 0.0116 sec–0.0283 sec). These figures indicate the highest and lowest temperatures observed for the whole AC LED chip at different time steps. Under alternating conditions, the two central microchips are both turned on during the positive half period or negative half period, so the temperature of these two microchips varies in the frequency of 120 Hz. The highest temperatures for the negative half period and positive half period are 339.5 K and 338.5 K, respectively. The temperature difference of 1 K between these two half periods may be due to the fact that the mesa structure and the electrode are not totally symmetrical in the middle line of the chip array. The current crowding effect and the heat transfer path at the negative half period and positive half period are both different. The mean junction temperature for the whole AC LED chip for each time step is obtained from the numerical simulation result, as shown in Figure 5. An LED is turned on when the forward voltage is higher than the threshold voltage, thus the voltage is always positive. When an AC LED is driven under the AC condition, the current during the positive half period will flow through a different chip array. Therefore, the forward voltage in Figure 5 is always positive. There is a 0.002 sec time lag between the maximum forward voltage and the highest mean junction temperature as observed in Figure 5. The main reason for this may be that the LEDs have the characteristics of diodes. The chip will be turned on when the threshold voltage is reached after a time difference of about 1/480 sec. The shape of the mean junction temperature curve is not the same as the shape of a sine wave possibly because the thermal diffusion time (0.0012 sec) of this LED chip is far greater than the time scale of the electron diffusion.

Temperature distributions of the AC LED chip under an AC 12 volts and a frequency of 60 Hz in one alternating period (unit of t: sec).
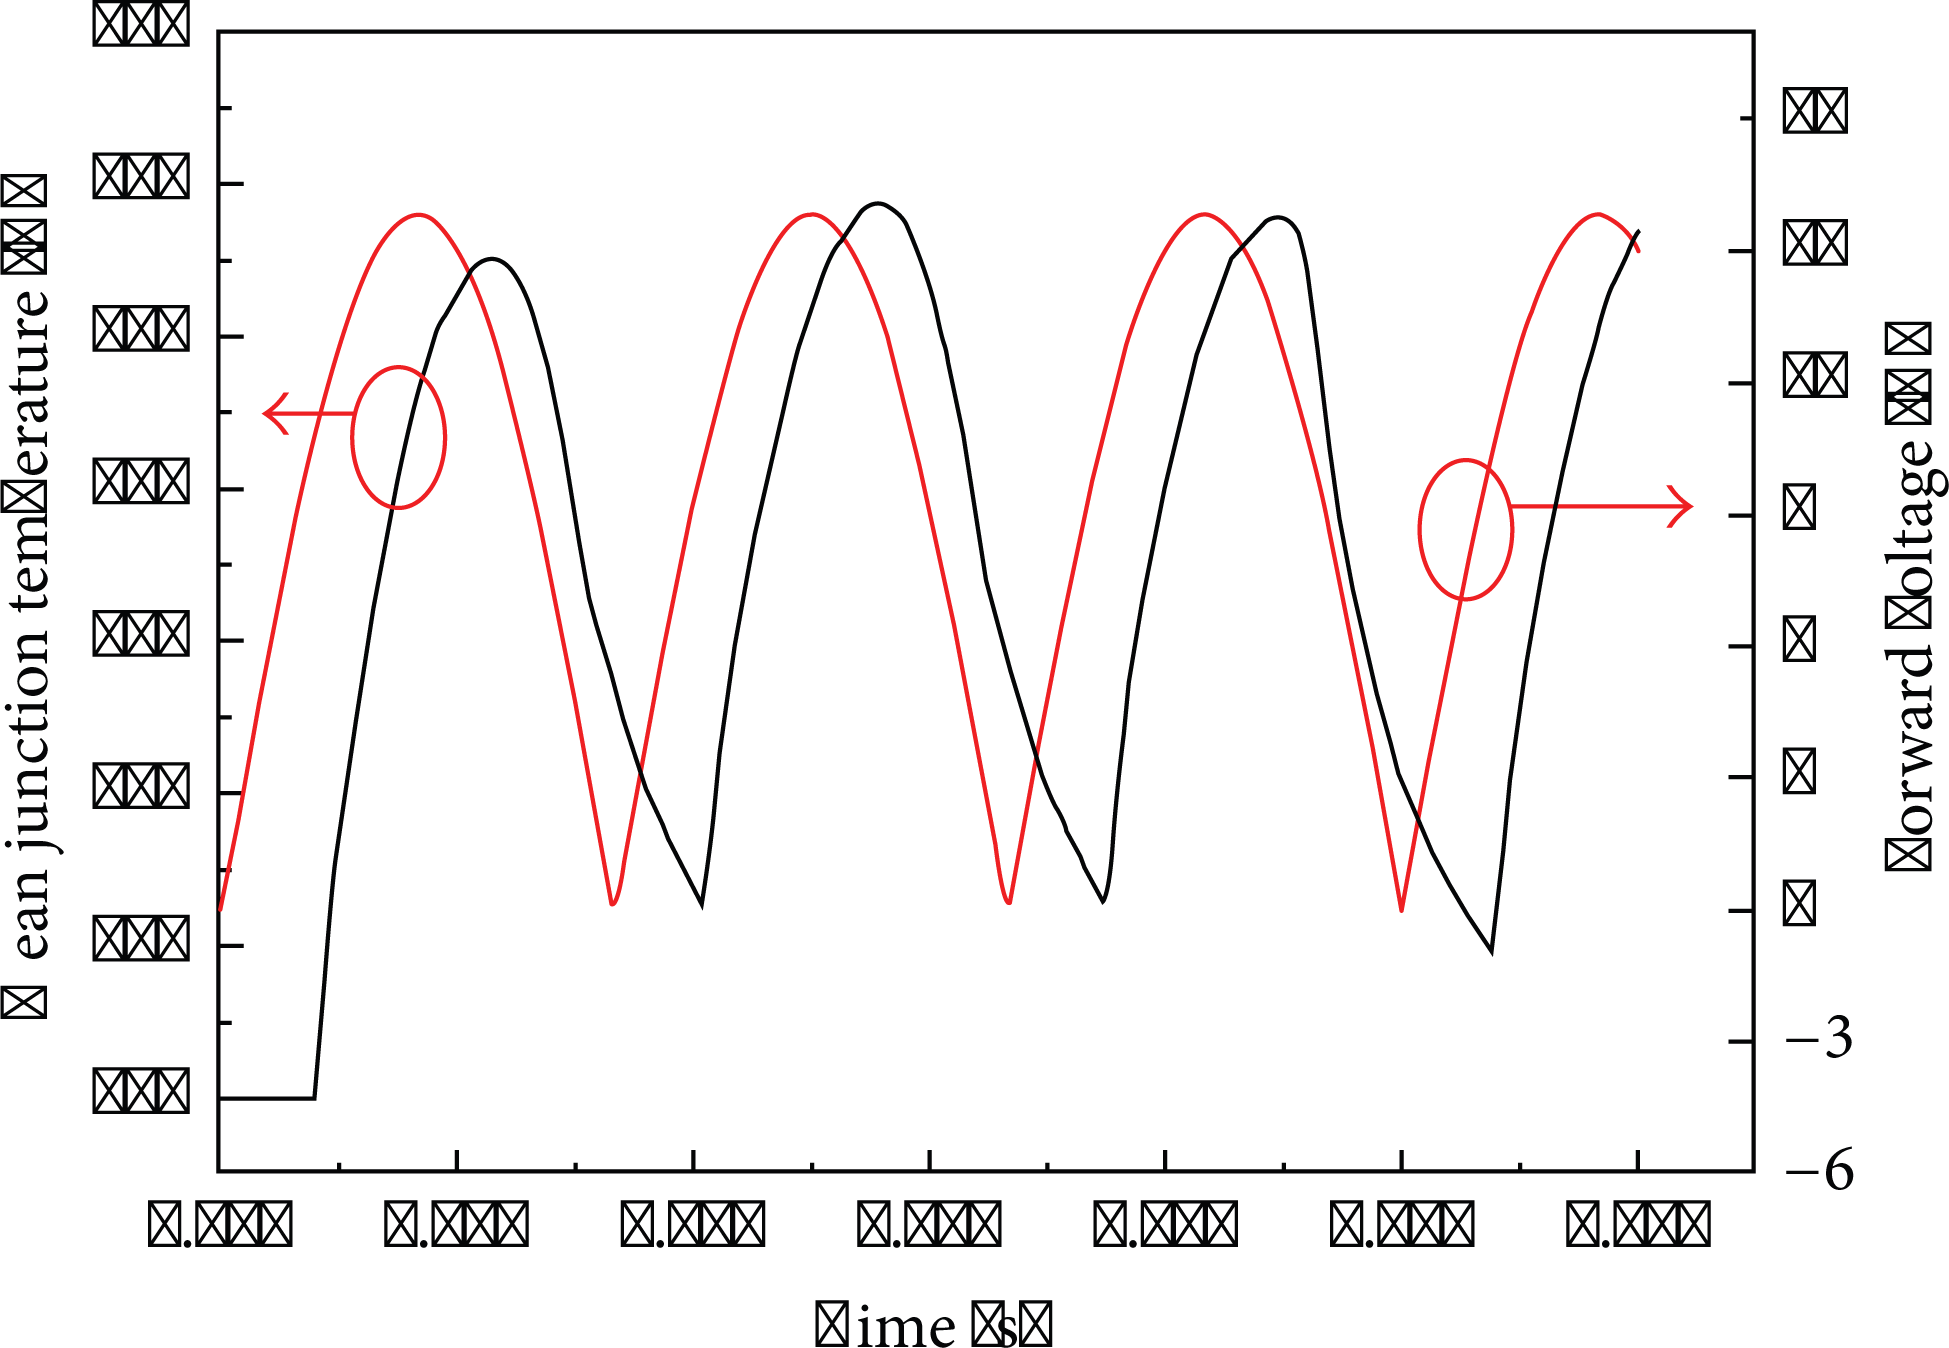
Mean junction temperature of the AC LED chip under AC 12 volts and a frequency of 60 Hz.
Figure 6 shows the mean junction temperature of an AC LED chip driven under different alternating frequencies. When the frequency is higher, the difference between the highest temperature and the lowest temperature is smaller. The temperature difference between the highest and lowest temperature is about 24 K when the frequency is 60 Hz. However, when the frequency is 240 Hz, the temperature difference is only 10 K. Additionally, the curve of the mean junction temperature is more symmetrical under higher frequency than the case with a lower frequency. This is due to the on-off interval of the AC LED for the higher frequency case being shorter than the lower frequency cases. The time is not sufficient for the junction temperature to reach a higher value. Equally, the junction temperature cannot reach a lower value before the chip is turned on again. Therefore, the rates of junction temperature increase and decrease are more stable in the case of higher frequencies than lower frequencies. The AC LED chip is more suitable for driving under higher frequency to avoid the fatigue of the cyclic thermal stress.

Mean junction temperature of the AC LED chip under different alternating frequencies.
4. Conclusions
The present study proposes a three-dimensional unsteady numerical model for AC LED chips. The thermal characteristics of AC LEDs are analyzed through a numerical simulation. The highest temperature of the AC LED chip is about 339 K under AC 12 volt operation with a frequency of 60 Hz. Otherwise, the mean junction temperature can be calculated by the numerical model. The highest mean junction temperature is about 330 K. The numerical simulations results show a time lag of 0.002 sec between the maximum forward voltage and the highest mean junction temperature. The unsteady numerical model can be used to find the thermal characteristics and to design AC LED chip patterns. The influence of the driving frequency on the AC LED is also discussed. A higher driving frequency will lead to a lower mean junction temperature difference for AC LEDs.
Footnotes
Acknowledgment
The authors gratefully acknowledge the support of the National Science Council of Taiwan, Taiwan for this work, through Grant no. NSC 101-2221-E-253-006.