
Abstract
A new method for calculating the operational efficiency of a pumping station has been developed based on the integral principle and operation rules of the pump flow rate. To determine the energy saving space of a pumping system and to reflect the relationship between supply and demand, a new method for evaluating the energy consumption rate of a pump system has been developed based on the principle of an inverter-controlled water supply with varying pressures. These methods have been applied to a pump station with an apparently efficient operation. By evaluating energy consumption based on actual demand, we developed a new strategy that configures a single frequency converter with a small transitional pump and decreases the energy consumption by almost 14% with a payback time of less than three years.
1. Introduction
Energy conservation and the reasonable resource utilization have become imperative given the recent energy crisis, shortage of resources, and spread of environmental pollution in China. Nearly 20.9% of the electrical energy demand in the country is satisfied by pumping systems. Therefore, energy reduction and conservation of these pumping systems must be highlighted.
According to the American Hydraulics Institute, 30% of the total electrical energy consumed by these systems can be conserved by designing highly efficient systems and by using appropriate pumps. China fails to conserve more energy because it uses pumping systems with practical operating efficiency levels that are 10% to 30% lower than the advanced systems being used in foreign countries [1].
Therefore, producers and users of pumps must design or adopt highly efficient pumping systems. The efficiency of these systems must be evaluated to differentiate an efficient system from an inefficient one as well as to focus on systems that are likely to consume less energy. Moreover, a pumping system cannot simply be identified as highly efficient because the assessment of such system involves multiple factors, which makes it difficult for many users to understand the energy costs and energy reduction potential of these systems [2–6].
Several organizations and researchers have made significant developments in assessing the efficiency of pumping systems. For example, the American Hydraulics Institute has developed the pumping system assessment tool (PSAT), which remains widely used [7].
PSAT calculates the efficiency of the motor and pump based on field measurements, the nameplate type of motor, and other pump information. This tool also estimates the potential efficiencies of the motor and pump in meeting their flow and head requirements. However, this tool can only provide a reference of the potential energy cost and savings of a pumping system given the following limitations [8].
The energy consumption and efficiency of a pumping system are calculated through a special operation. However, the pump does not only operate under certain special operation points, but also under constantly changing operations in most parts of the system. This condition produces inaccurate estimates of energy consumption in a particular operation point. Therefore, a new method for calculating the energy consumption of a pumping system must be adopted.
The potential for a pumping system to decrease its energy consumption is estimated based on the optimal cost reduction that other pumping systems have achieved. However, this method often shifts the focus of the user to the efficiency of a particular system or to the optimum values that are achieved by other systems, which disregards the superfluous supply that may be the key point of energy conservation. Therefore, a better supply operation control line must be developed for the pumping system to conserve more energy without disregarding any superfluous supply. However, the procedures for developing such method remain unknown [9–11].
Given these limitations, this study aims to formulate a new method for calculating the energy consumption and potential energy cost reduction of a pumping system.
2. Profiles of the Pump Station
A circulating water pumping station in an alumina plant is selected for this study. This station is regarded as one of the most important facilities in the plant for its role in the mother liquor evaporation process and its consumption of 17% of the total electricity of the plant.
The station has eight single-stage pumps and double suctions, including four hot pumps of the same model (three in use and one still being prepared) and four cold pumps of the same model (three in use and one still being prepared). All pumps are matched with a 10 kV voltage motor, and the groups of hot and cold pumps are controlled by a throttle in the system (see Figure 1).

Pump station image.
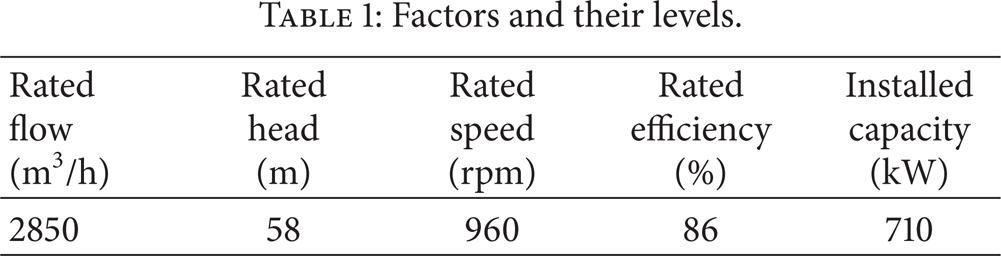
The cold pump group is used as the sample in this study. Table 1 shows the design parameters of the cold water pump, whereas Figure 2 shows its performance curve.
Factors and their levels.
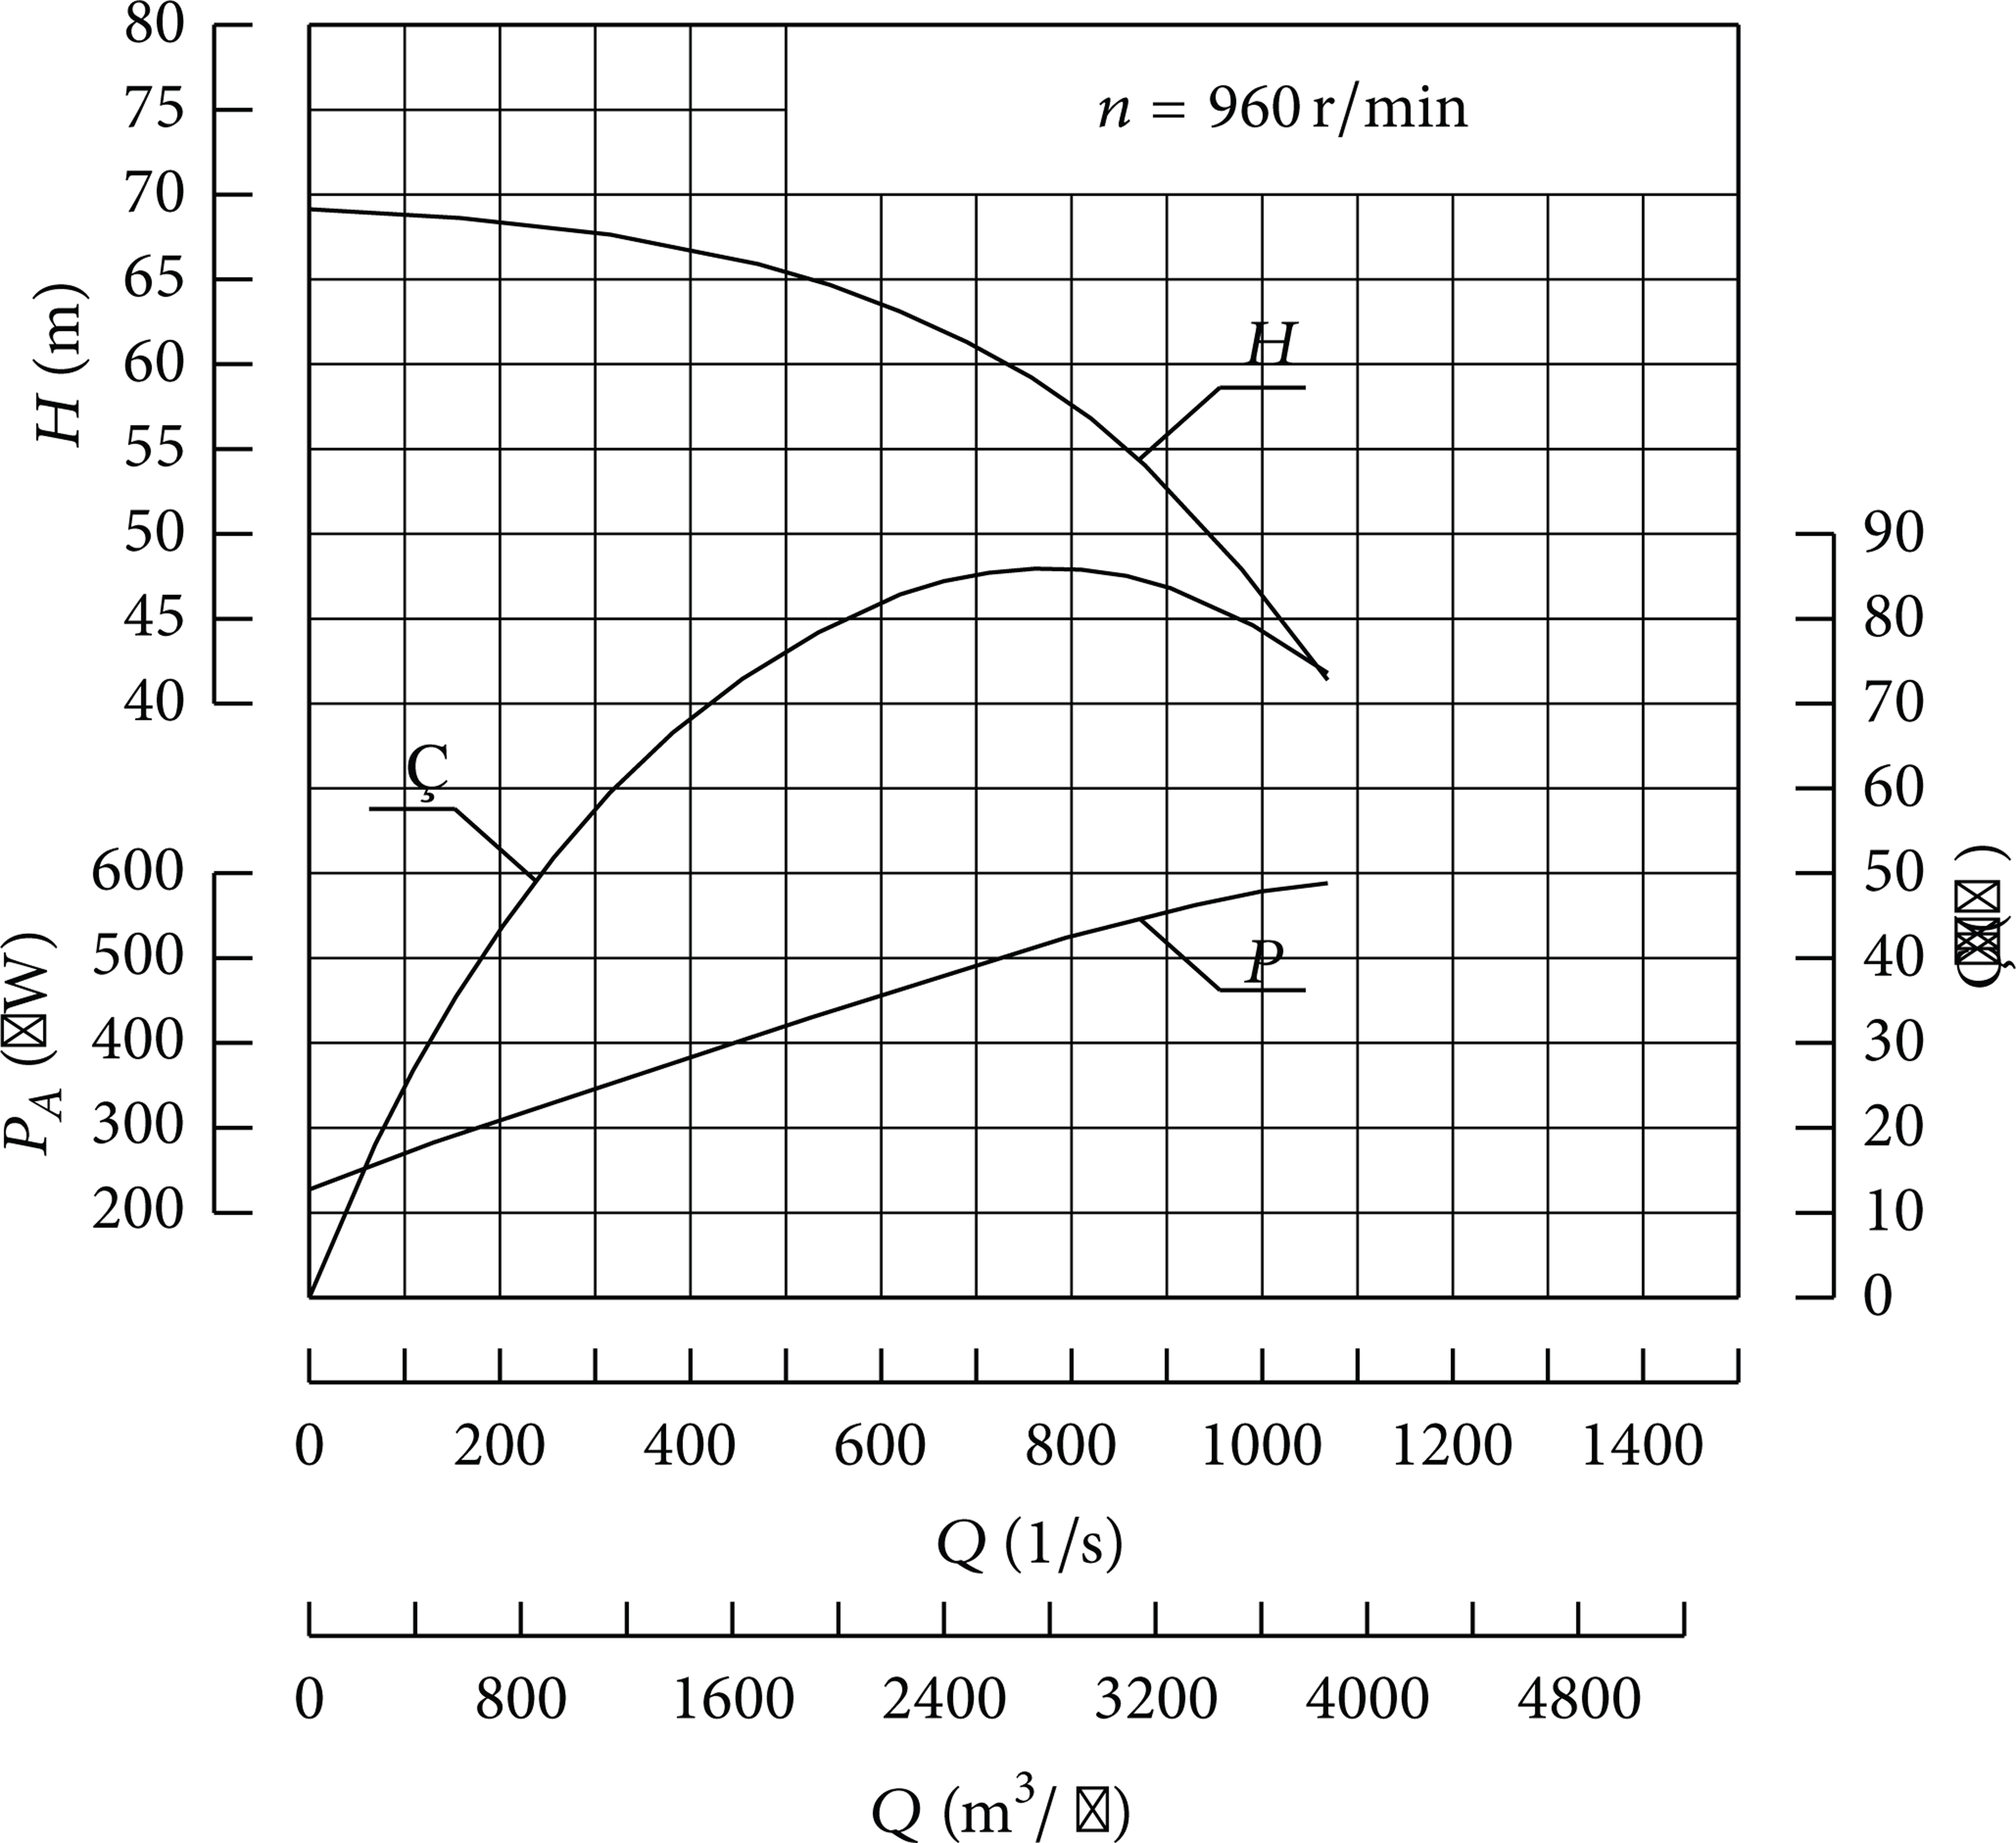
Product samples performance curve of the cold pump.
3. Energy Consumption Evaluation Index of the Pumping System
3.1. Basic Operation Principle of the Pumping System
As shown in Figure 3, the fluid is drawn from a tank, is pumped through a piping system (comprising a flow control valve), and ends up in an elevated tank. A recirculation line with another control valve is also included in the pump system. The pump is operated by an electric motor that is fed by a motor control center, which is fed, in turn, by a station transformer.

Pumping system.
The operation point of a pump is represented by the intersection of the system and the pump characteristics. The system characteristic H A = f(Q) refers to the difference in the total pressure, which must be supplied by the pump to maintain a specific flow rate throughout the system.
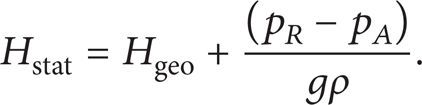
The head H A that is required by a plant comprises a static component Hstat and a flow-dependent component Hdyn [12, 13]. Therefore, H A is computed using the following equation:

Hstat comprises the geodetic head differences Hgeo and the system pressure differences, which can be expressed as follows:
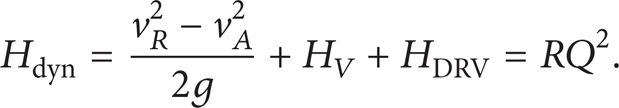
Hdyn, as expressed in (3), comprises all head losses H V in the suction pipe, the discharge pipeline (including its components, such as heat exchangers), the adjustable head drop in the throttle valve HDRV, and the increase in kinetic energy. Figure 4 shows the three parts that comprise the energy consumption in H A :
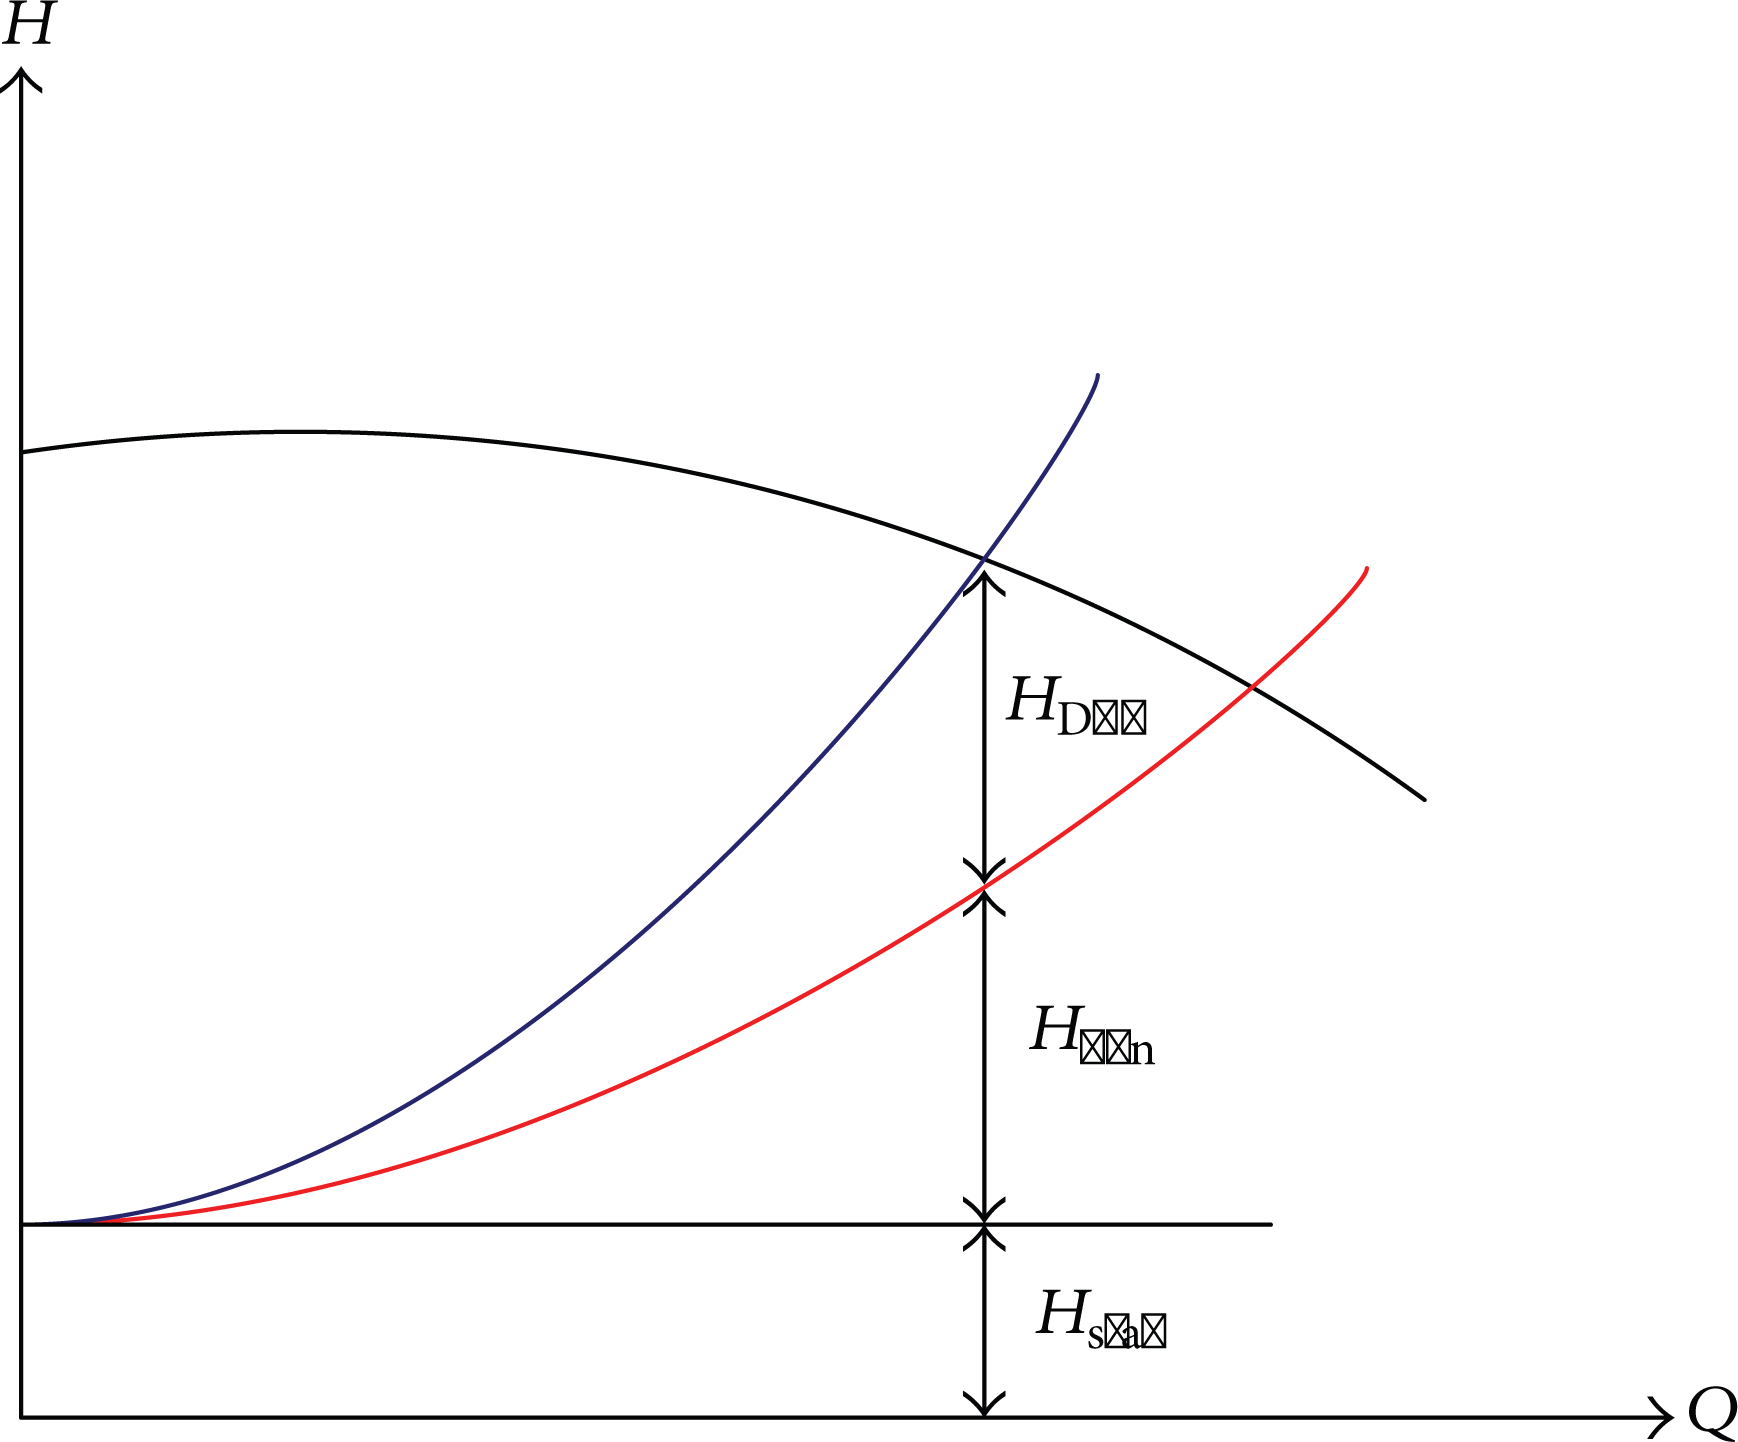
System characteristics of the energy consumption in the pump head.
3.2. Energy Composition of the Pumping System
Energy efficiency refers to the use of energy for producing the same amount of services or other useful output (Patterson, 1996) [14]. The required head and flow rates are used to calculate the system efficiency and energy consumption.
As shown in Figure 4, the consumption of the head comprises three parts. The required differential head partly depends on the counter pressure and the differences in height, the definition of which is almost identical to that of Hstat, but can also be affected by the friction loss in the piping system, which can be represented by Hdyn. The required flow rate should reduce the recirculation flow and leakage. The other parts of H A are used as the overcome power of the system, in which HDRV is used to determine the cost of operation change caused by the throttle control (which is not a necessary part of the throttle control and can thus be exterminated), and Hdyn is used to overcome the resistance of the pipeline (which can be reduced by optimizing the design of the pipeline system). Given that Hdyn cannot be eradicated, the effective output power P o , the necessary output P N , and the actual output P A can be expressed as follows [15]:


As the actual output of the pump, P A requires more energy to form. When the electric energy enters the pumping system, energy losses are observed in the electric power distribution unit, variable speed drive, drive mechanism, motor, and pump. In this case, P A can be reexpressed as

where P I refers to the input electric energy, η e refers to the electric power distribution unit efficiency, η v refers to the variable speed drive efficiency, ηdm refers to the drive mechanism efficiency, η m refers to the motor efficiency, ηpu refers to the pump efficiency, and ηpuη m ηdynη v η e refers to pump unit efficiency.
3.3. Operation Energy Consumption of the Pumping System
The basic characteristics of the pump often refer to the discharge of the pump at a certain speed with other capability parameters, such as head-flow rate curve, shaft power-flow rate curve, and efficiency-flow rate curve. These curves show the relationship between characteristic parameters and flows. However, the operation condition changes over time in actual operation, which complicates the calculation of the changes in characteristic parameters and operation efficiency within a particular period.
Therefore, time must also be considered in evaluating the actual operation conditions. The operation energy consumption can be computed as follows:

Therefore, the operation hydraulic energy consumption can be computed according to

where W H is the operation energy consumption; Win is the operation hydraulic energy consumption; t is the time; and Q(t) and H(t) are the functions of time, which can be changed based on the meaning expressed in (4) to (7).
The shaft power, flow rate, head, and other operation parameters within a period can be acquired from the experimental results or recorded data, the relationship between the parameters and the time can be established by fitting, and the real output of hydraulic energy consumption can be calculated using (6), (7), and (9). The recorded duration must exceed one operating cycle.
The data for some systems may be chaotic. This condition hinders the fitting of data, thus making such data unsuitable for the online test and renders the recorded data inadequate for fitting. Therefore, the equation must be changed as follows:

where Q i , H i , and t i are the flow rate, head, and duration time, respectively, in the i operation condition.
3.4. Energy Consumption Evaluation Index of the Pumping System
The following factors must be considered when computing for the evaluation indexes of the energy consumption of the pumping system [16, 17].
The efficiency of the pumping station operation is computed as follows:
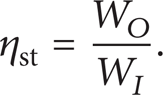
This parameter views the energy consumption from a global scale, which may benefit the energy evaluation of different pumping systems but may also complicate the calculation of the energy saving potential of these systems.
Therefore, the aforementioned equation must be revised. According to (4) to (7), ηst can be decomposed into several parts, and the energy saving potential of each part can be calculated as follows:

where ηpi is the pipeline efficiency and η d is the demand efficiency.
Although the operation efficiency is directly related to the economic efficiency of the pumping system, it cannot be used as the characterization index of the pumping system as it does not directly consider the manufacturing economic capability (i.e., how much water can electricity transmit per kW·h). Therefore, another index is generated.
The required energy per thousand tons of pumped fluid or per million gallons of energy intensity can be computed as follows:

where E is the energy consumption of the pumping system in a period of time (expressed in in kW·h) and G is the capacity of water delivery in a period of time (expressed in m3).
These evaluation indexes directly reflect the relationship between the water supply and energy consumption and are especially suited to evaluate the energy conservation.
However, e1 only considers the energy consumption with flow quantity rather than with the pressure supplied by the pumping system, which complicates the criteria and unbalances the comparison of the energy consumption between two pumping systems with different lift heads.
In most cases, energy consumption can be expressed in terms of operation efficiency, as described in (12), which can be used to formulate the general criteria. Therefore, the economical index of the pumping system operation can be expressed in terms of energy intensity.
4. Energy Consumption Test of The Pumping System
To understand the energy consumption of the pumping system better, the measurements that test energy consumption are categorized into two groups: the operation characteristics of the pump (to assess the energy saving opportunity of the pump unit) and the demand characteristics of the pump (to reduce the unnecessary supply).
4.1. Measuring the Operation Characteristics of the Pump
4.1.1. Measurement Method
The operation characteristics of the pump are investigated to determine the head, shaft power, and efficiency of the real flow rate. The characteristic curve of the pump is often indicated in the standard test device and is supplied by the manufacturer. The condition of the actual operation significantly differs from that of the standard test because of construction and wear loss. An online test must be conducted because of its importance in energy assessment.
The measurements used in the field test are divided into two groups: electrical and mechanical parameters. The electrical parameters comprise the measurements that have been taken from the electric motors that drive the pumps, whereas the mechanical measurements comprise the measurements of the pump flow rates and pressures.
The online test is conducted differently in each condition of the pumping system.
A standard test method [18, 19] is used for pumping stations that can change their operation points.
If the process condition does not allow the changing of operation points or does not provide physical quantities for certain reasons but provides relatively complete historical data, such data can be sorted and analyzed to obtain the necessary information, such as the pump characteristics and operation conditions. This method was employed by Ahonen [20] in 2010.
4.1.2. Online Test
Figure 5 shows the basic test condition of the pump characteristics, and Table 2 shows the test system and the involved instruments.
Test system instruments.

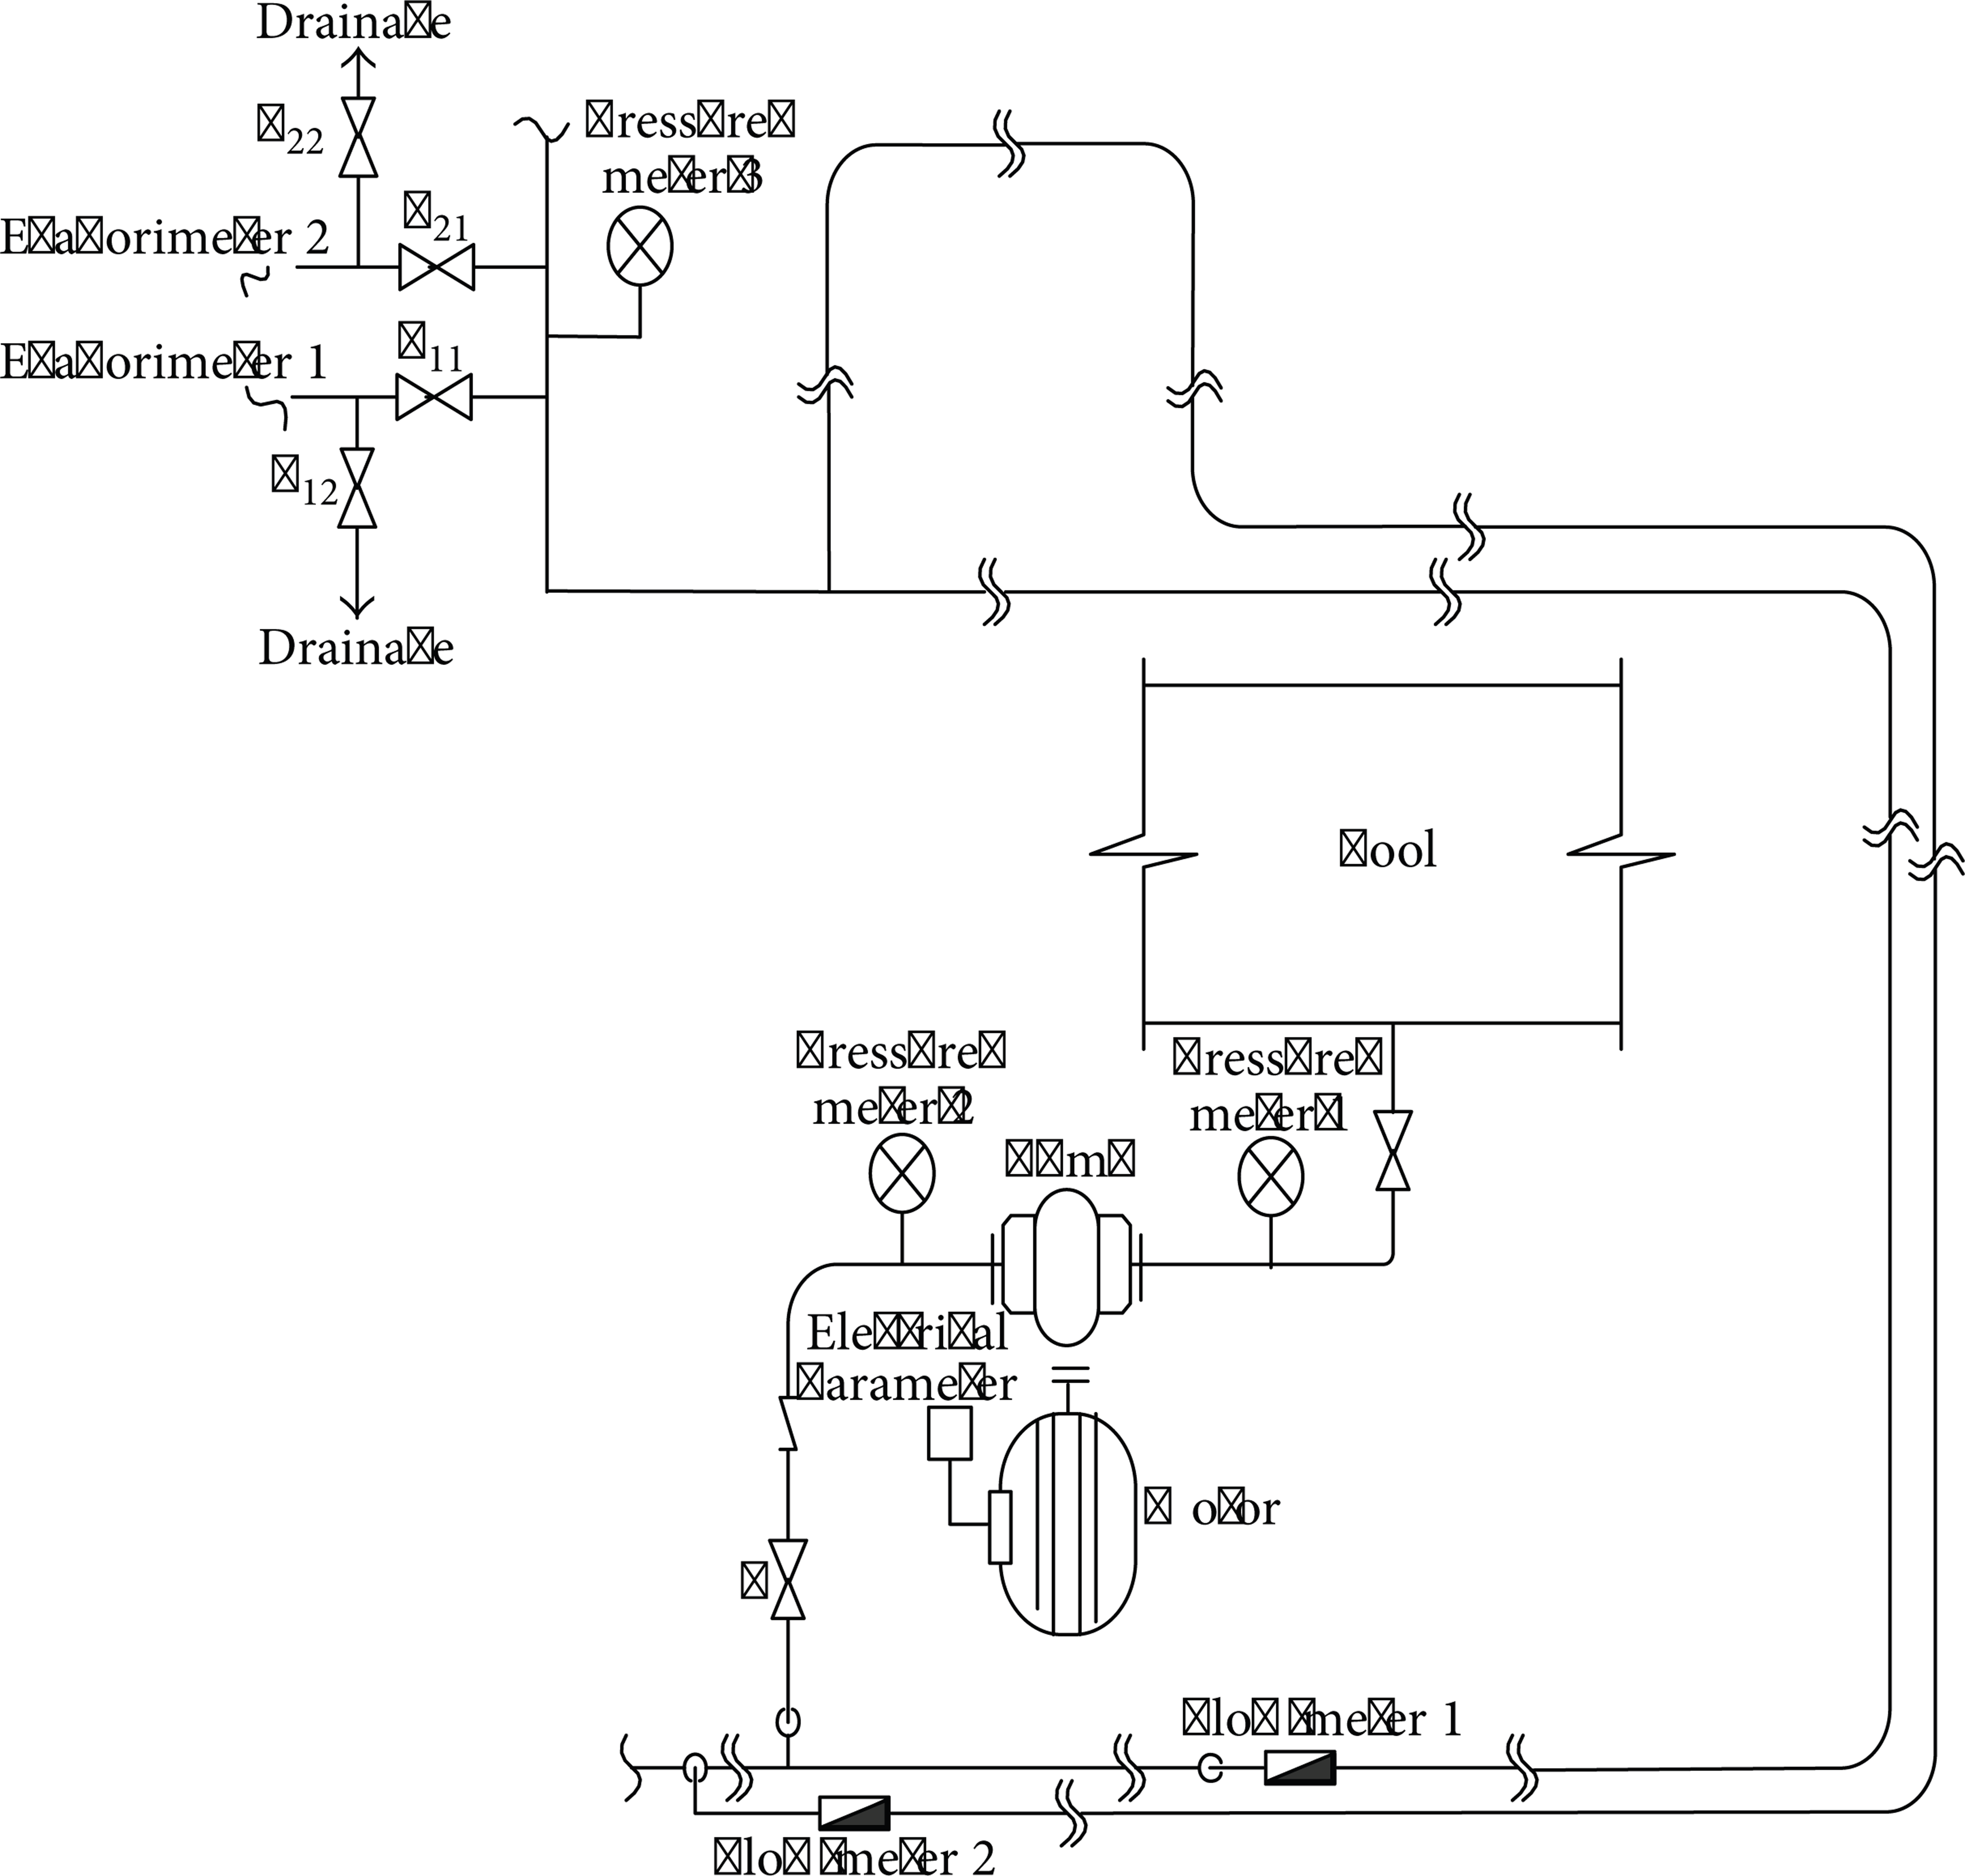
Test system schemes.
To evaluate the processes that are unaffected by the online test (i.e., the mother liquor evaporation process), the test time is set when the evaporator 2 is not working. Valve F22 is opened, valve F21 is closed, and the water in evaporator 2 is drained through valve F22.
Valve F21 is used to adjust the flow. During the test, the flow starts with the highest possible rate and then decreases to a rate that must not be lower than the minimum flow (1000 m3/h). More than 10 operation points are identified during the test through a uniform selection. Each test point has a stable operation time longer than 1 min. The inlet pressure, flow rate, outlet pressure, speed, voltage, current, and power input data must be read at least thrice at 1 min intervals. Figure 6 shows the test results.

Online test results of the pump characteristics.
4.2. Measuring the Demand Characteristics
To determine the requirements of the end user, the function of the pumping system must be investigated. The conditions are used as criteria to identify the different working conditions of the pumping system. The pumping system can be divided into two types: power and flow rate use types.
The power use type is primarily employed for the output power of the fluid, such as that of the hydraulic transmission system, which uses static power as its output to fulfill its functions. Other power use types include hydraulic liters extraction, hydraulic flushing, fire extinguishing, and ship propulsion, all of which mainly use the water power output of kinetic energy [21].
Flow rate use type observes a certain flow rate to transport liquids between different grounds or to accomplish engineering activities that rely on flow rates, such as the cooling and heat circulation cycles.
In the engineering field, power use type often considers both flow and pressure as power-related factors. Therefore, the flow and pressure supply are restricted by the progress of the operation. Energy loss occurs when the flow and pressure supply are low, which indicates that the flow rate use type focuses on efficiency when conserving energy.
The flow use type, which may be regarded as the major operation method of the pumping system, aims at the transportation of the liquid (including circulation transportation). The flow may be regarded as the most important factor in the pumping system operation as its supply often exceeds the prescribed value in practical engineering for reliability and simplification purposes. The flow use type must be emphasized, and the practical engineering requirements of the technological process must be identified with the help of the end user.
The pump efficiency evaluation method is often used to examine the energy consumption of the pumping system by calculating the pump efficiency under different conditions. However, the energy consumption of a pumping system is not only determined by pump efficiency, but also by user demand. Although the water supply of the pump provides a certain amount of energy that exceeds the prescribed minimum, the actual consumption value of the pump remains high. Therefore, user demand must be tested and analyzed using the same methods for assessing energy. If the pumping system is treated as an isolated system as shown in (4), the effective energy supply of the pumping system is expressed as Qrep, whereas other fluids exhibit elevated Hstat in the unit interval. The wasted energy that failed to meet user demand is regarded as a surplus flow. As stated in the pump operation principle, the energy supplied by the pump must compensate for the losses in the piping system. Such losses can be avoided by focusing on the economic index of the system, the loss of unnecessary head can be avoided by using less throttle controls, and the loss of unnecessary flow can be avoided by using bypass control. When assessing the energy conservation of the pumping system, the system characteristic curve without the throttle and bypass controls must first be adopted. Therefore, a system characteristic must be achieved in the energy test without using throttle and bypass controls.
The pumping system is usually often regarded as a part of the technological process, as its supplied energy is often related to the production process. Therefore, the necessary energy that is supplied by the pumping system must be differentiated from the unnecessary energy during the energy test.
4.2.1. Analysis of the Process Requirements
The pumping system used in this study is part of the production process in which the realization of the water cycle is very important. Therefore, the water cycle process (Figure 7) must be analyzed to calculate user demand.

Water cycle of the pumping system.
In the water cycle, the mother liquor evaporation process is the main user, and the requirement of the evaporator is the key determinant of the demand.
The vertical distance Hgeo between the evaporator and the cooling water pool is 22 m, and the evaporation requires an operation pressure of 0.2 MPa.
This pumping system is used as a flow use type, and its flow demand is determined by the water cycle progress to ensure the stability of the system. The daily energy consumption of the pumping system is used to calculate the demand characteristic and energy consumption.
Figure 8 shows the whole flow demand based on the historical data of the pumping station.

Daily variation curve of the whole flow demand.
A single pump operation is observed when the flow rate is below 4200 m3/h, and three pump operations are observed when the flow rate exceeds 6500 m3/h. Figures 9 and 10 show the flow rate achieved by a single pump.

Daily variation curve of the flow demand of the first pump.

Daily variation curve of the flow demand of the second pump.
4.2.2. System Characteristics Test
(1) Test Methods. System characteristics are determined according to (1) to (3). System characteristics are measured using two groups of measurements: the static component, which includes the differences in geodetic head Hgeo and system pressure, and the dynamic head, which mainly comprises the losses in the system [22, 23].
The operation parameters of the pump group at several flow points must be measured when the group can be adjusted without using throttles and bypass controls, when it is controlled instead by a speed control equipment, and when the head is observed between the imported and exported liquid surfaces. The system characteristic can also be determined using this method.
When the pump is controlled by throttles and when the valve is fully opened, the flow and head of the pump operating point can be determined (point A in Figure 11). When the head between the imported and exported liquid surfaces (point B in Figure 11) can be measured, the system characteristic can be roughly determined and fixed based on the historical data.
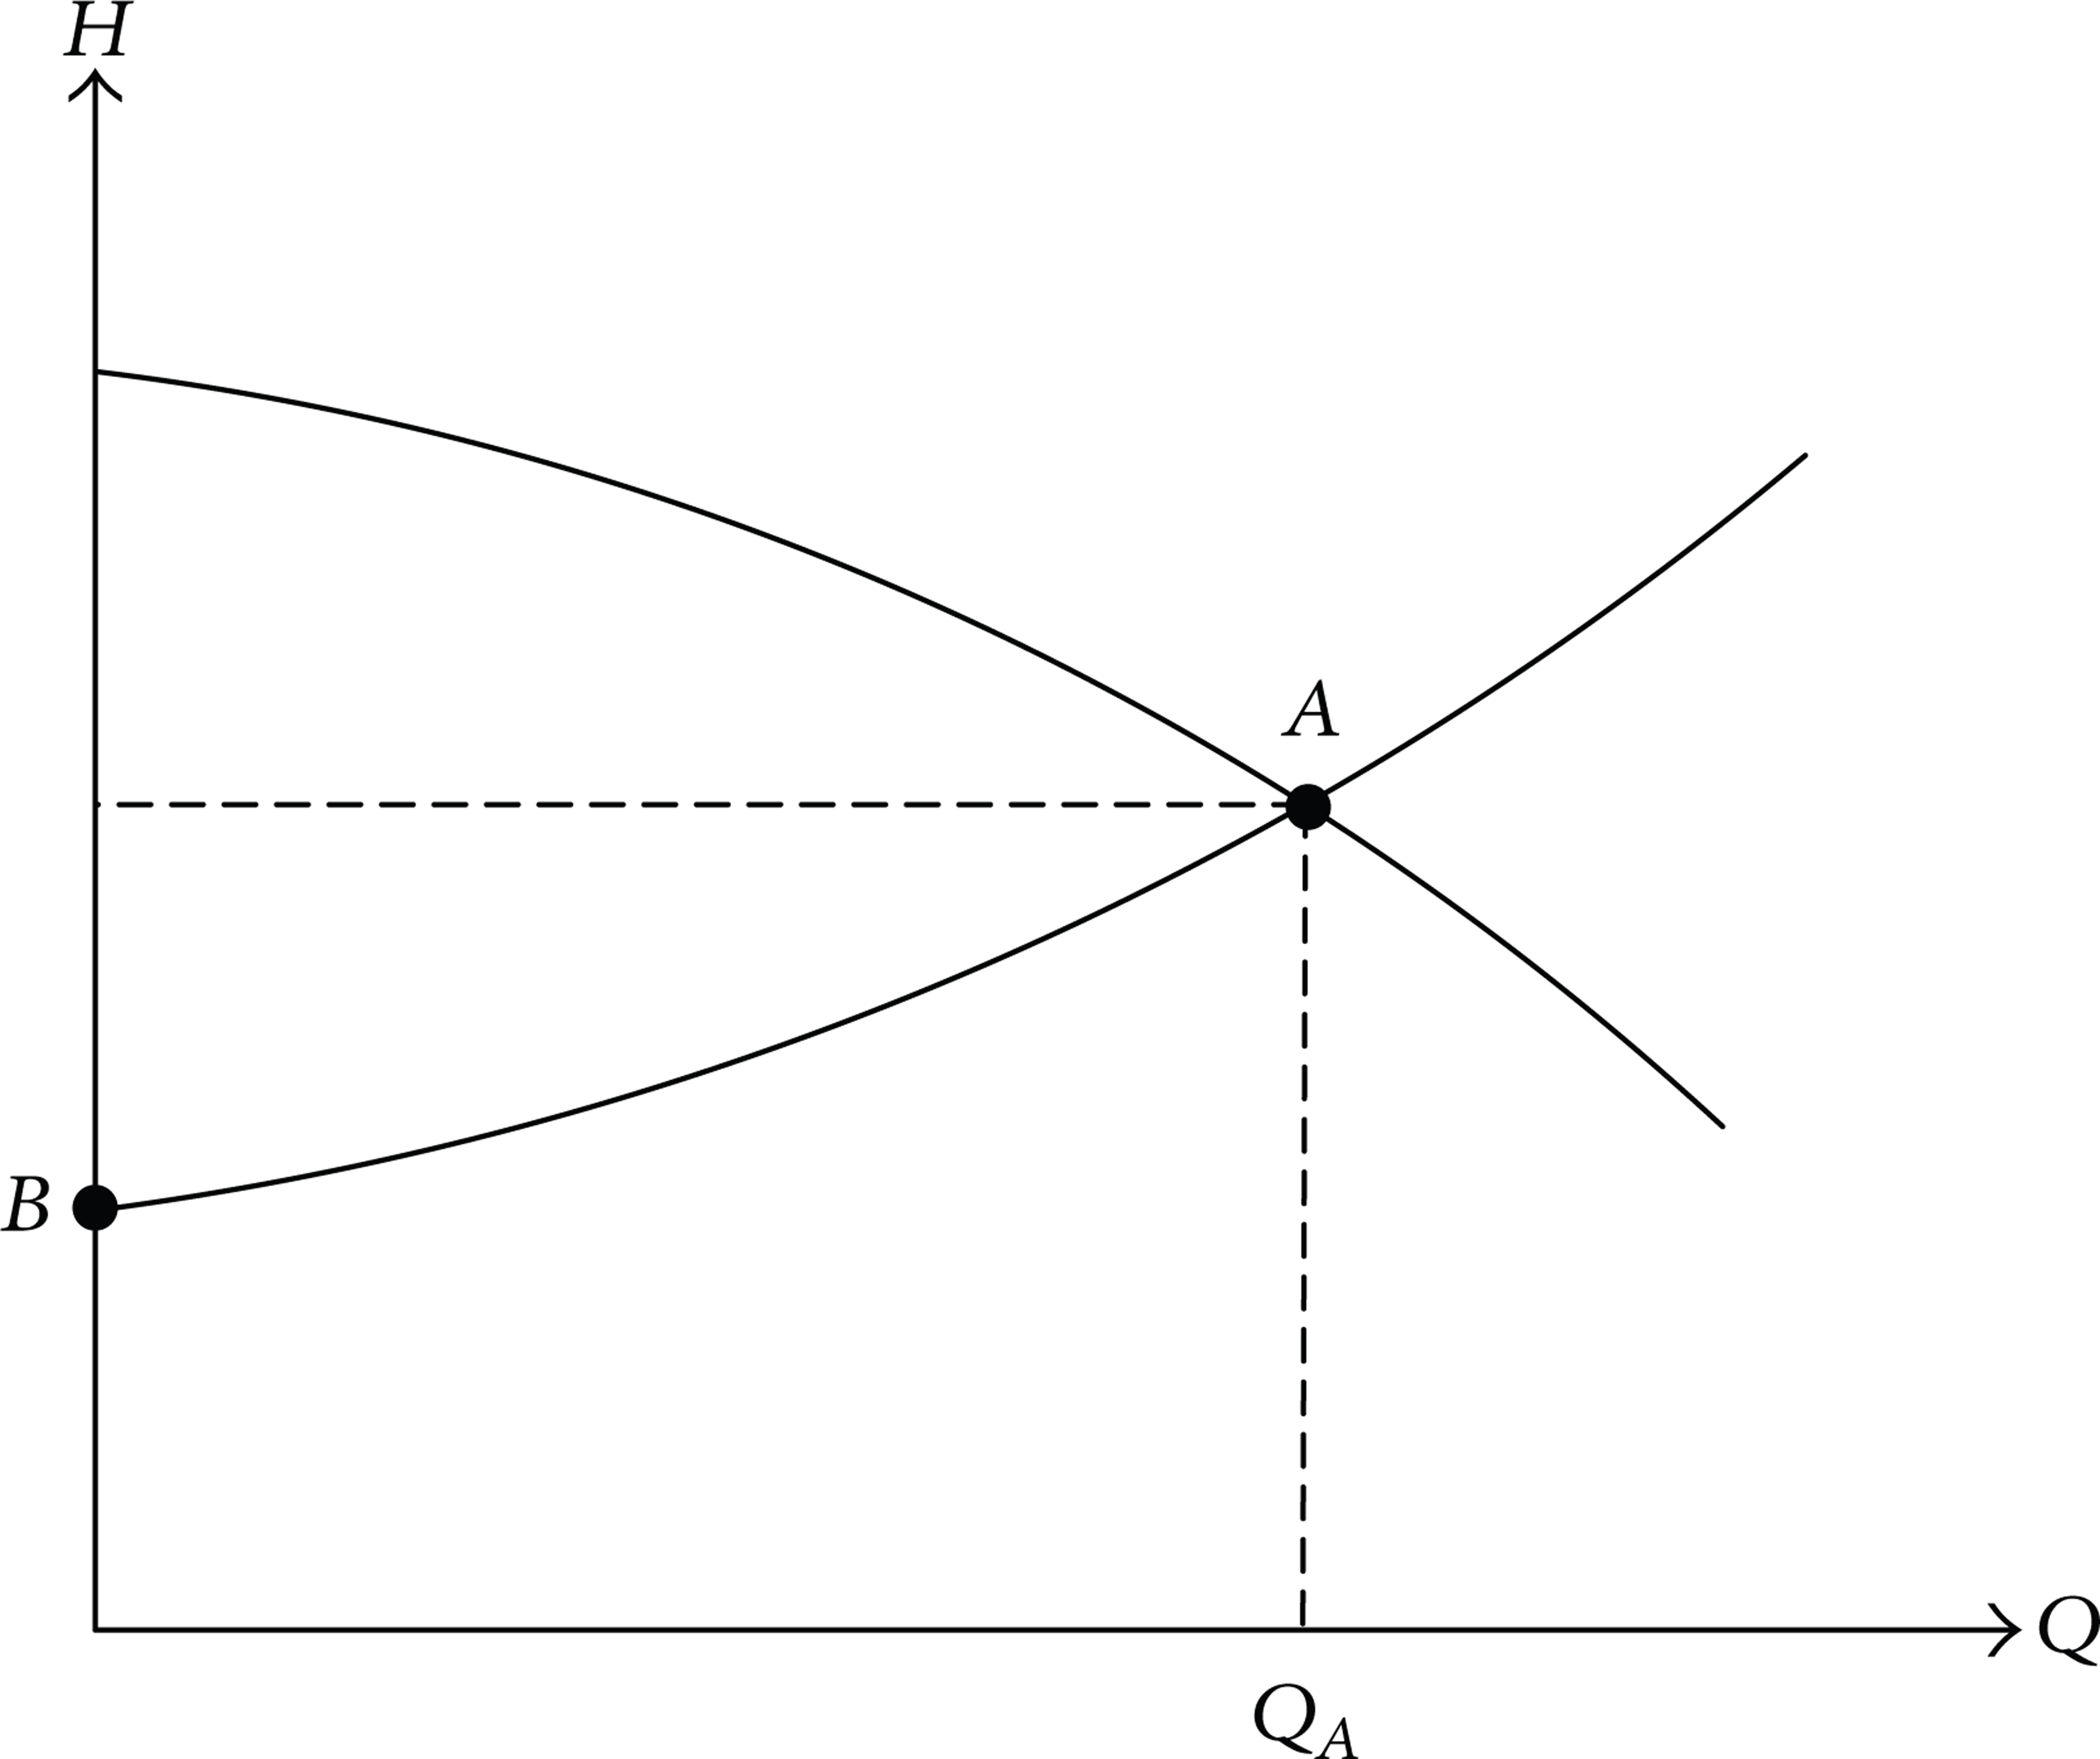
Measuring point of system characteristics.
(2) Testing of the System Characteristic. Given that the flow energy in the system is consumed from the pump group outlet to the evaporator, the system characteristic has to be tested to calculate the energy consumption.
As shown in Figure 5, the front-end valve F21 of the evaporator controls the operation when testing the system characteristic.
The pressure of the evaporator (H0), the pressure of the pump group outlet (H), and the flow rate (Q) are recorded in each test point. The loss coefficient of the system (S) can be calculated as follows:

Table 3 shows the test data.
Factors of the system and their corresponding levels.

Therefore, the system characteristic can be computed as follows:
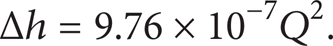
The basic demand of the system can be computed as follows:
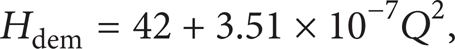
where Hdem is the basic head of the system demand and Q is the demand flow rate.
Given that the system can operate well without omitting any factors, the ideal loss coefficient can be calculated according to the pipeline handbook [24], which returns a loss coefficient of 2.18 × 10⁻⁷.
5. Analysis of the Pumping System Energy Consumption
5.1. Performance Analysis of the Pump and Motor
Figure 6 clearly identifies the characteristics of the pump and motor. The best efficiency point (BEP) reaches 3500 m3/h with a 54 m head, 86.3% efficiency, and a high efficiency area that varies between 2400 and 4200 m3/h when the efficiency exceeds 80%.
Table 4 shows the differences between the sample and actual characteristics.
Comparison of the actual and sample characteristics.
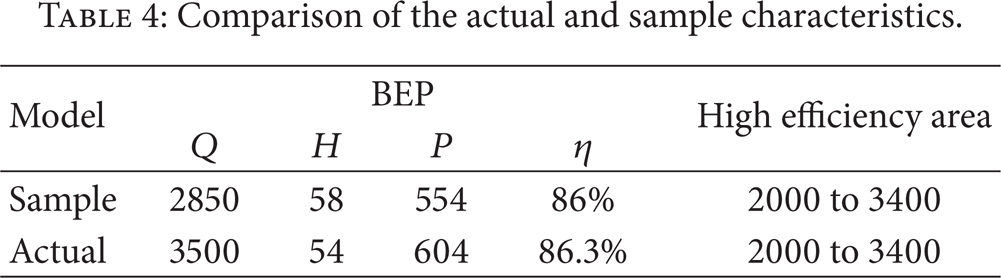
Although the actual BEP is higher than the sample BEP, the sample has a wider high efficiency area. Therefore, the pump and motor do not need to be changed based on the capability degradation.
However, the applicability of the exited pump unit still needs to be investigated.
The total energy consumption and the output energy of the pumping system can be calculated based on the online test data and on (8) and (9), which are computed as follows:

The operation efficiency of the pump unit can be calculated as W A /Win, which returns a value of 80.57%. Therefore, the pump unit is regarded as efficient based on the national standard, which indicates the need to replace the pump unit used in this study.
5.2. Operation Energy Consumption and Energy Saving Potential of the Pumping System
The operation is mainly controlled by throttles. The practical operation track is represented by the pump or parallel characteristics. Figure 12 shows the operation track required by the system.
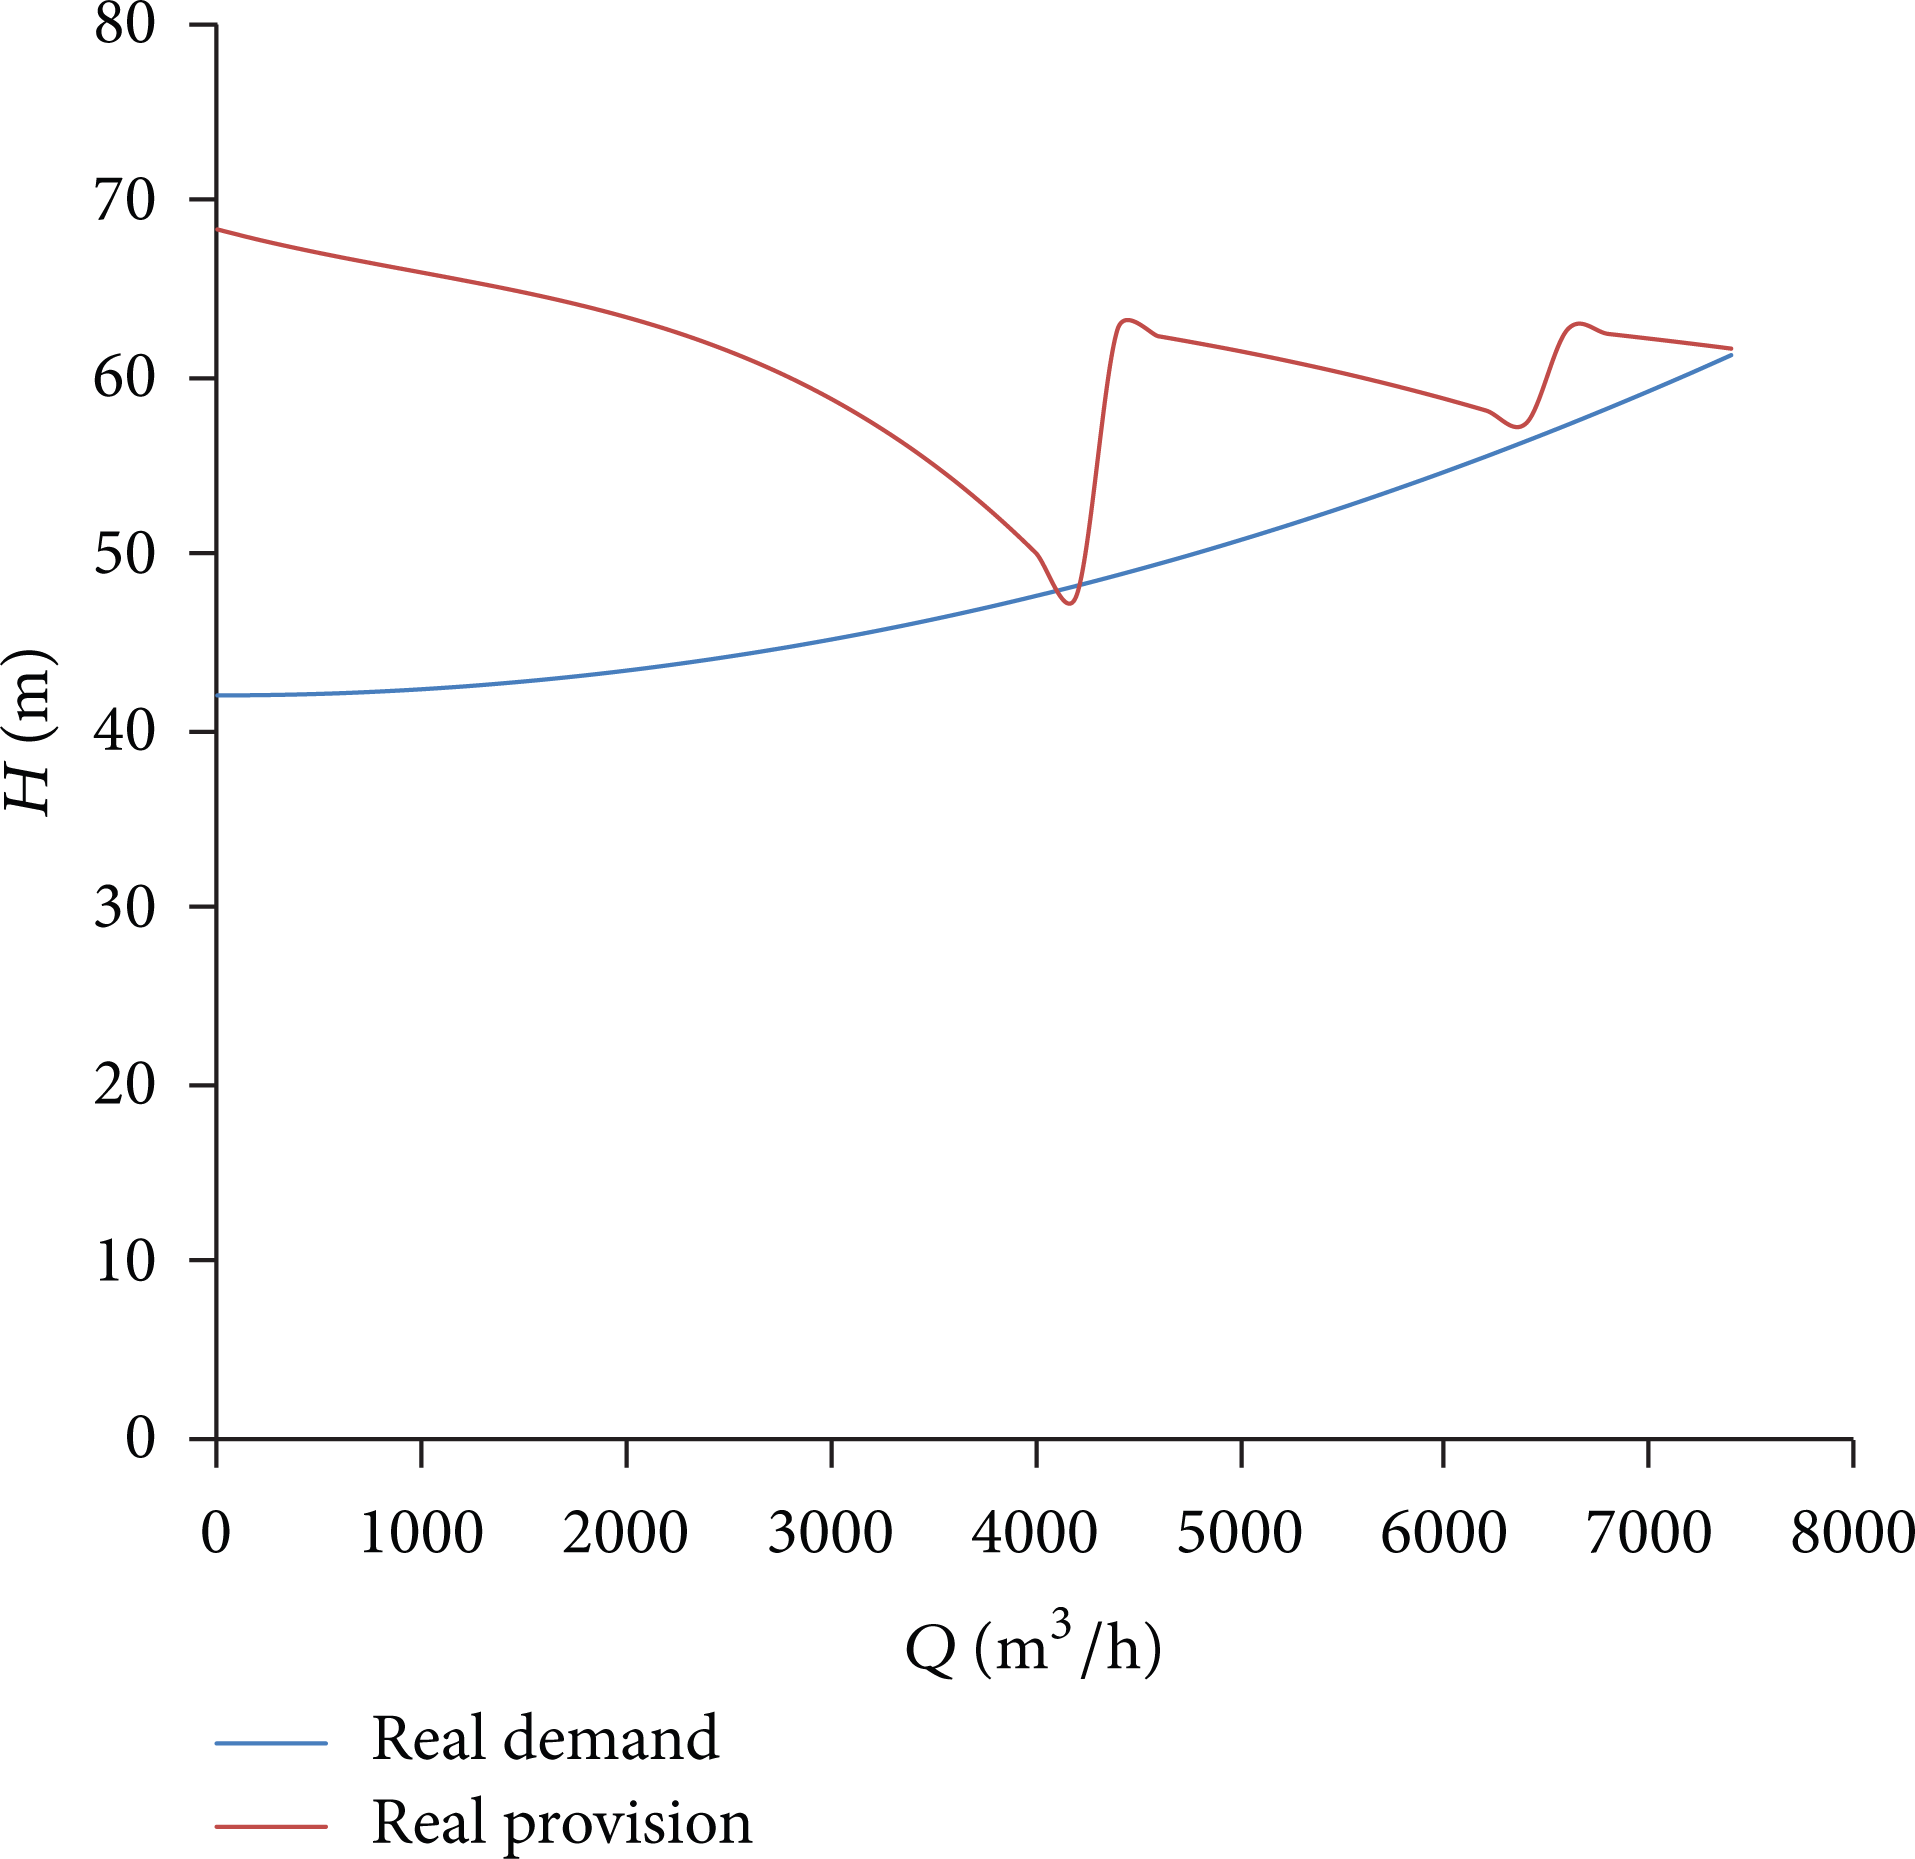
Operation control lines of the real demand and real provision.
Based on (9) and Figure 12, W0 is computed as 11288.56 kW·h, and W N is computed as 12661.958524 kW·h.
The operation efficiency of each part can is computed as follows:

The efficiency of the system design is computed as 12354.31 kW·h, the achievable optimization result is computed as ηpi = 91.37%, and the energy-saving potential is computed as 2%. Therefore, the system is unqualified to undergo further improvements.
The demand efficiency has a 16% energy saving potential if the operation adjusting method changes from valve control to speed control [23].
Despite the relatively high value of 80.57%, the energy-saving potential of the pump unit is limited.
6. Energy Saving Method of the Pumping System
6.1. Analysis
Based on the analysis of the energy consumption of the pumping system, the equipment variable speed can be used for energy conservation, and the frequency converter can be used to maintain the continuous change of the flow. The frequency converter can be operated through several methods [10, 11].
First, when adjusted by full invert with the same type of pumps, the operation efficiency and the price of the frequency converter are very high, and the wasted energy is very low. Second, the assembly of the pump group with the single frequency converter configuration condition may return a low pump efficiency. Third, the assembly of the pump group with two frequency converter configuration conditions may yield better results. Fourth, some scholars suggest the addition of a small transitional pump under the single frequency converter configuration to increase the operation efficiency.
Three strategies are adopted for the formulation of an energy saving method for the sample pumping system. The first strategy is adopted with the full invert and uses three inverts to adjust the rotation speed of pumps 1 to 3. The second strategy uses a single invert for pump 1. The third strategy uses two inverts for pumps 1 and 2. The last strategy fixes one invert into pump 1 and adds a small transitional pump with a design rate of 1425 m3/h, which is almost half of the original, and a design head of 58 m, which is almost the same as the original [25].
A model is constructed based on the abovementioned strategies. The minimum shaft power is used as the objective function, the starting factor and the speed regulation ratio are taken into consideration, and the total flow, equal head, high efficiency zones, and minimum speed regulation ratio are regarded as constraints. The model is simulated using a genetic algorithm program [26, 27], and the results are shown in Figure 13.

Flow versus total shaft power under different schemes.
The findings in Figure 13 can be used to calculate the energy intensity, which is shown in Figure 14.

Energy intensity under different schemes.
Based on Figure 14, the full invert can yield the best energy saving potential for the pumping system. The single invert model with a low pump efficiency can also save more energy as compared to that of the existing system. However, the energy saving reconstruction not only affects the simple practice of energy conservation, but also the overall economy. Therefore, an economic analysis must be conducted to formulate a more rational and feasible method.
6.2. Economic Analysis of the Energy Saving Method for the Pumping System
For the economic analysis, the implementation costs and the energy consumption within a certain period must be calculated according to the flow demand principle of the pumping system. This study uses a one-year operation condition. Figure 15 shows the annual water demand law based on the statistical investigation.

Annual water demand law.
Based on Figures 13 and 15, the annual power consumption can be computed according to (8) and (9), and the results are shown in Table 5.
Total energy consumption under different schemes.

Given that the common industry electrovalence amounts to 0.6 yuan and that the configuration of the invert with 10 kV and 710 kW amounts to 150 million yuan, the transition pump, high-voltage electromotor, and installation costs amount to a total of 25 million yuan. Table 6 shows the general expenses of these different schemes based on the cost-benefit ratio.
General expenses of different schemes.

By assuming that the machine is free from any compromise, the relationship between time and gain can be observed as shown in Figure 16.
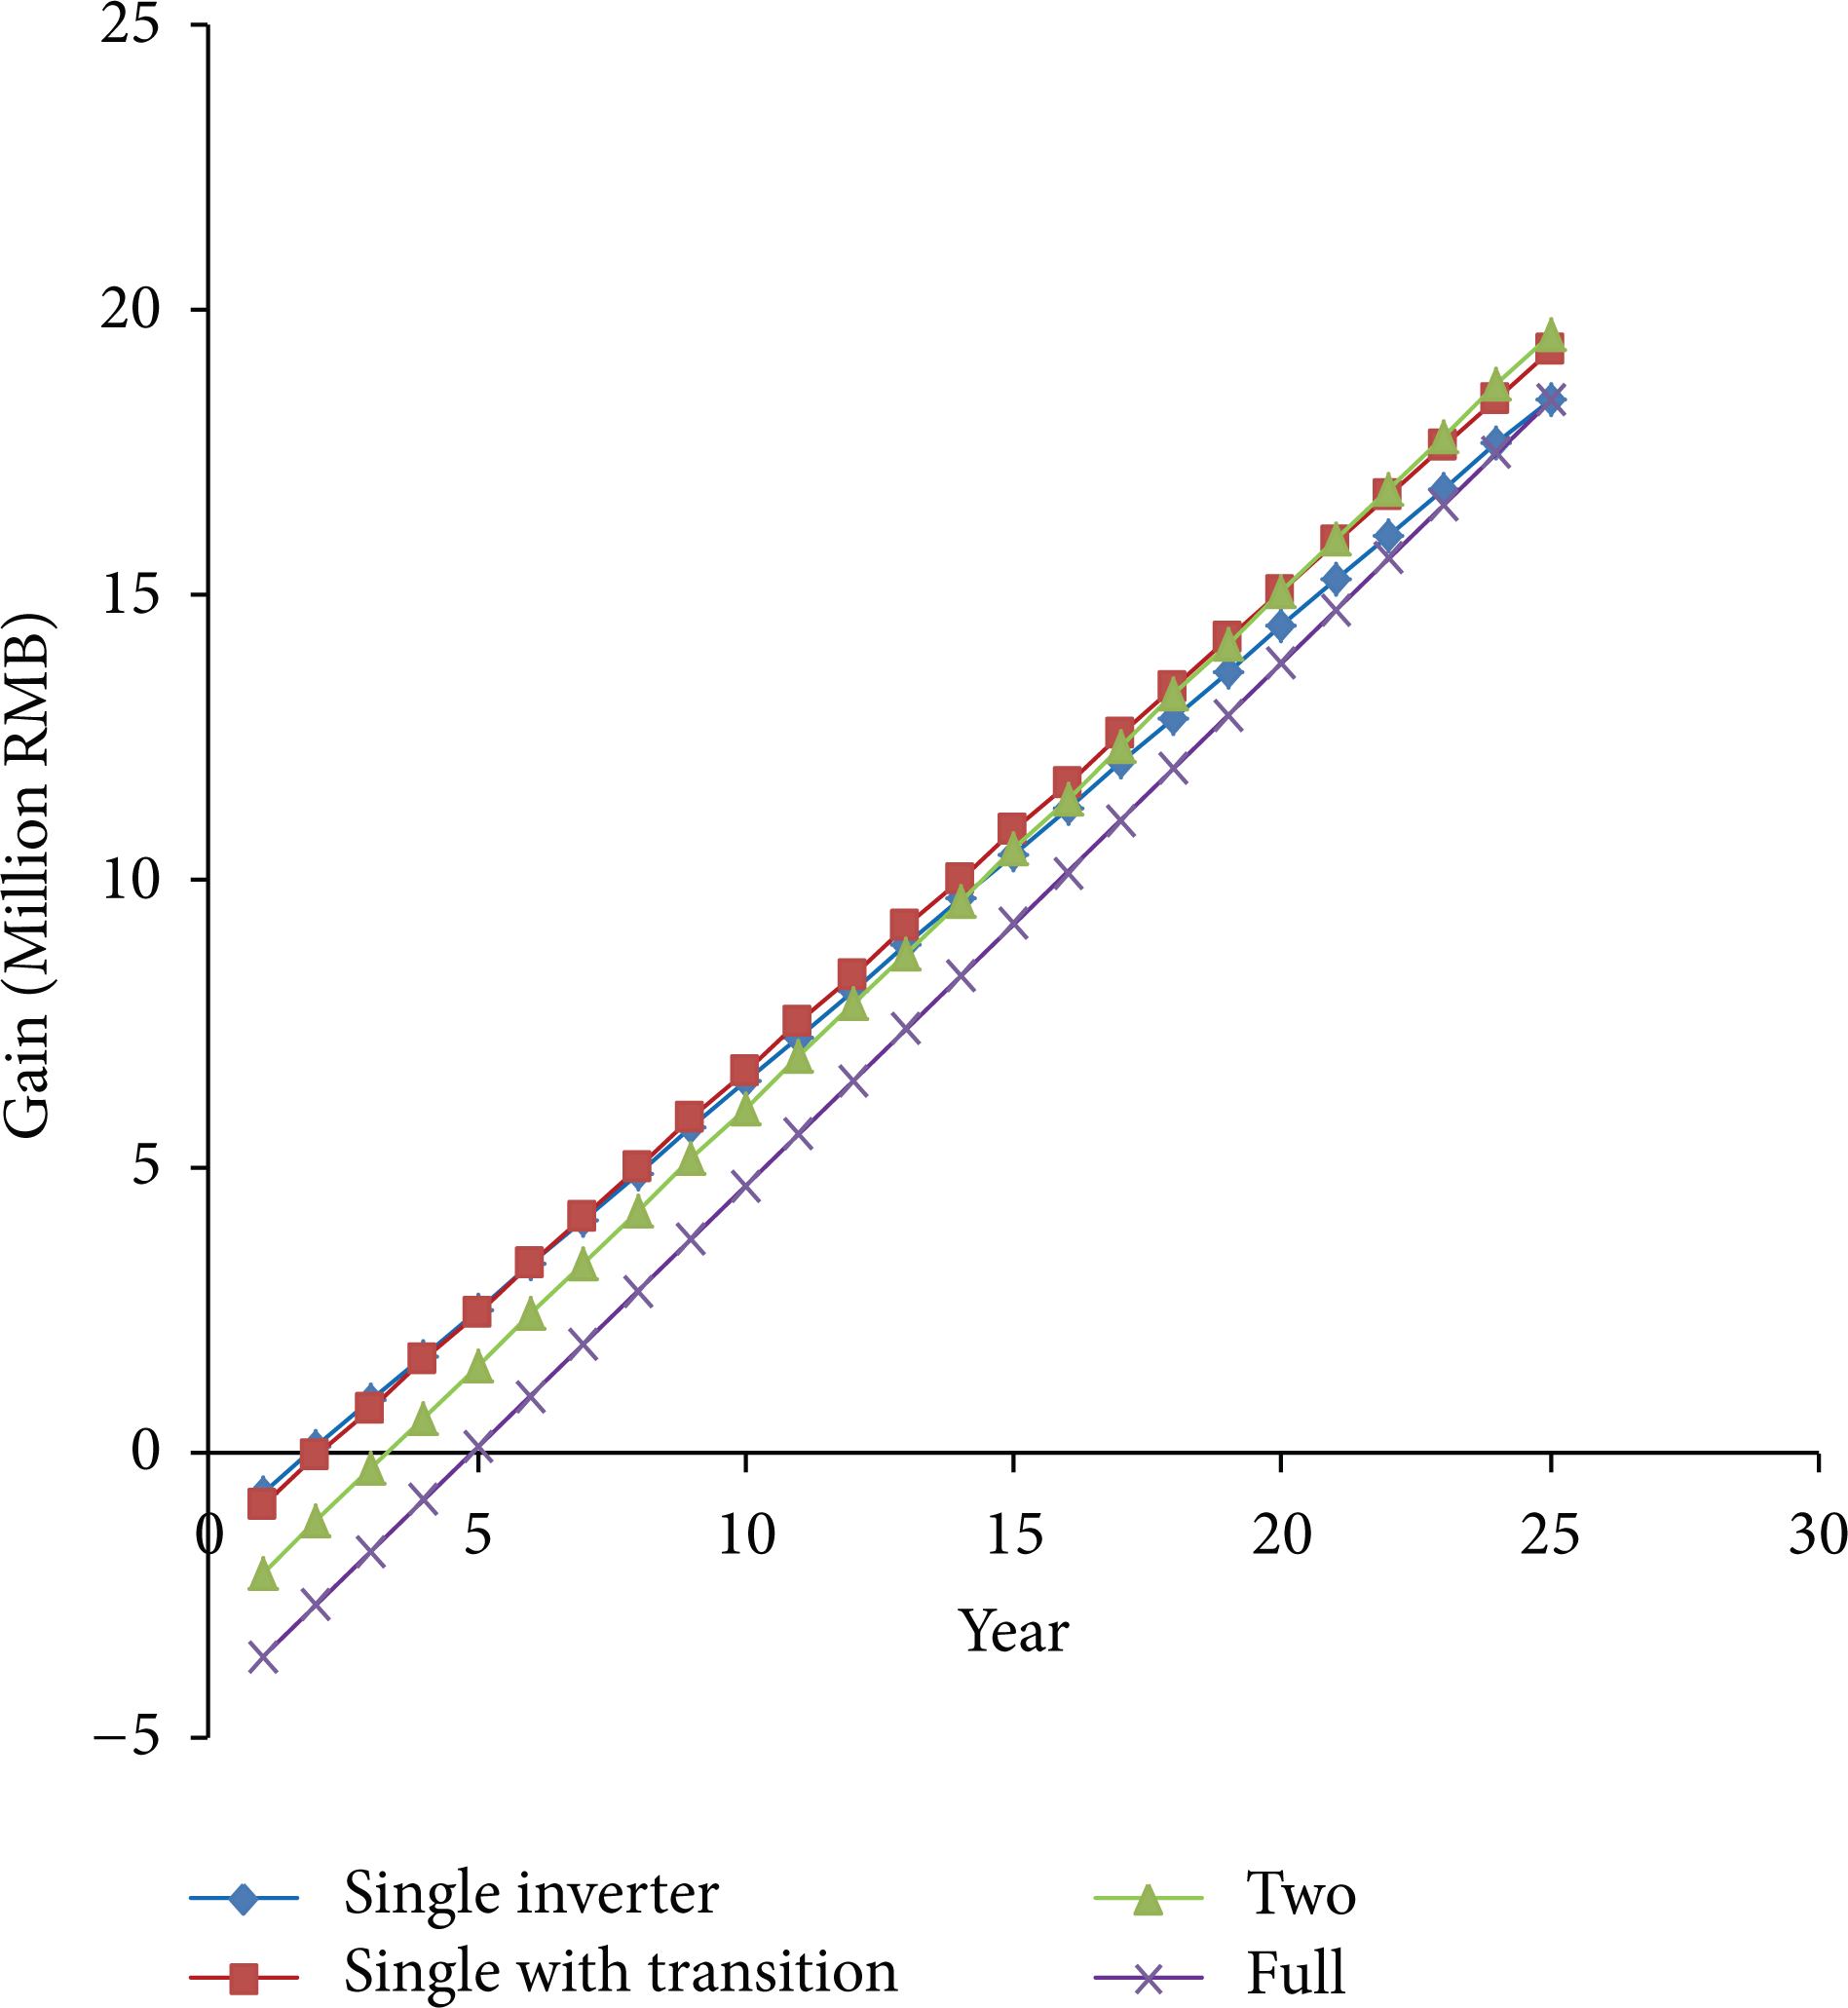
Relationship between time and gain.
The same figure shows that the single invert configuration scheme achieves the optimum profit with a working period of less than five years. However, the single invert with transition pump configuration achieves the best gain with an operation time that exceeds 20 years. Therefore, the single invert with transition pump configuration is highly recommended. Although the other two schemes have remarkable effects on the energy saving potential, these schemes require a longer time to achieve any gains.
7. Conclusions
This study constructs a methodology for the energy consumption evaluation and the energy saving technical reconstruction of a centrifugal pumping system. The energy consumption of a circulating water pumping station with a seemingly efficient operation is evaluated based on actual demand. A single frequency converter is converted with a small transitional pump to conserve approximately 14% of energy with a payback time of less than three years.
Based on the findings, the following conclusions are made.
The output hydraulic power of the pump can be divided into three parts based on the effect of the pump. These parts include the effective output power (to produce the static head), the necessary output (to overcome the system loss), and the actual output of the pump. The energy saving potential, particularly that of the surplus supply, can be easily calculated based on this process.
An integral method can be used to calculate the operational efficiency of the pump station based on the operation rules of the pump flow rate, given that the pump efficiency itself cannot reflect different operating conditions within a certain period.
The operation control track for meeting the minimum requirement can be obtained through an online test based on the system characteristic and process requirements. This track can be used to calculate the energy saving potential and the control setting of the invert.
A strategy for adding a small transitional pump is proposed to increase the operation efficiency of the pump assembly that operates under the single frequency converter configuration. The conditions and price of the frequency converter are very high, as reflected in the parallel operation model used in most pumping stations.
Software is currently being developed based on the methodology that is proposed in this study.
Footnotes
Acknowledgments
This project is supported by the Open Research Fund of Key Laboratory of Fluid and dynamic Machinery Laboratory, Xihua University (Grant no. szjj2013-006), National Science & Technology Pillar Program of China (Grant nos. 2011BAF14B02 and 2011BAF14B04)), National Natural Sciences Foundation of China (Grant no. 51349004), the Priority Academic Program Development of Jiangsu Higher Education Institutions and Jiangsu University fund assistance (Grant no. 13JDG082).