
Abstract
Oscillating water column (OWC) is the most widely used wave energy converting technology in the world. The impulse turbine is recently been employed as the radial turbine in OWC facilities to convert bidirectional mechanical air power into electricity power. 3D numerical model for the impulse turbine is established in this paper to investigate its operating performance of the designed impulse turbine for the pilot OWC system which is under the construction on Jeju Island, Republic of Korea. The proper mesh style, turbulence model, and numerical solutions are employed to study the velocity and air pressure distribution especially around the rotor blade. The operating coefficients obtained from the numerical simulation are compared with corresponding experimental data, which demonstrates that the 3D numerical model proposed here can be applied to the research of impulse turbines for OWC system. Effects of tip clearances on flow field distribution characteristics and operating performances are also studied.
1. Introduction
Oscillating water column (OWC) is the most widely used wave energy technology in the world. It is utilized to convert wave energy into low pressure pneumatic energy in the form of a bidirectional air flow. Capable of rotating in one-way under above flow conditions, Wells turbine or impulse turbines linked to the electric generator in the air duct is generally used to convert the dynamic air pressure into mechanical energy.
A number of efforts have been made to study the operating performance of air turbines for OWC wave energy converters. Maeda et al. [1] presented experimental research reports on the impulse turbine within fixed guide vanes for the OWC wave energy converter. Iffects of guide vanes on Wells turbines in the reciprocating air flows are experimentally investigated in [2], demonstrating better performance than turbines without guide vanes. The self-starting characteristics and operating performance of the Wells turbine in irregular waves are studied by experimental and numerical methods in [3]. Huang et al. [4] proposed a simple method for dealing with effects of pressure drops induced by the Wells turbine on the operating performance of air chambers. The fitting formula is used, which is derived from laboratory research on the flat plate as the Wells turbine's pressure drop substitute.
It was first investigated for the tip clearance of impulse turbine by 3D numerical model, which has been reported by Thakker and Dhanasekaran [5] that the turbine with 0.25 tip clearance performed almost similar to the case of without tip clearance for entire flow coefficients. An accurate description of the steady three-dimensional flow field in a high solidity Wells turbine was provided in [6]. The analysis has been performed by numerically solving incompressible NS equations in a noninertial reference frame rotating with the turbine. A design method combining two powerful design tools (Pugh concept analysis and 3D CAD environment) is used in [7] in order to create an improved impulse turbine using a systematic method. An investigation on the performance of a Wells turbine for wave energy conversion using the CFD method was reported by Taha et al. [8]. The study utilized several numerical models and NACA0020 blade profiles with various uniform tip clearances under steady flow conditions, and it was validated with corresponding experimental data. The automatic optimization procedure for a monoplane Wells turbine using symmetric airfoil blades was carried out by coupling an optimization algorithm with an industrial CFD code in [9]. Pereiras et al. [10] proposed an improved radial impulse turbine with newly designed blades and vane profiles using CFD method. The initial results of experimental validation for twin unidirectional impulse turbine topology were presented in [11]. In the experiment, a concept scale model was built and tested using simulated bidirectional flow. The model consisted of two 165 mm impulse turbines each individually coupled to 375 W grid connected induction machines.
Recent research and reports have pointed out that impulse turbines could overcome shortcomings of Wells turbines, such as poor self-starting characteristics and narrow operating flow rate domains to keep high operating efficiencies. Furthermore, most previous studies focused on experimental investigation and were limited by laboratory conditions and expenses. The incident air velocity distribution details in the whole flow domain, which are important for investigation on effects of bi-directional air flows on the efficiency of impulse turbines, were rarely obtained by the experiments.
Although the impulse turbine rotates in a bi-directional air flow, it is still valuable to analyze its performance in a steady flow for design and optimization purposes. The impulse turbine is planned to be utilized in the 500 kW pilot OWC system on Jeju Island of Korea because of its advantages on self-starting and stable power output. The research team from Korea Maritime University has put efforts on the numerical analysis and improvement for the impulse turbine practical utilization [12–14]. The present paper focused on the numerical simulation of optimized impulse turbine performance, which has been validated by the corresponding experimental data. The multiple reference frame and mixing plane models are utilized for setting up of numerical rotating machines, and RNG k-∊ turbulence model is applied to deal with turbulent effects. 3D air velocity and pressure distributions along the flow path are simulated numerically and operating coefficients for various tip clearances are compared for the purpose to improve and optimize the design of impulse turbines.
2. Impulse Turbine for Wave Energy Conversion
The typical three-dimensional impulse turbine model including rotor blades and guide vanes [15] within the outline utilized in the OWC pilot plant is shown in Figure 1. For the rotor blade, the profile is elliptical in shape on the suction side and has a circular arc shape on the pressure side. There are two rows of symmetrically placed plate-type fixed guide vanes on both sides of the rotor. The camber line of the guide vanes consists of a straight line and a circular arc.

Impulse turbine with fixed guide vane.
The design profile and parameters of impulse turbines used in the present paper are derived from corresponding experiments in [1]. There are 30 rotor blades and 26 fixed guide vanes. The rotor blade pitch S r is 26.7 mm, the width of flow path t a is 10.6 mm, the spacing G between the blade and the guide vane represents 20 mm, and the guide vane pitch S g is 30.8 mm. The rotor blade inlet angle is 60°, the radius of the circular arc is 30.2 mm, and the lengths of the major and minor axes of the elliptic arc on the suction side are 125.8 mm and 41.4 mm, respectively. The hub diameter is 210 mm, and the tip diameter is 298 mm.
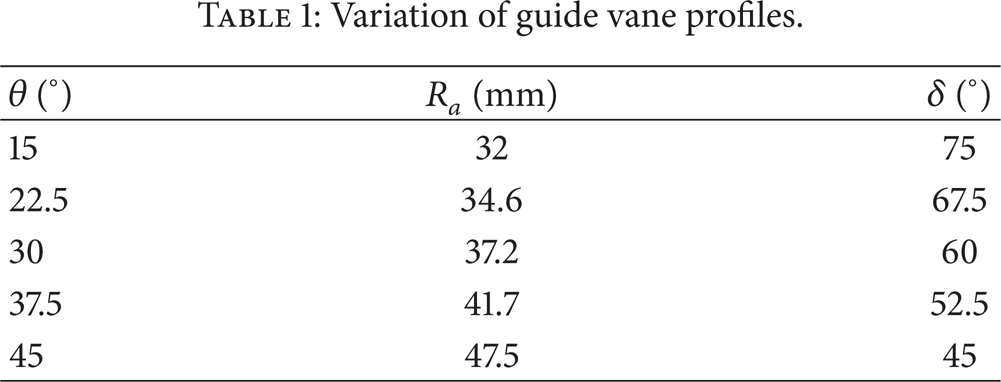
The chord length of guide vanes is fixed at 70 mm, and the length of camber's straight line is 34.8 mm. The radius of the circular arc of guide vane R a and the camber angle of guide vane δ vary with setting angles of the guide vane θ.
Typical characteristics of the performance of an impulse turbine in steady unidirectional flow are presented in terms of input coefficient C A , torque coefficient C T , turbine efficiency η, and flow coefficient ϕ. The definitions are given as follows [16]:
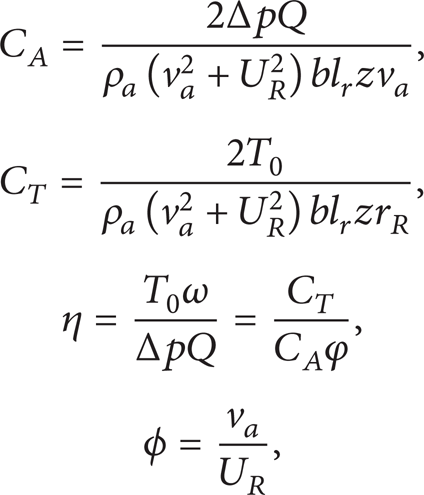
where Δp, Q, ρ a , T0 represent total pressure drop between setting camber and atmosphere, air flow rate, air density, and turbine output torque; v a , r R , ω, U R , b, and z represent mean axial flow velocity, mean radius, angular velocity of the turbine, circumferential velocity at r R , blade height, and number of rotor blades, respectively.
3. Numerical Model
3.1. Governing Equations
In this study, the Reynolds-averaged Navier-Stokes equations and continuity equations are used as the governing equations. The Renormalization Group (RNG) turbulence model is taken into account for enclosing equations:
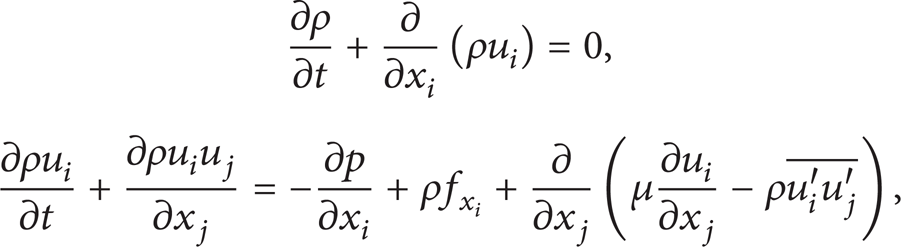
where ρ, u, P, μ are the air density, the velocity, body force, and dynamic turbulent viscosity. Each of subscripts i, j, k denotes one of the components corresponding to the spatial axes of x, y, z. δ
ij
represents the Kronecher Delta, and
RNG turbulence model induces the functions of turbulent kinetic energy k and turbulent dissipation rate ∊ to deal with Reynolds Stress:
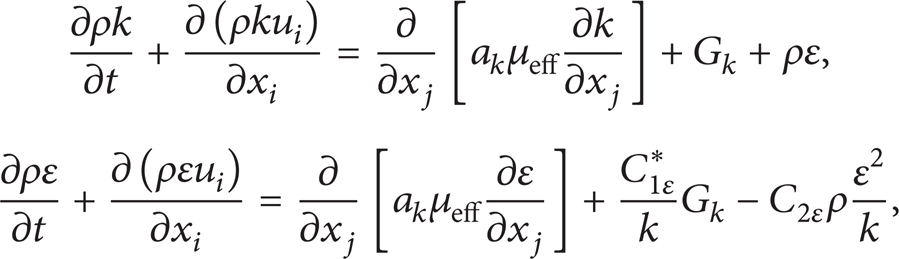
where

3.2. Numerical Solutions
The computational domain is divided into three parts: the up-stream guide vane domain, the rotor blade domain, and the down-stream guide vane domain, which is shown in Figure 2. The guide vane domains are stationary, and the rotor blade domain rotates at different RPMs (Revolutions Per Minute) and is defined using the Moving Reference Frame (MRF) model to aid in the integration of rotating blades and stationary guide vanes.
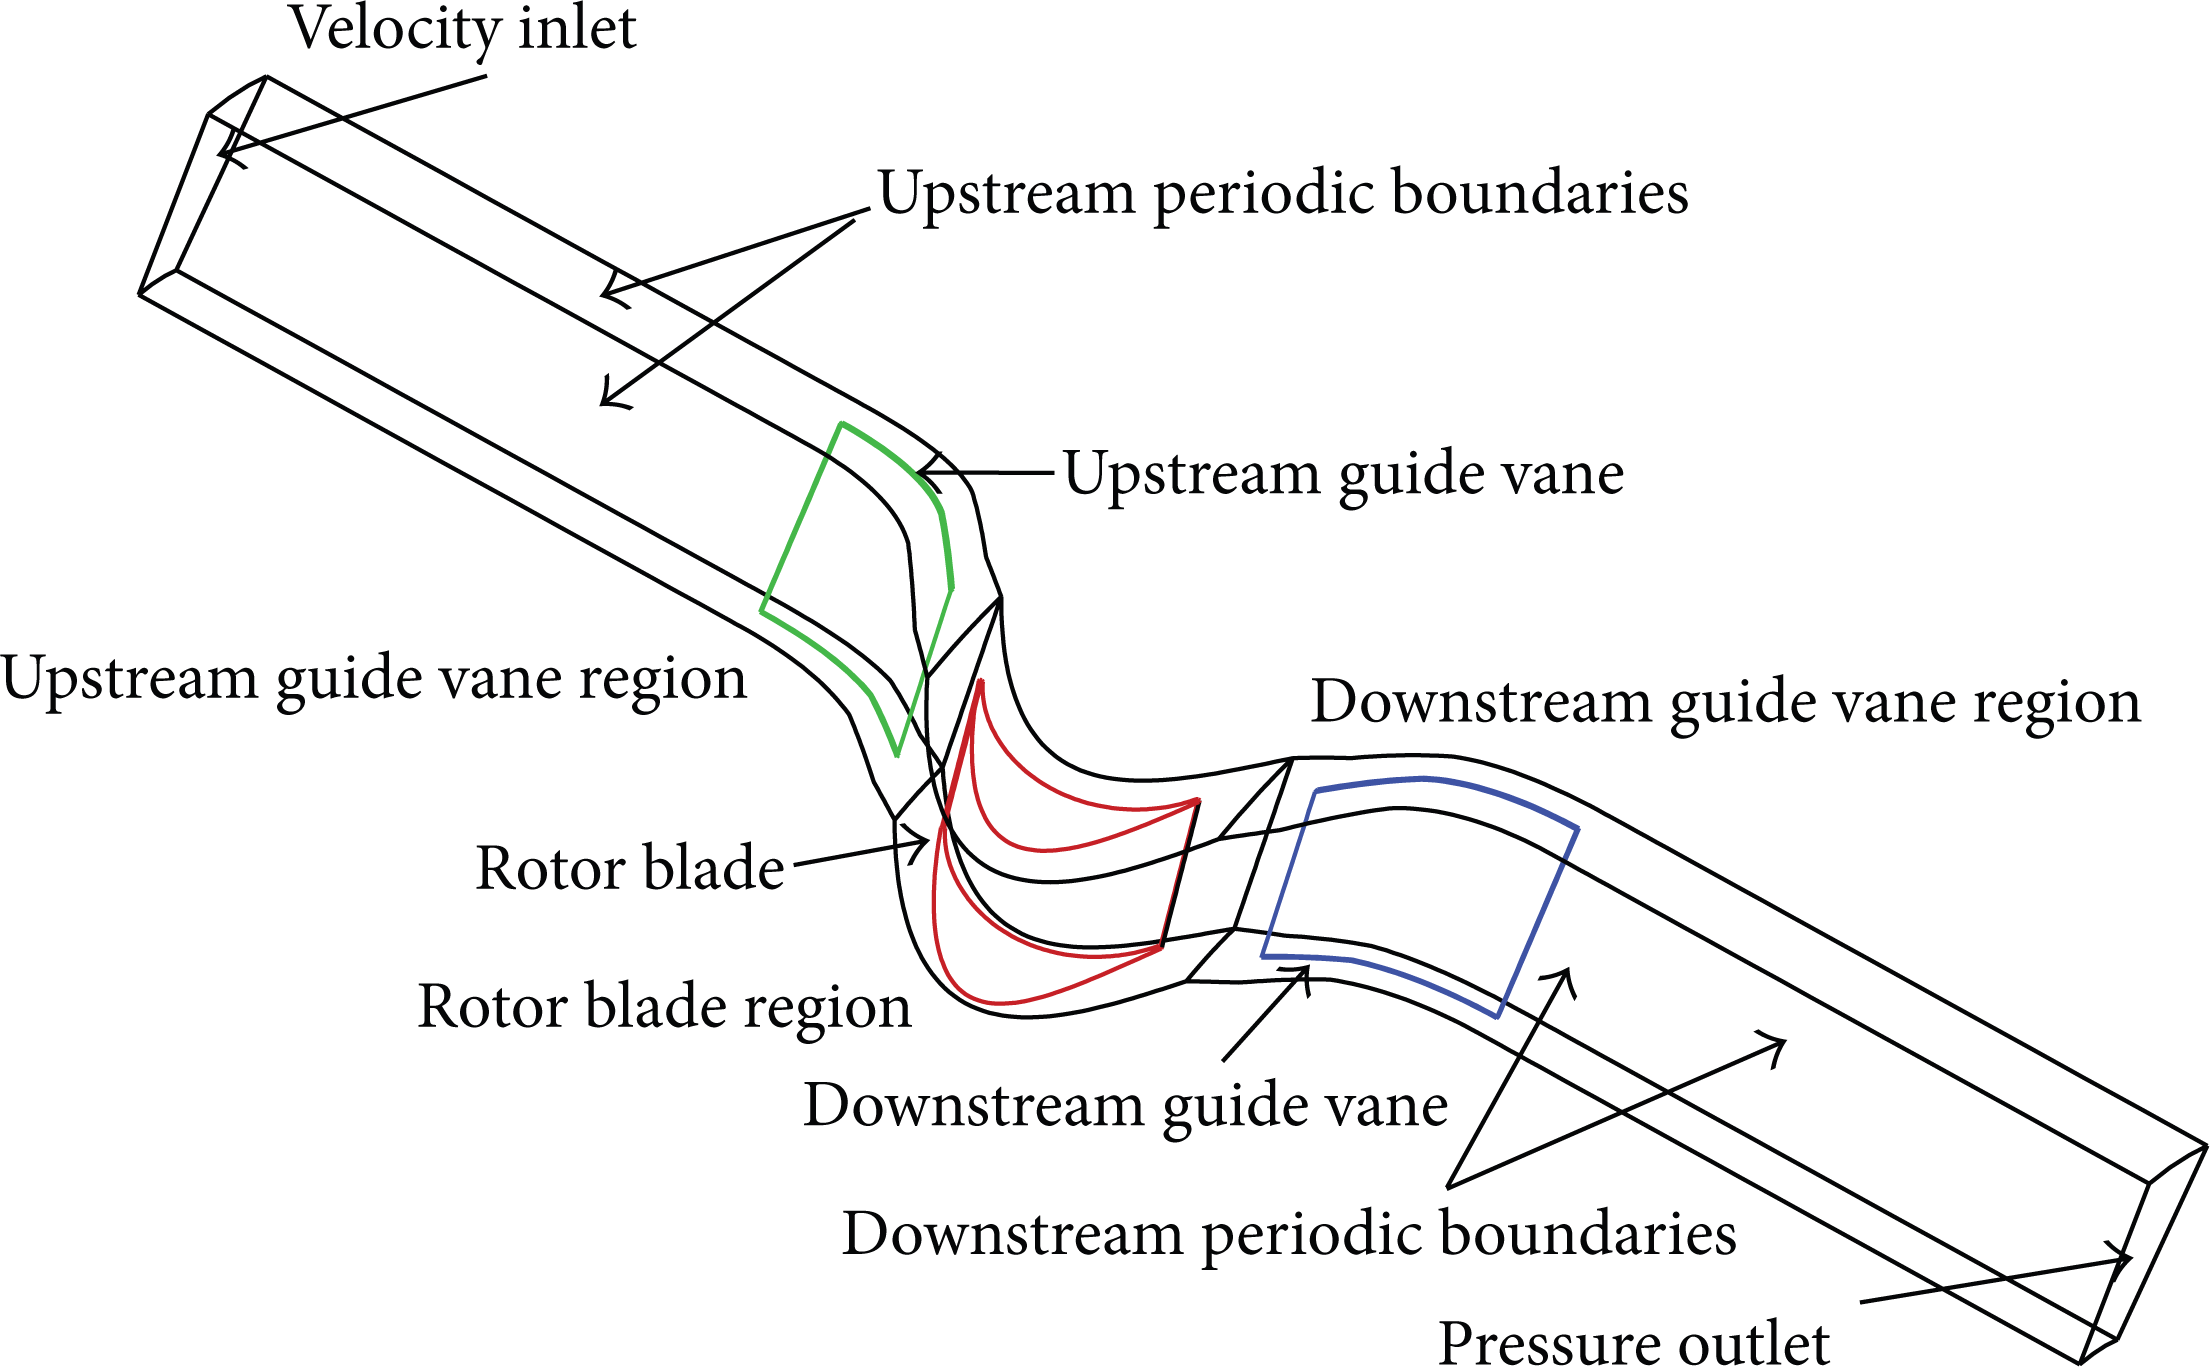
3D schematic of computational fluid domains.
As a consequence, the periodic angles for the rotor and guide vanes are different. The mixing plane model has been utilized to allow the modeling of one rotor blade/guide vane combination in order to make the calculation practical. In the mixing plane model, each fluid zone is solved as a steady-state problem. After each iteration, the area-weighted averages of flow data at the mixing plane interface are taken in the circumferential direction on both the upstream and downstream boundaries. The above process is used to create profiles of flow properties, which are employed to update boundary conditions along two zones of the mixing plane interface.
The main boundaries of the computation domain are also given in Figure 2. Rotational periodic boundaries were defined at each side of rotor and guide vane regions. The impermeable condition was employed for the cover and bottom of computational domains. A velocity inlet was defined at the inlet of the upstream guide vane region, and pressure outlet boundaries were defined at the outlet of downstream guide vane region, where the static pressure was set as the gauge pressure and the default value in Fluent is utilized. The detailed definitions of above boundary conditions are described in the Fluent User's Guide [17].
Governing equations are solved by using the Finite Volume Method (FVM). The Quick discretization is considered for convection terms. The pressure-velocity coupling is calculated using the SIMPLEC algorithm. In the present study, the rotation speed has been kept unchanged while the incident velocity was varied to produce a range of flow coefficient. Numerical frames and Cooper type meshes of the impulse turbine are generated by the Grid-preprocess Software Gambit 2.2 (Figure 3). The number of grids is around 2–2.5 × 10⁴ and Reynolds number is approximately 0.92 × 10⁵, where the characteristic length is defined as the rotor blade pitch S r . Meshes near the surface are refined using the boundary layer regular grids in Fluent. Mesh independence effects and Y+ calculation have been performed in previous studies [18]. Nonequilibrium wall functions were employed as the near wall modeling, which were preferred to standard wall functions due to their better capability to deal with complex flows involving separation, reattachment, and strong pressure gradients [17].
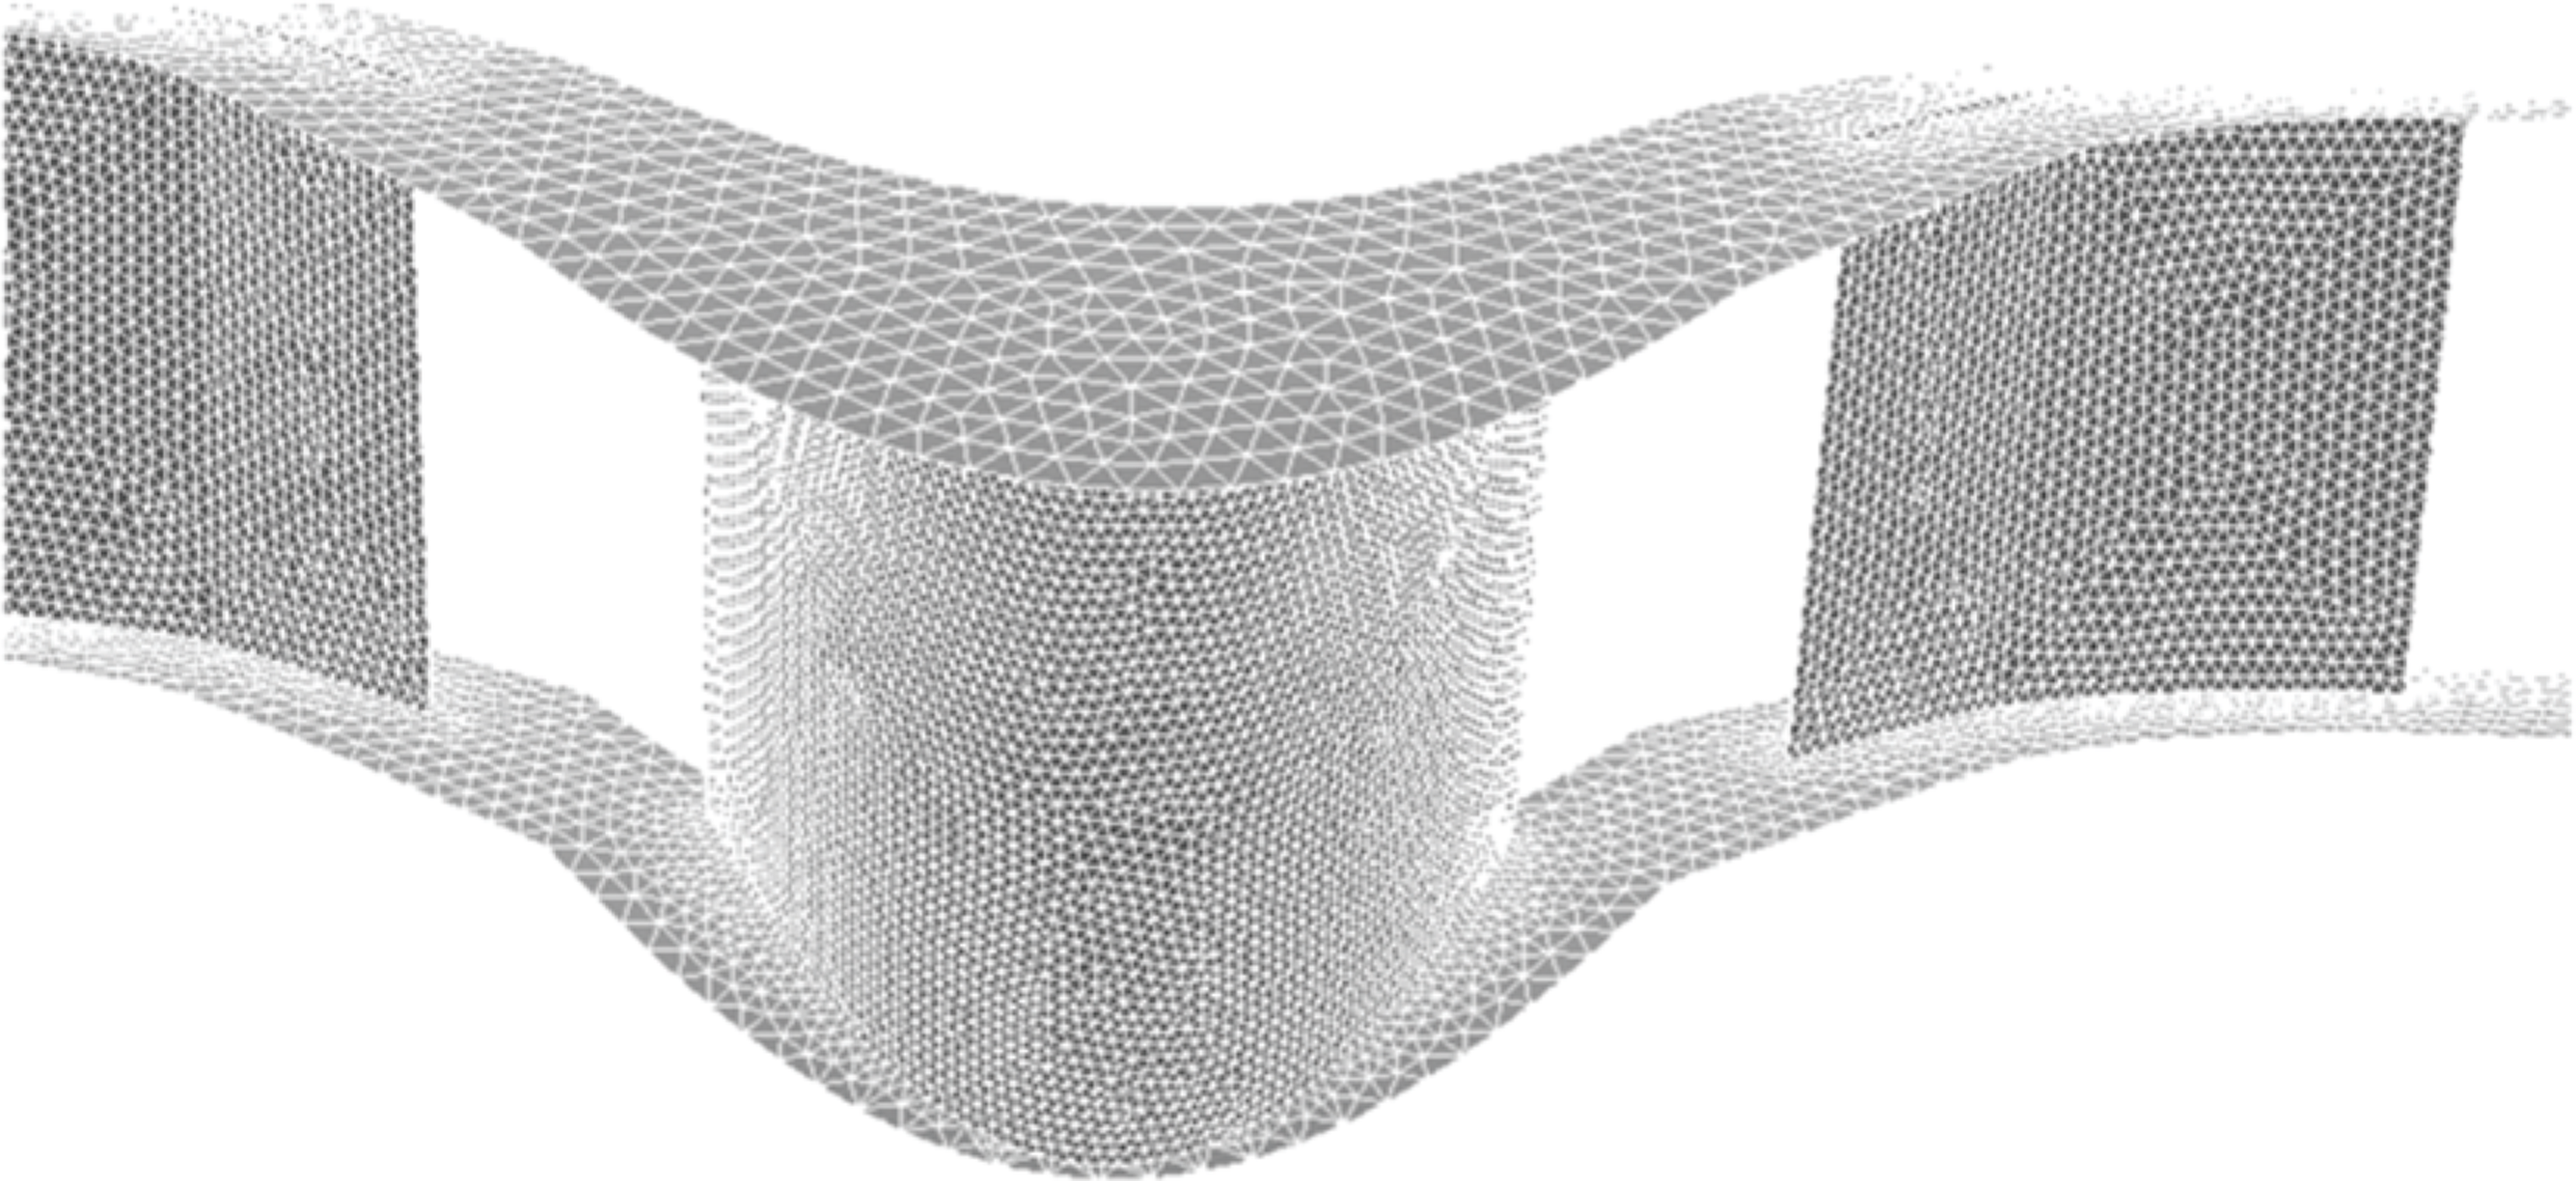
Schematics of 3D computational meshes for impulse turbine.
4. Results and Discussion
4.1. Experimental Validation
Operating performance of the impulse turbine within various setting angles of guide vanes is calculated and compared with experimental data in [1] using the 3D numerical method proposed in the present paper. As shown in Table 1, the radius of circular arc of guide vane R a and the camber angle of guide vane δ vary with the setting angles of the guide vane θ. The tip clearance employed in this section is T C = 1 mm. Comparisons between experimental and numerical results for input coefficients, torque coefficients, and turbine efficiencies are shown in Figures 4–6, respectively. For the flow coefficient ϕ, the values defined at the incident velocity inlet are considered as mean axial velocities v a in the numerical model.
Variation of guide vane profiles.

Comparison between numerical and experimental results on input coefficients.

Comparison between numerical and experimental results on torque coefficients.

Comparison between numerical and experimental results on turbine efficiencies.
From Figure 4, it can be seen that 3D input coefficients C A from the numerical simulation are overpredicted for 15° setting angle because of the overprediction of pressure difference, which is induced by overestimation of air flows hitting on the pressure side of rotor blades in the numerical model. Within setting angles increasing, the overestimation effects will reduce. Idealized conditions including smooth blade surfaces and flow paths cause less pressure drops along the air flow traveling, consequently the input coefficients are underestimated comparing with experimental results at larger setting angles. For the torque coefficient C T in Figure 5, the computed values generally agreed well with measured values. Since turbine output torque is derived from normal vectors of surface forces, the underprediction of pressure difference between blade two sides as described above has caused driving torques decreasing. Therefore, torque coefficients will be underpredicted comparing with experimental results.
The computational prediction for turbine efficiencies η as shown in Figure 6 matches well with experimental results especially at high flow coefficients except 15° setting angle. The smaller values for 15° setting angle are generated by numerical overestimating for input coefficients. The above comparisons imply that the present 3D numerical model has shown its ability to predict the operating performance of the impulse turbine and RNG turbulent model produces good results in the higher rotational speed of the turbine, comparing with the prediction using standard k-∊ turbulent model in lower flow coefficients in [5].
4.2. Effects of Tip Clearance
The tip clearance of the impulse turbine is defined as the distance between the outside diameter and the tip of rotor blade. In the present study, the outside diameter is fixed and the tip clearance changes with the variation of rotor blade heights. The setting angle of the guide vane in this section is fixed as 30°. Tip clearance ratio T C is employed to demonstrate the effects of the tip clearance on impulse turbines, defined as follows:
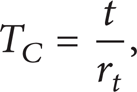
where t is the tip clearance and r t is the tip radius. Five ratios (T C = 0, 0.17%, 0.35%, 1.03%, 1.72%) are utilized, where the tip radius is fixed and tip clearance varies as 0, 0.5 mm, 1.0 mm, 3.0 mm, and 5.0 mm according to the variation in the rotor blade height (45 mm, 44.5 mm, 44 mm, 42 mm, and 40 mm). Although T C = 0 is difficult to achieve in the arena of practical engineering, it is necessary to show its influence on flow distribution and turbine efficiency, which is helpful for design and further optimization.
Flow path lines on the rotor blade surface within different tip clearance ratios are given in Figure 7. It can be seen that path line distribution on the suction surface is uniform as T C is zero. Vortexes are generated at the leading edge of blade along the blade passage and make the flow structure more complex. It also should be noted that no air flows on the pressure surface can overtop and affect the flow field around the suction side because of the structure characteristics. When the tip clearance ratio occurs, air flows not only generate vortexes at the leading edges but also overtop the rotor blade tip from pressure surface and generate vortex rolling-up around suction surface. Once above phenomena occurs, this part of air flows cannot contribute to the toque generation on pressure surface and induce energy loss to cause a decrease in efficiency. It can be imaged that more energy will be lost when the tip clearance increases.
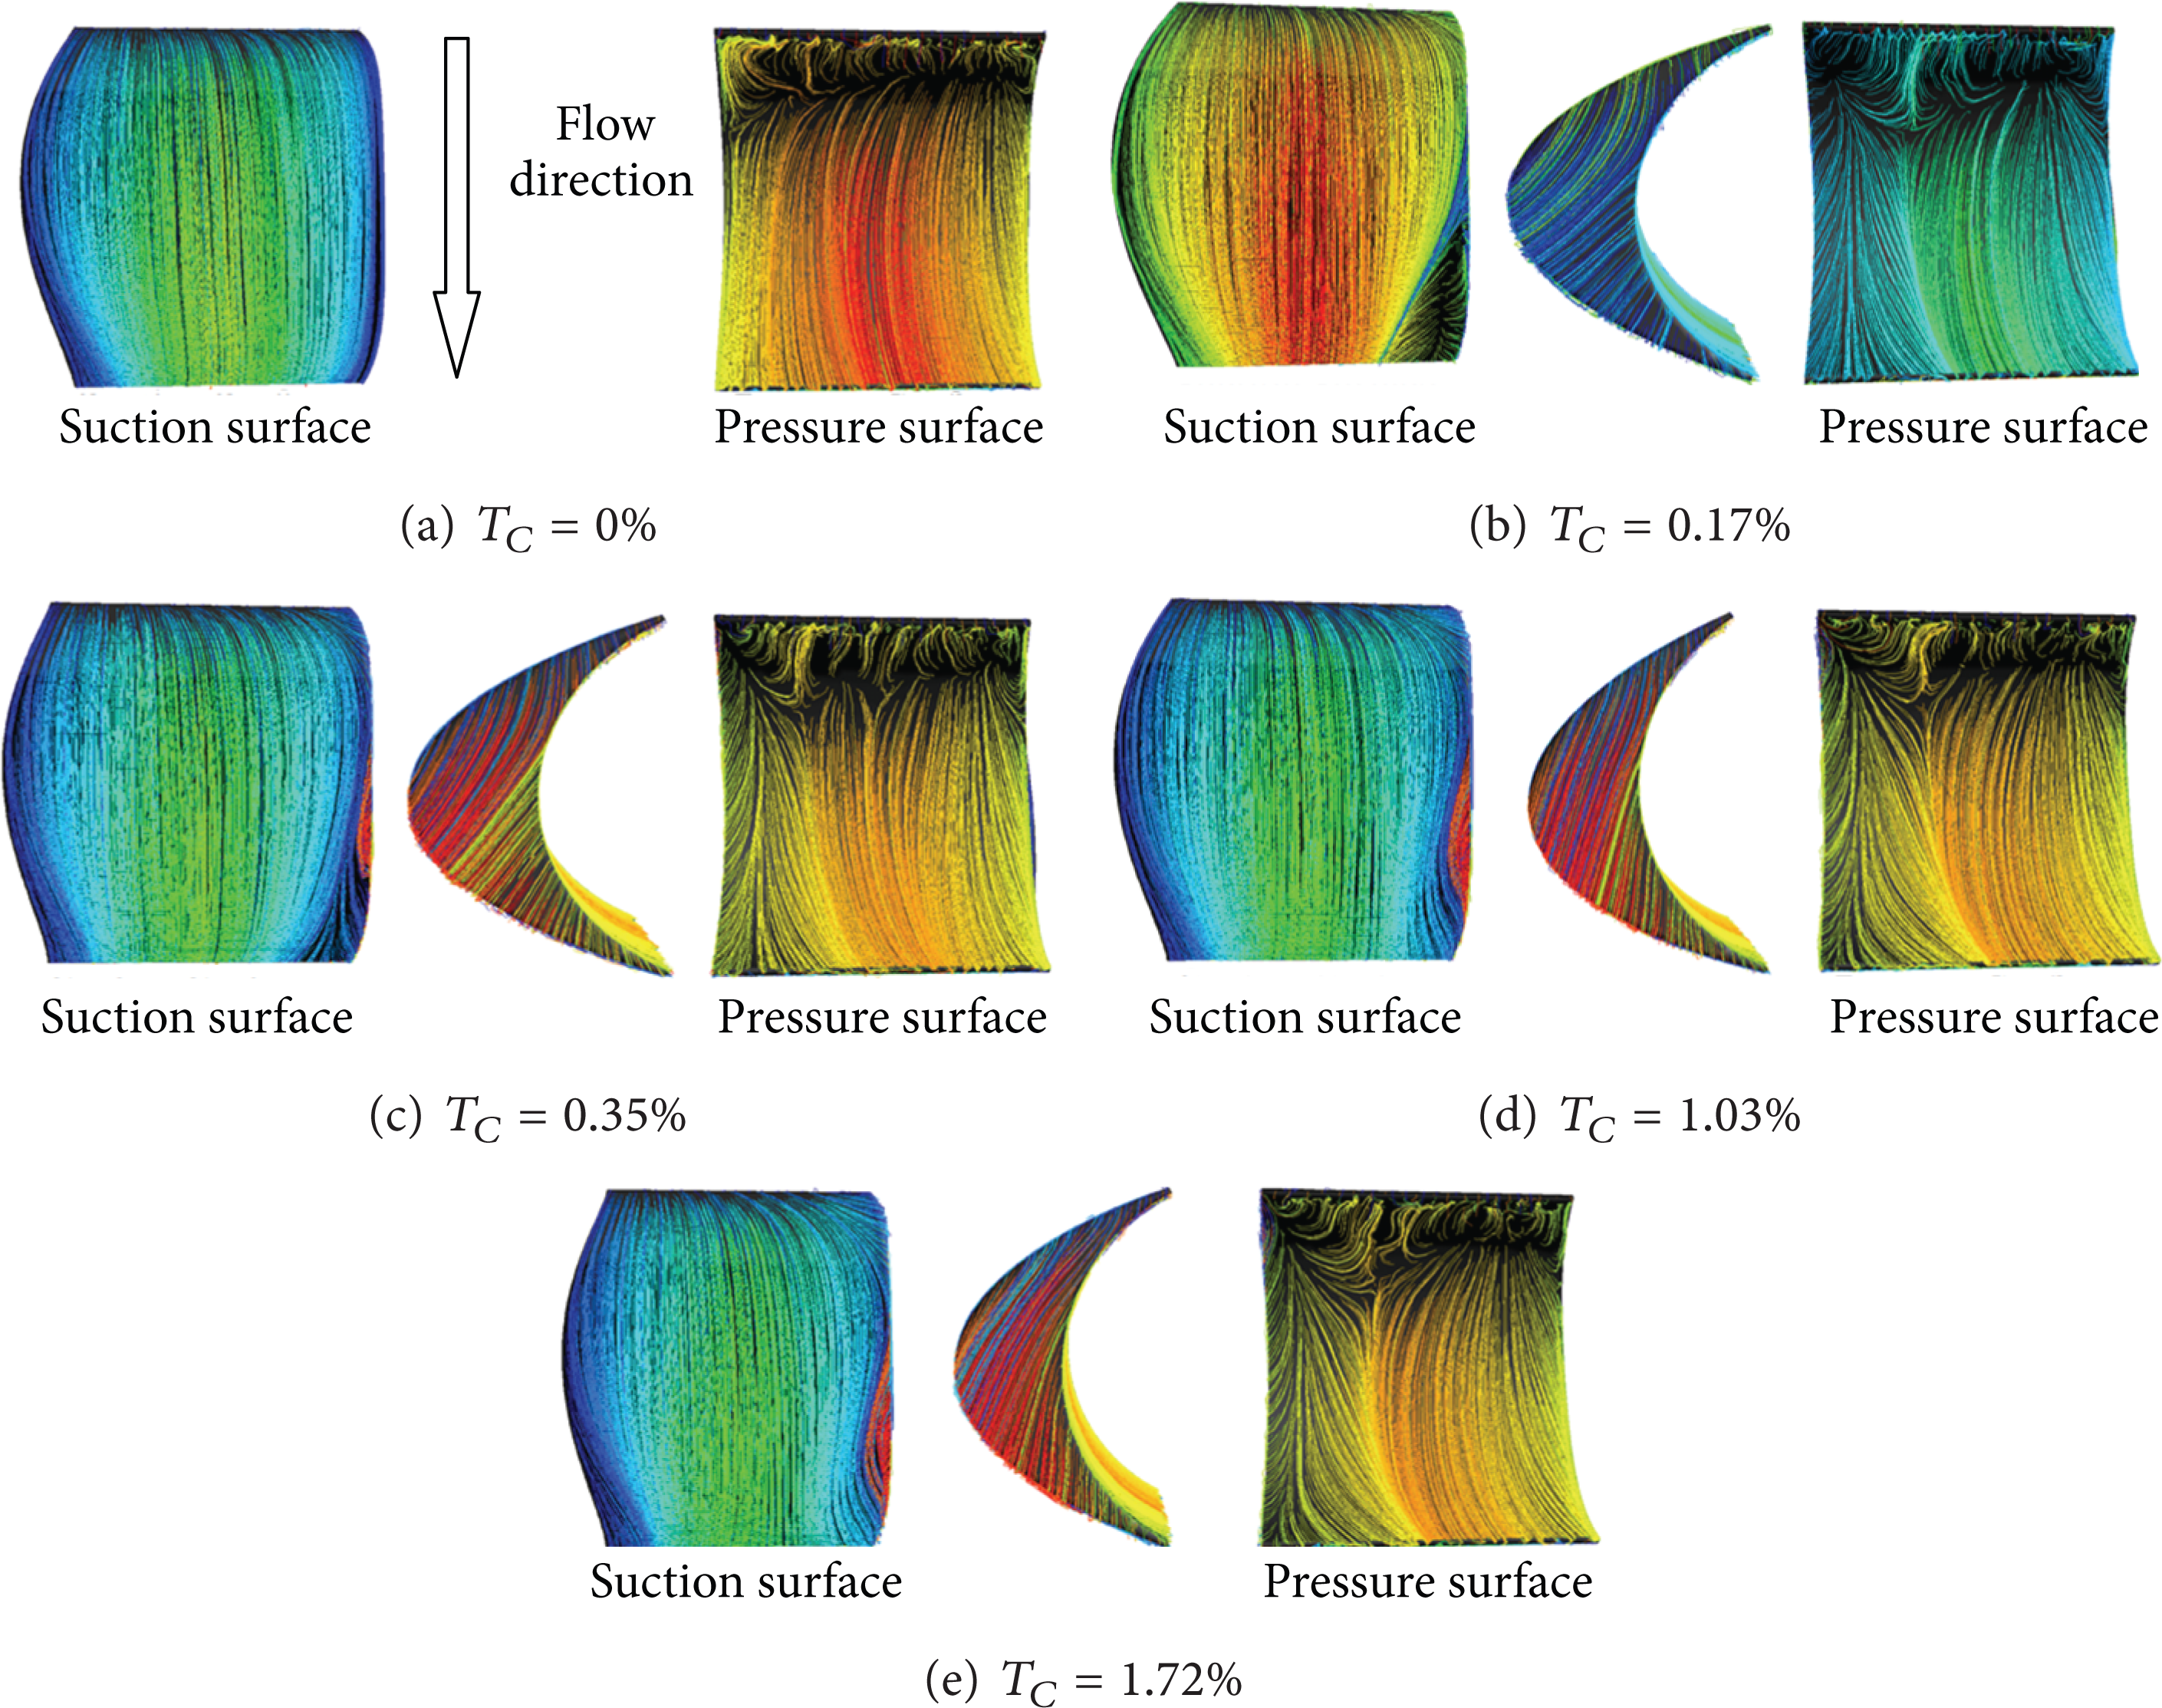
Flow path line distributions for various tip clearance ratio (ϕ = 1.5).
Figure 8 illustrates the gauge pressure distributions on rotor blade surfaces for various tip clearances under certain flow coefficients. On the suction side, the vortex occurs near 40% of blade passage width for all the tip clearance ratios. The size of the vortex keeps growing as the tip clearance decreases. On the other hand, the tip leakage vortex occurs at the trailing edges on the pressure surface especially for all nonzero tip clearance ratios and there is no visible vortex generated on the pressure surface for T C = 0. From Figure 8, it can be interpreted that the tip leakage flow induces a significant area of low-momentum fluid.
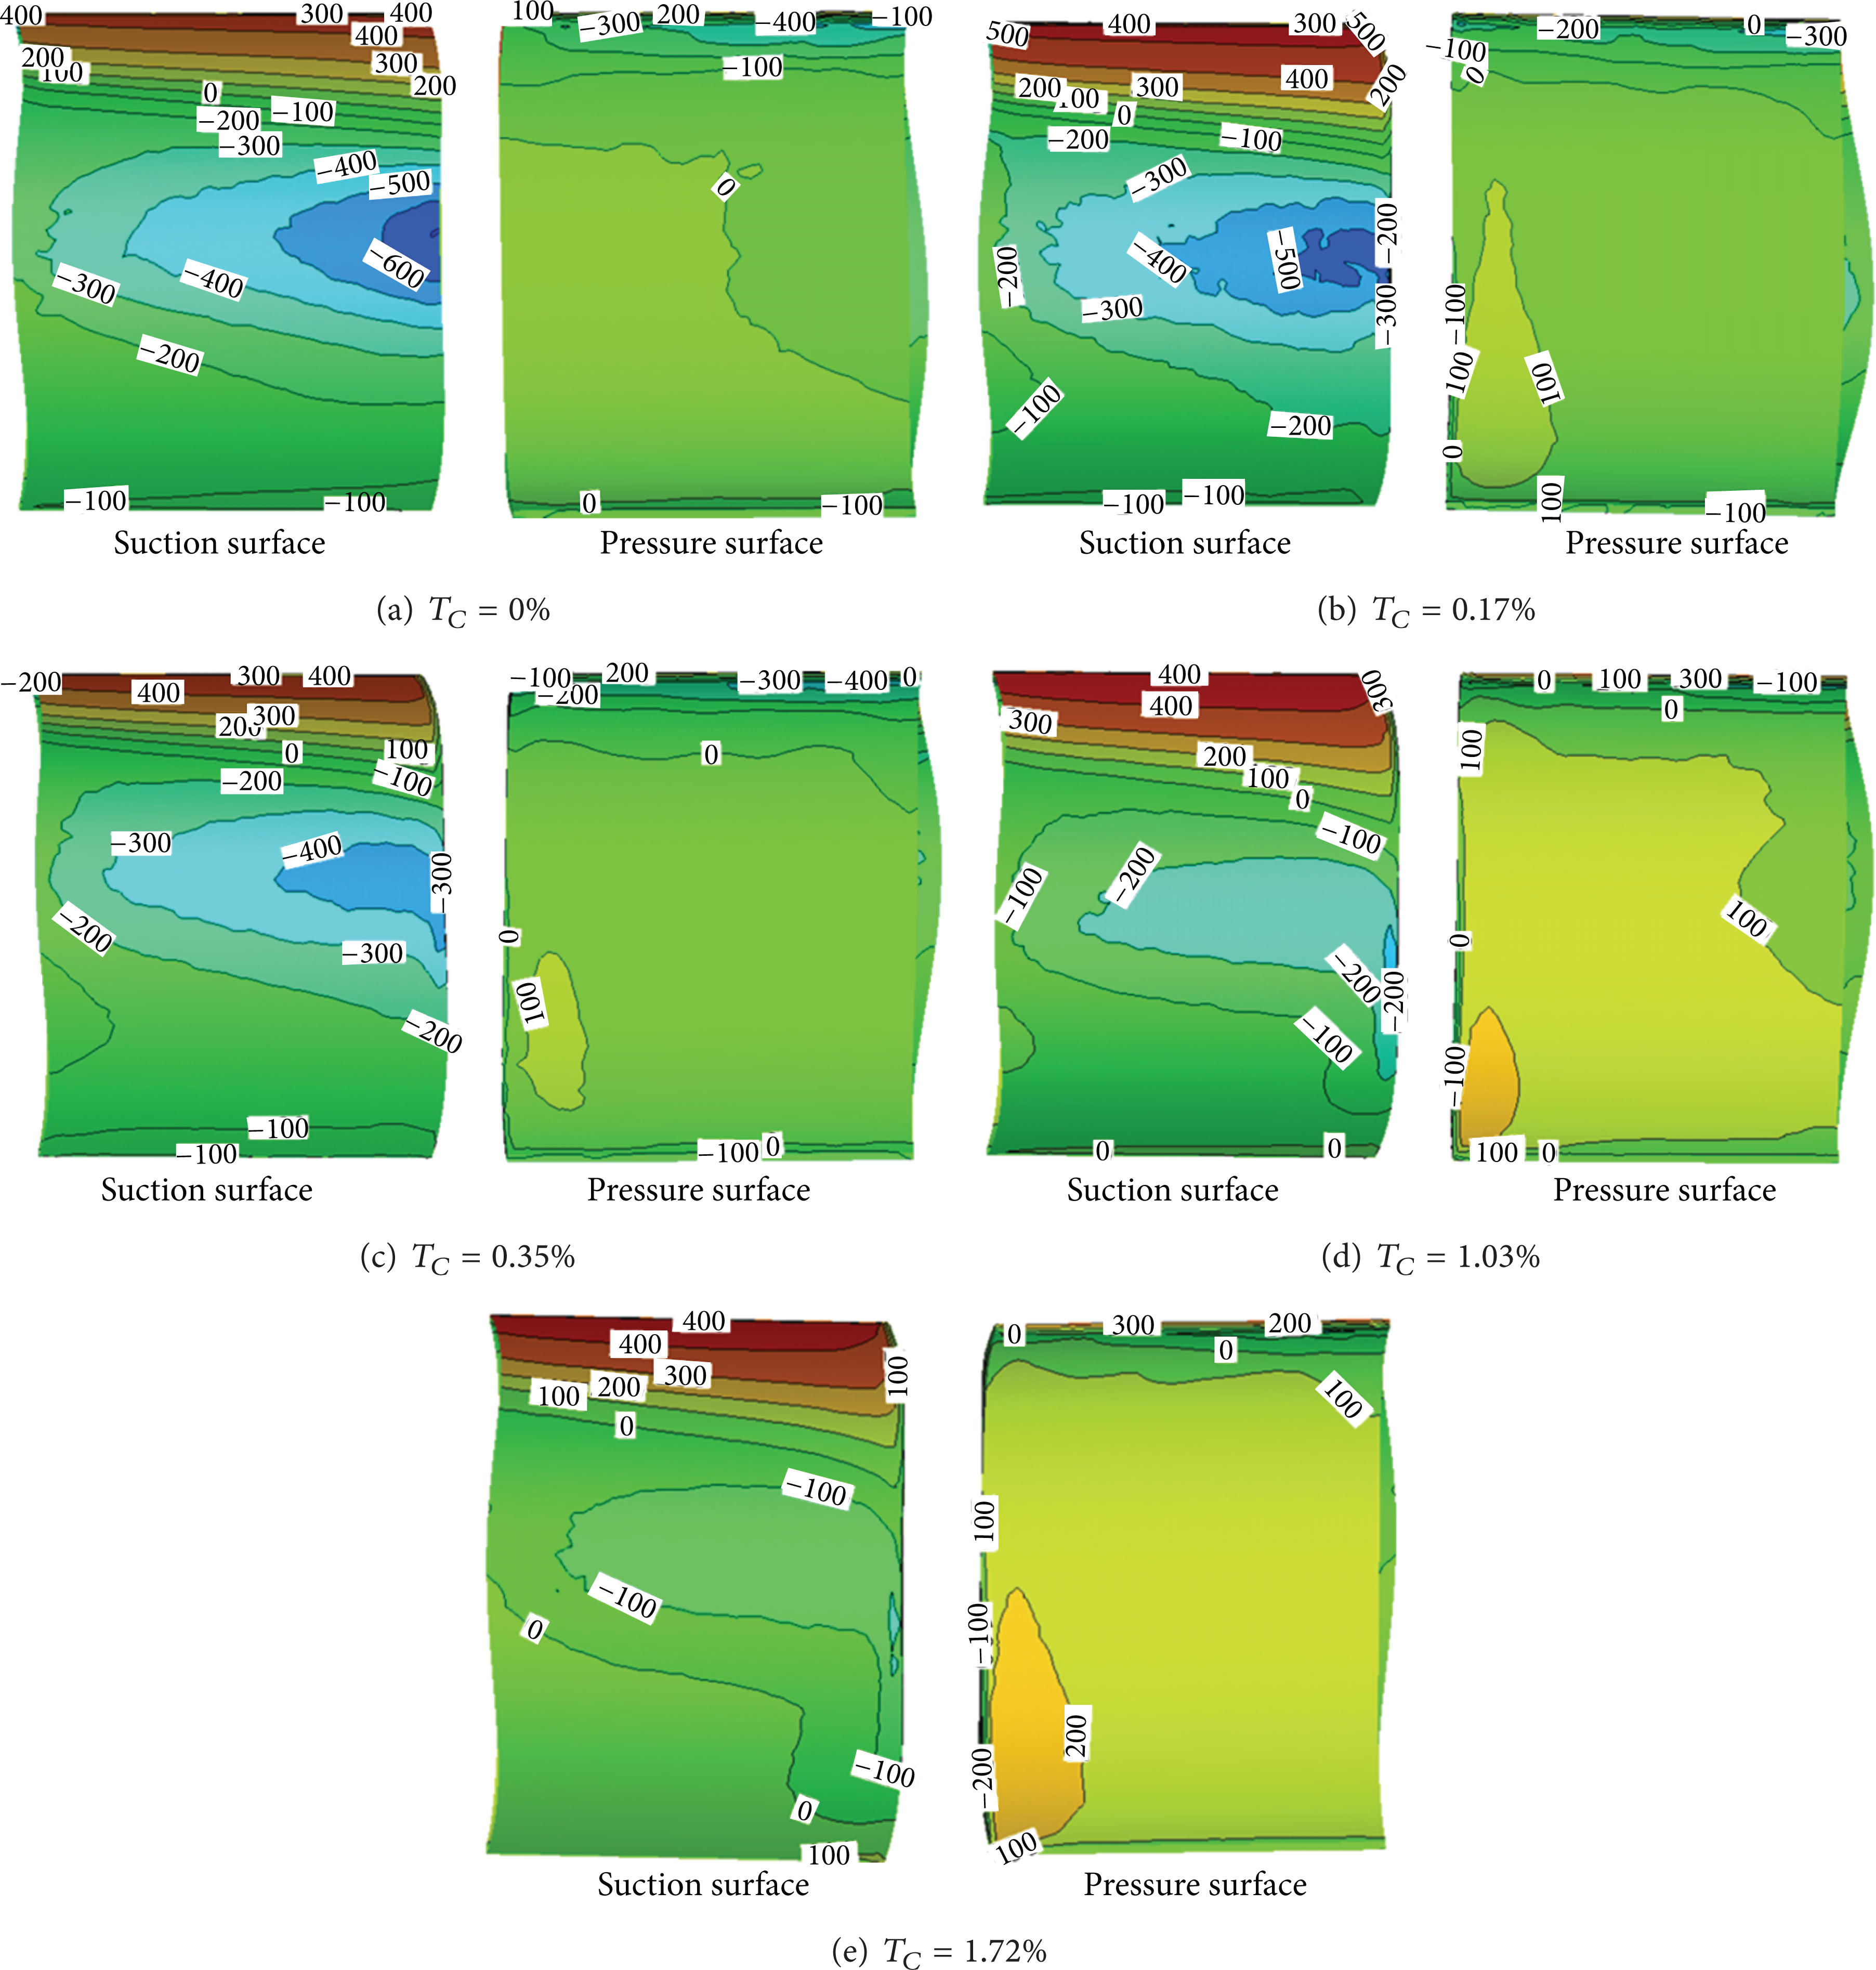
Pressure distribution on blade surfaces for various tip clearances (ϕ = 1.5).
Effects of the tip clearance ratio on turbine efficiency are illustrated in Figure 9. As shown in Figure 9 (a), the difference of input coefficients with different T C is minor when the flow coefficient is small (ϕ ≤ 0.5). At higher flow coefficients, input coefficients become larger with flow coefficients increasing. On the other hand, it can be concluded from Figure 9 (b) that torque coefficients will decrease as the tip clearance ratio grows. In Figure 9 (c), turbine efficiency will get larger together with flow coefficients as ϕ < 1. After the peak of flow coefficients, the turbine efficiency will get smaller. Impulse turbines with smaller tip clearances show better operating performance because of its lower energy loss over the tip of its rotor blades.

Numerical results of turbine performance for various tip clearance ratios.
Generally, it can be concluded that tip clearance has significant effects on turbine efficiency. Although turbines with smaller T C possess better operating performance, the complex structure of impulse turbines leads to difficulty in manufacturing. Therefore, it is necessary to consider all the influential factors and the tip clearance ratio 0.35% ≤ T C ≤ 1.03% is optimal in the selected domain of tip clearance values. According to the above analysis, optimization of rotor blades to reduce vortex rolling-up will also improve the turbine efficiency.
5. Conclusions
In this paper, a 3D numerical predicting model was established to investigate the operating performance characteristics of the impulse turbine, which has been improved from the basic design and is planned to be utilized in the 500 kW pilot OWC system on Jeju Island, Republic of Korea. The 3D numerical model was compared and validated with the experimental data for various setting angles of guide vanes. The close agreement of computational and experimental data shows the capability of the present numerical methodology on predicting flow distribution and turbine operating performance. RNG turbulent model shows better capability especially for higher flow coefficients within large rotating velocities.
Effects of tip clearance on turbine efficiency for the designed impulse turbine presented in this paper were studied numerically. It can be seen that larger tip clearance will cause more air flows from the pressure surface overtopping the tip of rotor blade and vortex rolling-up. Although smaller tip clearance generates better operating performance of impulse turbine, manufacturing and assembling difficulties will restrict the application of small tip clearance. Overall considering of operating performance and turbine fabrication, the value of tip clearance is recommended to be around 0.3 for better torque output and wave energy conversion.
Footnotes
Acknowledgments
This Project is supported by NSFC (Grant No.: 51279190 and 51311140259), Research Fund for the Doctoral Program of Higher Education (20100132110012) of China and Project “Development of Ocean Energy Utilization System” funded by Ministry of Land, Transport and Maritime affairs of Korea.