
Abstract
As an important interference source of railway vibration, track irregularity is studied in this paper. It is presented that irregularities in the vertical profile and alignment can be modeled as a Gaussian random process. The power spectral density (PSD) of the irregularity is calculated and discussed. By analyzing the model, level-crossing properties as well as peak statistics are studied and compared with the observed data.
1. Introduction
High speed railway constructions are being extended rapidly in China. Maintenance of this kind of long linear infrastructure aimed to reduce the malfunctioning and catastrophic derailment risks is challenging civil and rail engineers. As an important interference source of railway vibration, track irregularity influences train safety and comfort of passengers and therefore is one of the key factors of controlling the train speed. Though rail track irregularity is frequently observed, the accurate condition assessment of rail track system remains an unsolved problem.
Currently in China, only time history analysis of mega test data of track inspection car is performed to investigate whether the operation standards are reached or not. The track maintenance scheme is advised on basis of the data analysis [1]. Statistics of mean value, a threshold value, and standard deviation are only used to characterize the condition of unevenness. The utilization of invaluable mega data obtained under current data analysis scheme is inefficient and insufficient. Since the current data analysis methods seldom discuss the frequency domain properties, the periodical components are ignored.
Therefore, a more efficient data analysis approach is required. Because of the random nature of irregularity, random modeling is expected to describe track irregularity and assess railway safety. There have been several studies on quantifying track irregularities. Among different methods, the power spectrum density (PSD) method and level crossing estimation are widely used.
Corbin and Kaufman [2] discussed the PSD of track irregularity data obtained from American railways, and the periodic components in the PSD were studied as a tool to evaluate track conditions. Iyengarand Jaiswal [3] established a Gaussian random field model for vertical irregularity data obtained from Indian railways. Random field theory [4] was widely used in this research. The model can also predict the values of peak amplitudes in a given track length. Iyengar and Jaiswal [5] also proposed a non-Gaussian model to analyze track irregularity data. The method expressed the process as a series with finite number of terms, wherein the first term is a Gaussian process with zero mean and unit standard deviation. Non-Gaussian higher order correction terms are added to this such that each succeeding term is orthogonal or uncorrelated with all the previous terms. This model was used when data showed nonzero skewness and large deviations of kurtosis from three. Massel [6] applied the power spectrum analysis as a tool in the study of rail surface corrugations and presented a comparison of results from different surface conditions. Mohammadzadeh et al. [7] analyzed the track geometric irregularities using reliability techniques to study railway derailment probability. Sezer and Atalay [8] established a fuzzy logic based control algorithms to model the track irregularity and analyze the vibration. Pombo and Ambrosio [9] also presented a new contact model to include track irregularities for railway vehicle dynamic analysis. Wei et al. [10] focused on monitoring the train wheel to evaluate the operation risk. Furthermore, researchers from several countries measured the PSD of their own countries' track irregularities, respectively, such as Germany, Great Britain, and the US [1]. This paper optimizes the analysis of test data of track inspection car, which focuses on the frequency spectrum analysis and the characteristics of the random field.
2. Data
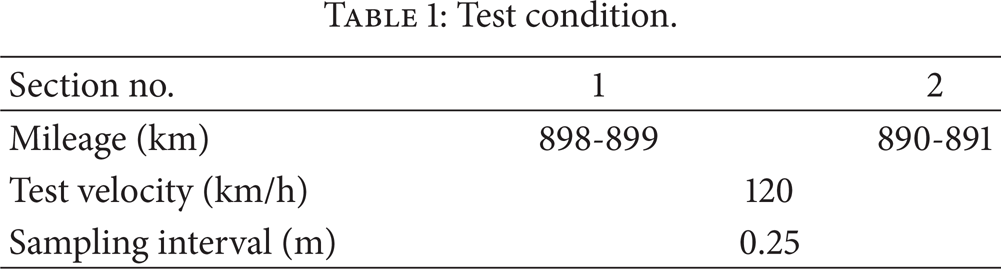
The track irregularity data studied in this paper was acquired by a track inspection car in November 2011, on the Qinhuangdao-Shenyang passenger railway line in Northern China, where the maximum operation speed is 200 km/h. Data from two sections of the track are analyzed, whose parameters are shown in Table 1. The track inspection car records 7 different parameters of irregularity, which includes vertical profile (left and right), alignment (left and right), lateral profile, gauge, and twist of track. However, in practice the vertical and alignment irregularities are used and studied extensively. The data used in this paper are shown in Figure 1.
Test condition.

Data recorded by track inspection car.
3. Gaussian Check
One of the most desirable properties of a random process is its Gaussian nature, which simplifies the process of calculating PSD and level crossing statistics. The usual ways to verify this property include computing moments of data, calculation of cumulative distribution function (CDF), and performing the hypothesis testing.
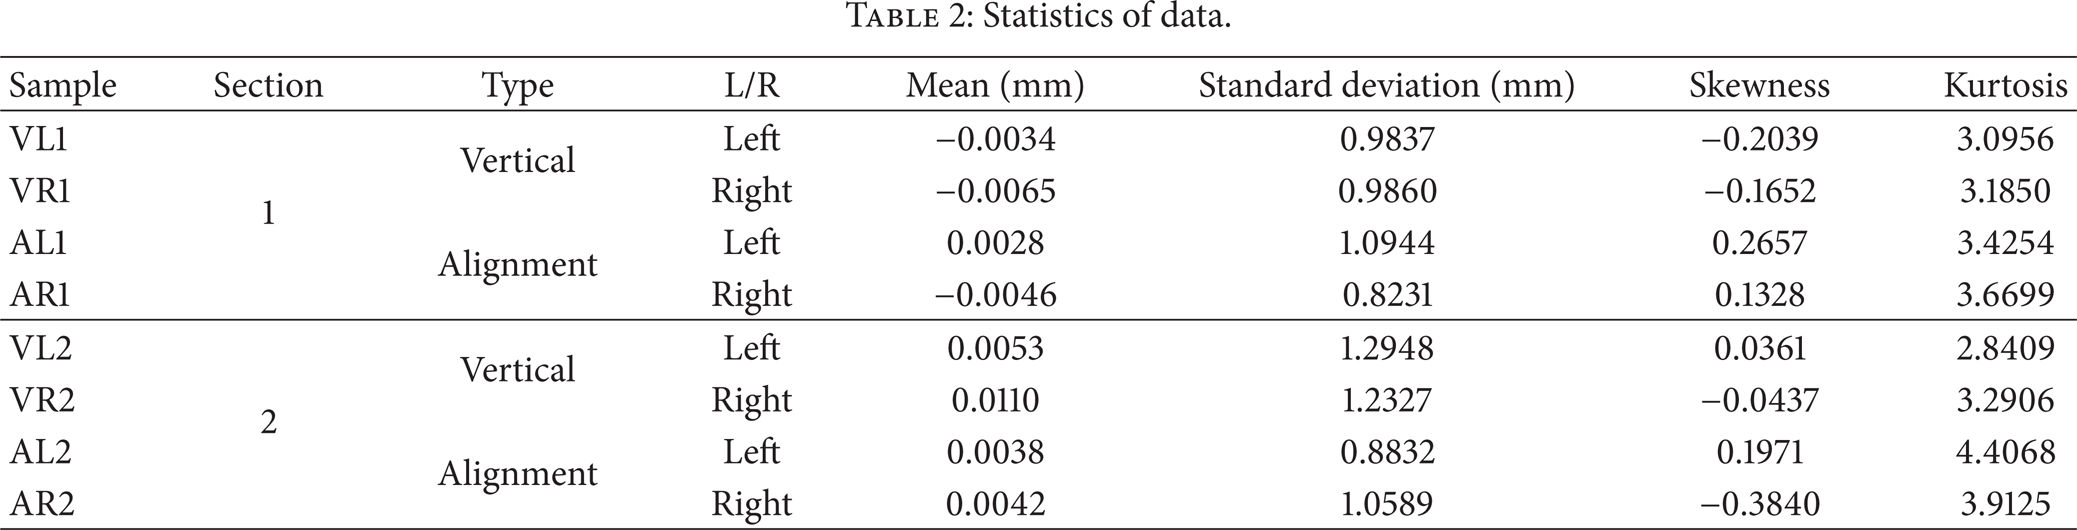
The first four moments of the eight samples of data are shown in Table 2. It can be observed that, for all samples, the skewness of the data is about zero and the kurtosis is near three, which indicates that the observed data may be modeled as normally distributed. Furthermore, the Kolmogorov-Smirnov (K-S) test is performed as well. The CDFs of all the samples and the respective results of K-S test are shown in Figure 2, which support the Gaussian properties of all the samples.
Statistics of data.

Results of K-S test.
4. PSD Calculation
PSD function is an important description of stochastic process, which provides a basic feature of data in frequency domain. There are several algorithms for computing the PSD. Periodogram method is applied in this paper and the results are shown in Figure 3. It can be observed that components whose spatial frequencies are between 10−2–10−1 m−1 are most obvious for all samples.

Result of PSD calculation.
5. Fitting of PSD Functions
Several studies have presented different PSD fitting models, since an analytic expression of track irregularities can be used as the input of dynamic analysis of wheel-track system. Chen et al. [11] gave PSD models for vertical and alignment irregularity for railways in China. For vertical irregularity PSD, the model is

And the model for alignment irregularity
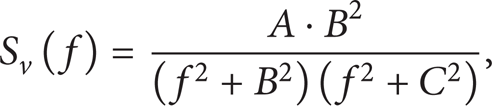
where S (f) is track irregularity PSD, f is spatial frequency A, B, and C are fitting parameters. Based on the data acquired from Section 1, the results are shown in Table 3.
Results of fitting parameters.

6. Level Crossing
As the data has a Gaussian random nature, the classical level-crossing and peak statistics theory [12] is applied here to calculate the number of zeros and peaks. The PSD of the irregularity data u (x), which is a zero-mean Gaussian random field, is denoted as S (f), where f is the spatial frequency with unit cycles/m.
The theory follows that
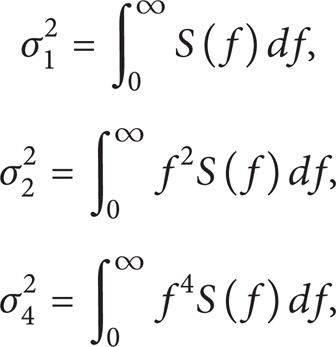
where σ22 is the variance of the first derivative process of u (x), and σ42 is the second derivative one.
The estimated average number of upward zeros and peaks in a length L is

Calculation results of σ1, σ2, and σ4 for irregularity data samples related with Section 1 are shown in Table 4. The number of zeros and peaks can be observed from the original data directly as well. The comparison between observed and estimated average number of zero level crossing and peaks is shown in Table 5. This section of track was in great quality according to the current standard. The results show that the estimated number of zeros is close to the observed one, but the results for estimated peak numbers are not very satisfying, which requires further research in the future.
σ1, σ2, and σ4 values.

Crossing and peak statistics.

7. Conclusions
Random process modeling is extensively studied in engineering, which is an important tool for understanding railway operation especially about track irregularity. But the current technical methods of evaluating track conditions involve little information about random model properties, also nothing about frequency domain. This situation suggests that methods such as PSD analysis and cross-level statistics about track irregularities could be used to enhance the current evaluation system of track condition.
In this paper, track irregularities, which include data of vertical and alignment profile, are modeled as Gaussian random fields. PSD of irregularities mentioned are calculated and analyzed and fitted into typical PSD functions as well. By analyzing the random model of irregularities, cross-level and peak statistics are carried out and the results are compared with the observed results. By establishing a comprehensive random model of track irregularity, it can be treated as the input for the running trains on the track, which will be useful for modeling the train-track-foundation system and enhancing the operation safety. In the future work, data recorded under different traveling speeds can be analyzed. Comparisons of track in different time period can be studied as well.
Footnotes
Acknowledgments
The Tsinghua Initiative Research Program of “Research on Key Technique of Wheel-Track Test System” is acknowledged for the financial support. Inspection car data provided by China Academy of Railway Science is highly acknowledged.