
Abstract
We propose an application for power facility monitoring using distributed sensor networks. The proposed application is a virtual frequency disturbance recorder (FDR) system that estimates the frequency of a power grid using the data from a modeled grid and sends the information to the server for monitoring via wireless communication. To verify the validity of the proposed application, we conducted experiments using actual system data. The functionality of the proposed system was also verified by establishing a ZigBee-based wireless network for power monitoring and diagnosis of disturbances.
1. Introduction
Demands for IT technology have been increasing in the electricity industry to ensure stability of the overall industry in terms of stable power delivery. Research activities on intelligent technology for wide-area protection relaying are being actively conducted to prevent wide-area blackout that leads to exponential damage. To prevent massive blackout, the development of an intelligent technology for wide-area protection relaying is necessary, which is capable of handling exceptional situations and minimizing damage, and technologies on system frequency monitoring and prediction have become more vital to intelligent wide-area protection relaying [1, 2]. In particular, research on real-time monitoring and data transmission using a ZigBee-based ubiquitous sensor network (USN) is actively being carried out [3]. The application of ubiquitous sensors in power facility monitoring is expected to help reduce the damages and the time required for failure recovery using real-time online monitoring and failure-area locating features.
Most active research activities on the use of sensor networks in power facilities have been focused on power monitoring and diagnosis with the development of a power monitoring system based on sensor networks [4–7]. In addition, research works on USN-based advanced metering infrastructure have also been extensively conducted. A wide-area monitoring system is especially based on the ZigBee technology, and the sensor network technology has significantly affected the power industry. Power monitoring systems are used to monitor the power system status by measuring the data retrieved in real time from various sensor nodes in the power grid and facility. In particular, a Global-Positioning-System- (GPS-) based frequency disturbance recorder (FDR) has been used for preventing wide-area blackout as well as for monitoring, analyzing, and controlling wide-area systems. The FDRs installed in each area must be able to measure the system frequency in real time and relay the information to the server. The technology proposed by the USA has dominated this field [8]. A prototype of a power-system frequency monitoring and system analysis was developed under the cooperation between Virginia Tech and ABB in the USA in 2003 and has been under trial operation based on a wired network since 2004. Recently, using a wired network-based system called FNET, researchers have aimed to understand the effect of errors when they occur on the overall system by analyzing and predicting the local frequency trend in each area, and intellective stabilization of a wide-area protection by load shedding has been extensively conducted [9]. On the other hand, the testing of various disturbances in real time when they occur in an actual system is limited. Imitating a disturbance in an actual power system involves extremely high cost and poses various dangers such as blackout.
Thus, we propose a virtual FDR system based on distributed sensor networks. The proposed virtual FDR system is a real-world application capable of estimating the power grid frequency using the data collected from a modeled power grid and sending these data to the server via wireless communication for monitoring. The virtual FDR system is designed and constructed on the basis of the distributed sensor networks to prevent wide-area blackout via monitoring the expected frequency deviation during a wide-area blackout using the frequency estimation result from the voltage and current data. To verify the validity of the proposed application, we conducted experiments using the actual system data. The functionality of the proposed system is also verified by establishing a ZigBee-based wireless network for power monitoring and diagnosis of disturbances.
2. Proposed Distributed Sensor Network-Based Virtual FDR System
2.1. Overview
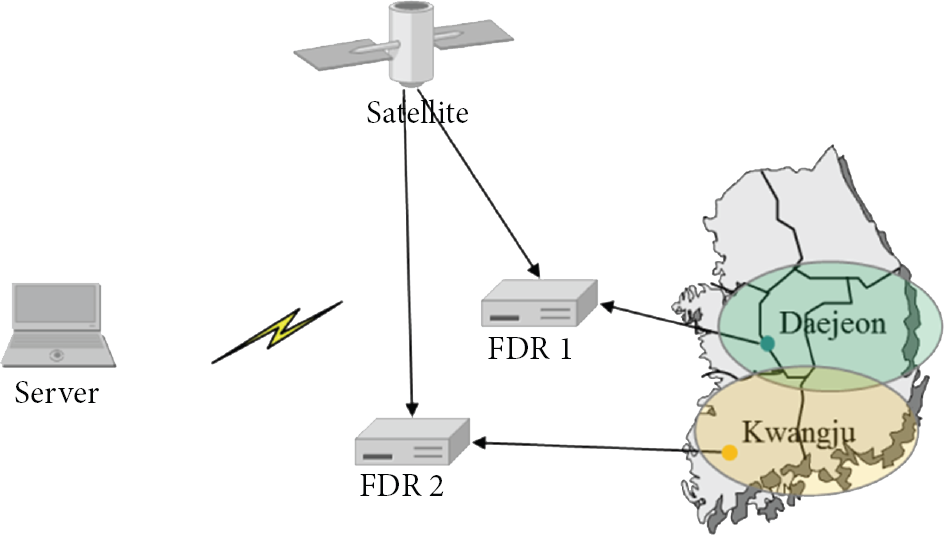
In the study of a monitoring system that allows the administrator to collect information on facilities in real time, configuration of the communication network for monitoring is very important. A power monitoring system acquires quickly and accurately various sensor element data and sends them to the base station. Thus, the system must be configured with a sensor network composed of various wired and wireless networks that use multiple sensors at the power lines and power facilities. On the other hand, a wireless sensor network is more suitable for power grid monitoring compared with a wired sensor network owing to its better performance in terms of flexibility and expandability. A wide-area power monitoring system based on distributed sensor networks measures the voltage and current of the distribution lines spread widely all over an area by installing sensors on the transformers at the distribution line of the main area. A distributed sensor network for power facilities requires low installation and operating costs and is easy to operate. It measures the voltage and current from the installed sensors and sends the data to the relay nodes. Figure 1 shows that an FDR can function as a router or sink node.

Overview of the distributed sensor network-based FDR system.
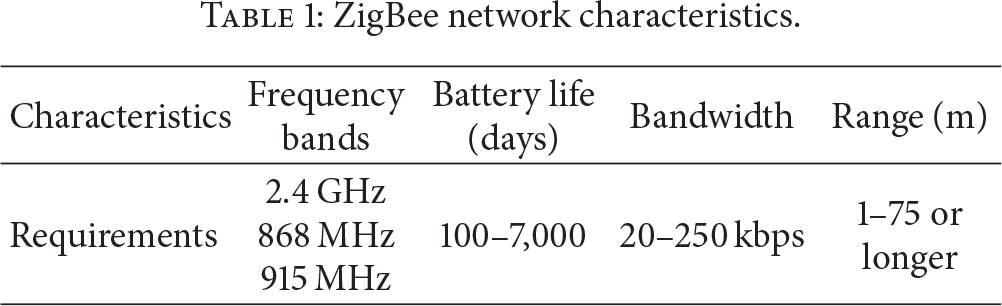
Each sensor network shown in Figure 1 includes a large number of nodes, and the sensed data used in the power monitoring are sent to the FDR. The frequency required for wide-area power monitoring is estimated from the data transmitted from the FDR, and the information is sent to the server, along with the voltage and current data. In this section, we introduce the network configuration, as shown in Figure 2, which is configured using ZigBee, a wireless communication technology suitable for a power monitoring system. ZigBee also provides superior performance in terms of power consumption, which has been known as an important requirement in a power monitoring system. ZigBee, together with IEEE 802.15.4, has the advantage of the capability to construct a convenient control system by organizing dozens of nodes into a single network. The single network can support 65,000 nodes at most, and reliably controlling more than hundreds of network nodes in an actual field is possible. In addition, a bandwidth of up to 250 kbps is required for this mesh network-based application, which is not only reliable but also controllable. Table 1 shows the characteristics of a ZigBee network.
ZigBee network characteristics.

Proposed distributed sensor network-based virtual FDR system.
The distributed sensor network-based virtual FDR system proposed in this paper uses a routing strategy that provides each node with a 16-bit address for packet transmission. Furthermore, similar to the form of a mesh network, it possesses a self-recovery function capable of bypassing an unavailable node for the others and reconstituting by itself the network using another path (which means that multiple paths exist), and flexibly managing them via the network routing table is possible.
In each virtual FDR, two kinds of data are sent to the sink or relay node, which are the GPS and the power-grid measurement data. This section demonstrates the virtual monitoring of the frequency, which is estimated from the actual data of a power grid under a condition difficult for a power grid connection. The GPS data are synchronized with the power grid measurement data sent from each virtual FDR to the server, which synchronizes the GPS signals received in a 1 s interval for a wide-area power monitoring. The power grid measurement data contain time, voltage, current, and frequency values measured at each virtual FDR. These values are sent to the server and used for wide- and local-area monitoring.
In particular, the frequency is estimated by DFT filtering and gain compensation based on real and imaginary filtering [10, 11]. The proposed distributed sensor network-based virtual FDR system has advantages in terms of flexibility and expandability, that is; monitoring the power grid using ZigBee-based wireless communication.
2.2. Distributed Sensor Network-Based Real-World Application: Virtual FDR
This section describes a real application into Daejeon and Kwangju, and we evaluate this application to verify the validity of the structure proposed in Section 2.1. The developed application is a virtual FDR system capable of simulating various disturbances using real data, where connecting to an actual power grid is difficult. A wide-area power grid model using EMTP-RV was created for the application of the virtual FDR system, and a wide-area power grid-measurement location was selected considering the degree of difficulty in observing the output data from a modeled power grid. The system was implemented by modeling an actual 345 kV transmission system in the Republic of Korea using EMTP-RV. The average error of the PSS/E voltage data was 0.71%, which indicated that it was modeled properly. The load was modeled as a static load model in PSS/E using the consumed active, reactive, and steady-state power based on the load flow from the peak load in the summer of 2008. In addition, power in the 154 kV grid was modeled as load. The power generated, consumed, and lost in the 154 kV power grid was removed. The full load of the electric power system described above was 54, 647 MVA (54,300 MW and 6,150 MVar), and the gross generation was 57,001 MVA (55,070 MW and 14,713 MVar). The transmission loss was approximately 2% relative to the load of the power station.
To evaluate the transient and steady-state performance, data were collected from Daejeon and Kwangju after simulating the generator and load rejections. By incorporating the gain compensation of the real and imaginary filters during the frequency variation, the frequency estimation algorithm improved the accuracy and thus allowed real-time implementation of the conventional frequency estimation techniques using the DFT filters. Figure 3 shows the power grid monitoring process using the proposed distributed sensor network-based virtual FDR system (Figures 4 and 5). The system provides wide- and local-area power grid monitoring and a simulation mode of error testing. In addition, a port configuration menu for setting the communication of each virtual FDR is also provided. The right side of the monitor view displays the rate of frequency change [12, 13].
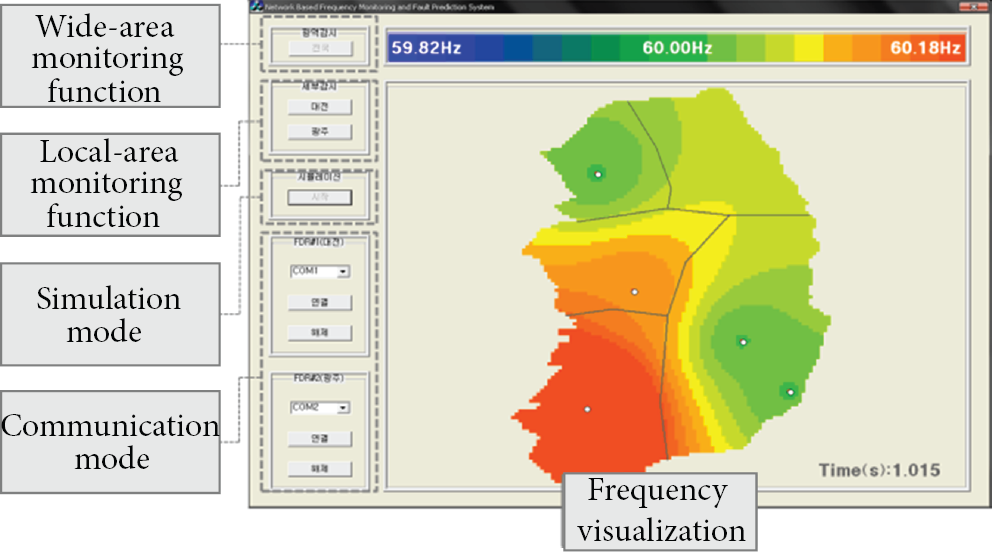
Monitoring using the proposed distributed sensor network-based virtual FDR system.

Developed virtual FDR system.
Distributed sensor network-based virtual FDR system used in the simulation.
The developed virtual FDR system used two virtual FDRs that correspond to Daejeon and Kwangju. The virtual FDR consisted of a GPS module (for synchronization), a ZigBee module (for communication), and an MCU. Three ZigBee modules were used: two for data sending in each virtual FDR and one for data receiving in the server side for monitoring. One GPS module was used in each virtual FDR. GPS synchronization is critical in real-time monitoring of the data sent from each virtual FDR to the server. Failure in the GPS synchronization will reduce the reliability of the wide-area monitoring. On the other hand, a possibility exists that an error will occur because of the delay caused by the multipath of the radio waves and by electromagnetic noise. The GPS used in this virtual FDR system outputs raw data with a 2.5 m maximum precision in an open area, and its maximum update rate is 10 Hz. This section introduces the data parsing using the NMEA protocol analysis for synchronization with the $GPGGA signal cycle received from the GPS.
3. Simulation Results and Discussion
In this section, we present the conducted simulation, which was aimed at measuring the power grid parameters that result from various disturbances under the hypothesis that the FDR is installed in two regions (Daejeon and Kwangju).
3.1. Full-Load Rejection in Shinkwangju
In this section, we present the simulation of a full-load rejection in a power monitoring system based on the proposed virtual FDR. From the simulation result of the full-load rejection that occurred in Shinkwangju using the data measured in Daejeon and Kwangju, we confirmed the change in the frequency, as shown in Figure 6. After checking the effect of the full-load rejection at 2.506 sec, we confirmed that the frequency in Kwangju gradually decreased to less than 60 Hz, which indicated a stable state and was displayed in a dark color. Later, the frequency became extremely unstable at 2.519 sec. The frequency amplitude increased, and the colors in the visual image changed to red and blue, as shown in Figure 6.
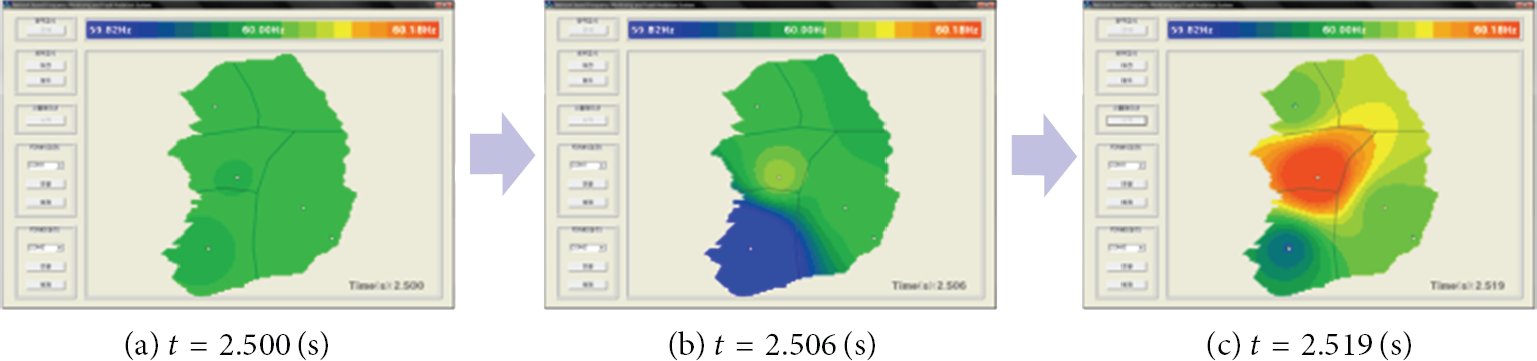
Simulation results of the full-load rejection measured in Daejeon and Kwangju.
Figure 7 shows the measured power grid data for transmission.

Measured voltages and currents and estimated frequencies of the full-load rejection.
This section presents the detection of the disturbance by monitoring the changes in the voltages, currents, and frequencies corresponding to the full-load rejection in Daejeon and Kwangju. From Figure 6, we confirmed that the frequency deviation became greater after 2.500 sec has elapsed, and the colors changed from green (stable state) to red and blue (unstable state). The rates of change in the corresponding voltage, current, and frequency are shown in Figure 7, which shows the voltage, current, and frequency values of the full-load rejection that occurred in Daejeon and Kwangju. These data are obtained from the result of the full-load rejection in Shinkwangju power grid. The disturbance that occurred at 2.5 sec caused a large deviation in the frequency.
3.2. Rejection of Generators 1 and 2 in Yeonggwang
In this section, we present the simulation on the rejection of generators 1 and 2 using the power monitoring system based on the proposed virtual FDR. From the result of the simulation on the full-load rejection that occurred in Yeonggwang using the data measured in Daejeon and Kwangju, we confirmed the change in the frequency, as shown in Figure 8. After checking the effect of the rejection of generators 1 and 2 at 2.506 sec, we confirmed that the frequency in Daejeon and Kwangju gradually decreased to less than 60 Hz, which indicated a stable state and was shown in a dark color. From the frequency visualization image shown in Figure 8, we confirmed that the color changed to deep blue as the frequency significantly decreased at 2.515 sec.

Simulation results for the rejection of generators 1 and 2 measured in Daejeon and Kwangju.
Figure 9 shows the measured power grid data for transmission.

Measured voltages and currents and estimated frequency graphs for the rejection of generators 1 and 2.
This section presents the detection of the disturbance by monitoring the changes in the voltages, currents, and frequencies corresponding to the rejection of generators 1 and 2 in Daejeon and Kwangju. From Figure 8, we confirmed that the frequency deviation became large, and the colors changed from green (stable state) to red and blue (unstable state) after 2.500 sec has elapsed. The rates of change in the corresponding voltage, current, and frequency are shown in Figure 9, which shows the voltage, current, and frequency values in Daejeon and Kwangju when a rejection occurred at N/P generators 1 and 2 in Yeonggwang. The disturbance that occurred at 2.500 sec caused a large deviation in the frequency.
3.3. Double Line-to-Ground Fault between Shinkwangju and Yeonggwang
In this section, we present the simulation on a double line-to-ground fault using power monitoring system based on the proposed virtual FDR. From the result of the simulation on the double line-to-ground fault that occurred in Yeonggwang using the data measured at Daejeon and Kwangju, we confirmed the change in the frequency, as shown in Figure 10. By checking the effect of the double line-to-ground fault at 1.010 sec, we confirmed that the frequency in Daejeon and Kwangju gradually decreased to less than 60 Hz, which indicated a stable state and is marked with a dark color. From the frequency visualization image shown in Figure 10, we confirmed that the color changed to red as the frequency significantly increased later at 1.035 sec.
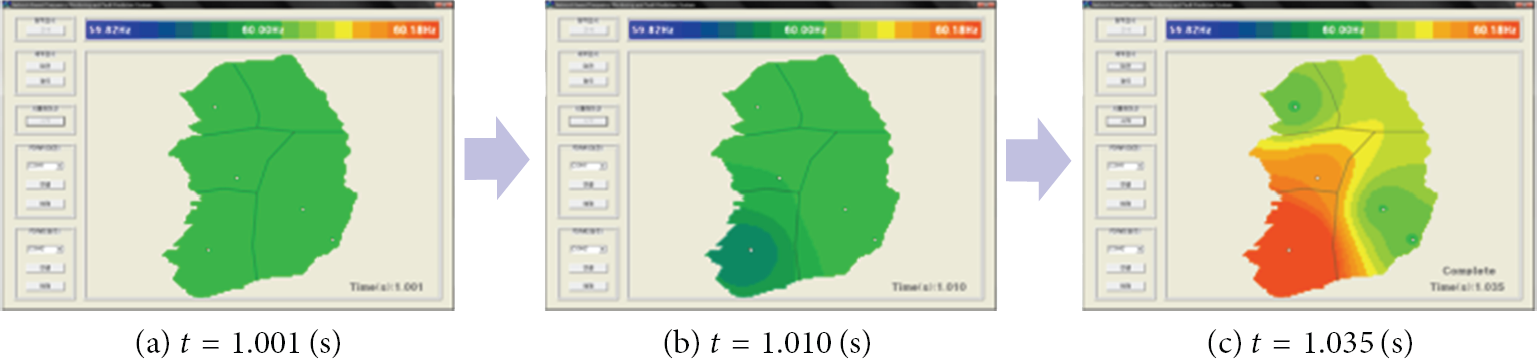
Simulation results for the double line-to-ground fault measured in Daejeon and Kwangju.
Figure 11 shows the measured power grid data for transmission.
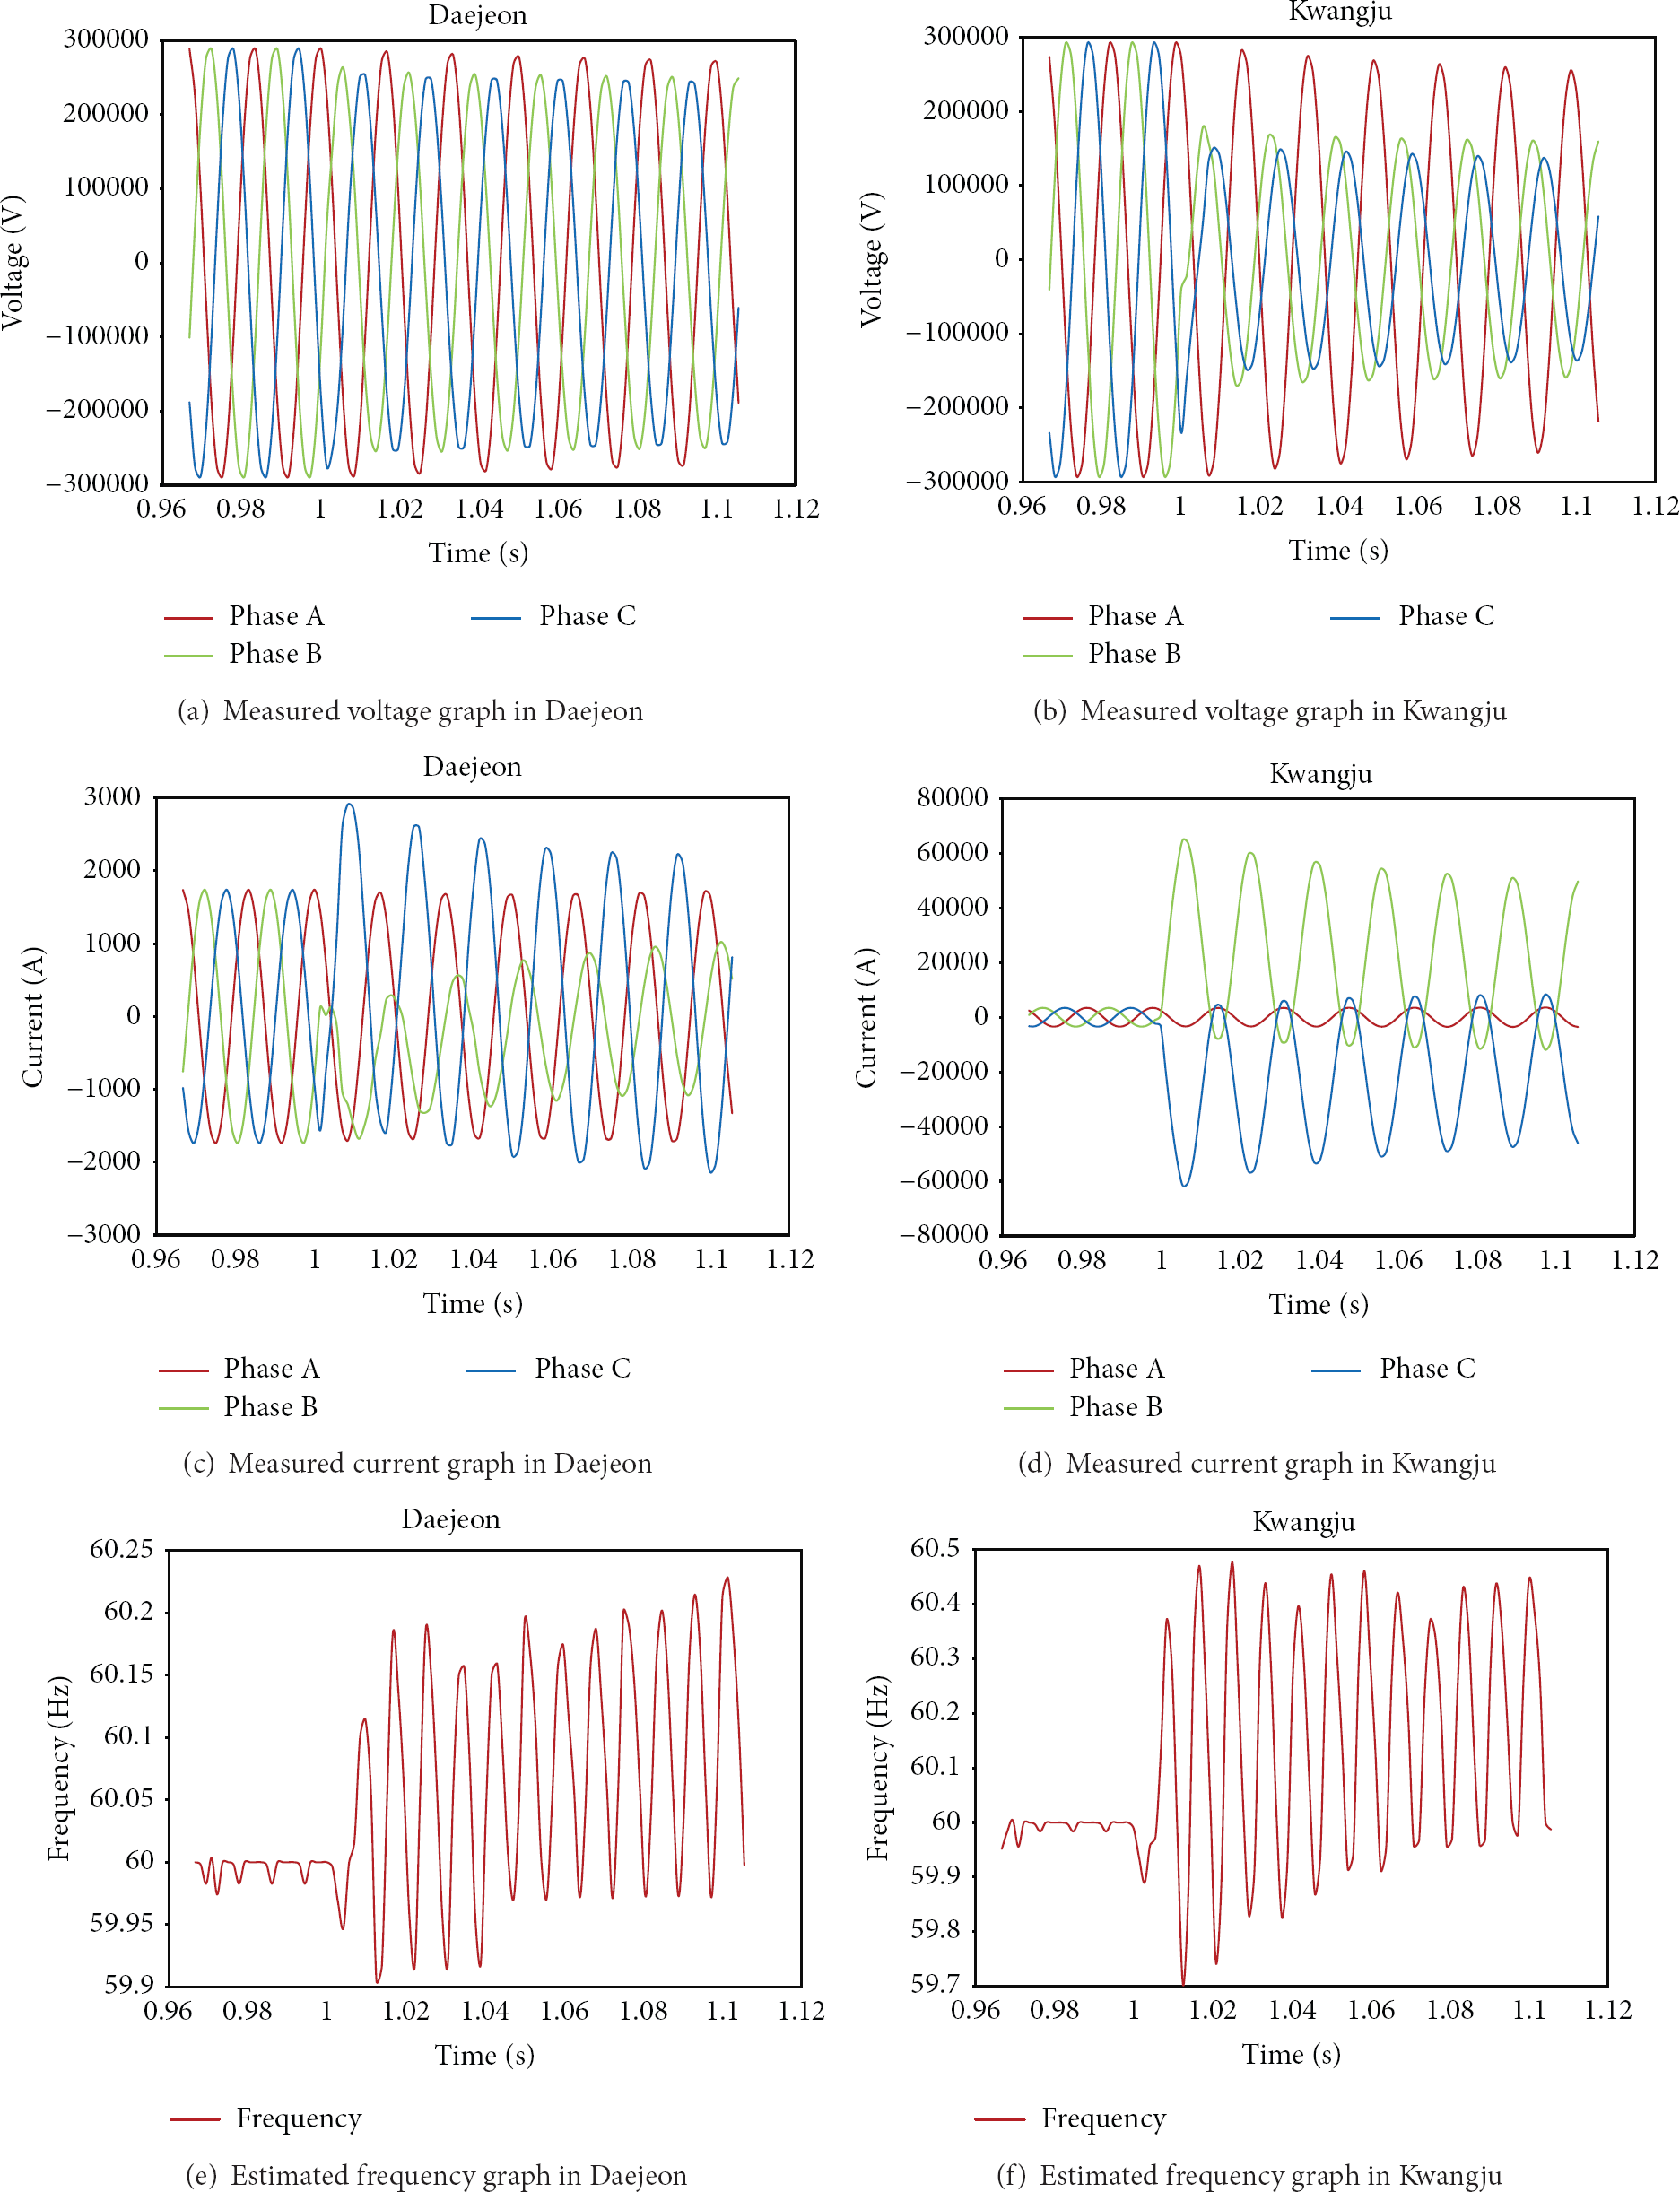
Measured voltages and currents and estimated frequency graphs for the double line-to-ground fault.
This section presents the detection of the disturbance by monitoring the changes in the voltages, currents, and frequencies corresponding to the double line-to-ground fault in Daejeon and Kwangju. As shown in Figure 10, we confirmed that the frequency deviation became larger, and the colors changed from green (stable state) to red and blue (unstable state) after 1 sec has elapsed. The rates of change in the corresponding voltage, current, and frequency are shown in Figure 11, which shows the voltage, current, and frequency values of the double line-to-ground fault that occurred in Daejeon and Kwangju. These data are obtained from the result of the double line-to-ground fault that occurred in the power grid in Cheongwon and Shinjincheon. The disturbance that occurred at 1 sec caused a significant deviation in the frequency.
3.4. Triple Line-to-Ground Fault between Shinkwangju and Yeonggwang
In this section, we present the simulation of a triple line-to-ground fault using a power monitoring system based on the proposed virtual FDR. From the result of the simulation of a triple line-to-ground fault that occurred between Shinkwangju and Yeonggwang using the data measured at Daejeon and Kwangju, we confirmed the change in the frequency, as shown in Figure 12. After checking the effect of the triple line-to-ground fault at 1.004 sec, we confirmed that the frequency in Daejeon and Kwangju gradually increased to more than 60 Hz, which indicated a stable state, and the color changed from green to red. At 1.014 sec, the color in the Daejeon area spread to a darker color owing to the swing phenomenon. At 1.019 sec, the frequencies in all areas except that in Kwangju significantly decreased, and the color changed to a darker one. We confirmed from the visual image shown in Figure 12 that the amplitude at this moment greatly increased.

Simulation results for the triple line-to-ground fault measured in Daejeon and Kwangju.
Figure 13 shows the measured power grid data for transmission.

Measured voltages and currents and estimated frequency graphs for the triple line-to-ground fault.
This section shows the detection of the disturbance by monitoring the changes in the voltages, currents, and frequencies corresponding to the triple line-to-ground fault that occurred in Daejeon and Kwangju. From Figure 12, we confirmed that the frequency deviation became greater, and the colors changed from green (stable state) to red and blue (unstable state) after 1 sec had elapsed. The rates of change in the corresponding voltage, current, and frequency are shown in Figure 13, which shows the voltage, current, and frequency values of the triple line-to-ground fault that occurred in Daejeon and Kwangju. The disturbance that occurred at 1 sec caused a significant deviation in the frequency.
This section has shown that the proposed system can easily detect the unstable state of a power grid by visualizing the status of the frequency diffusion in the developed wide-area monitoring using the frequency visualization algorithm. Furthermore, we have verified the validity of the real-world application by simulating real-power grid data using the proposed distributed sensor network-based virtual FDR system.
4. Conclusions
In this paper, we have proposed an application that can be applied to the real world using distributed sensor networks for electric facility monitoring. We have developed a virtual FDR system for a real-world application that can estimate the frequency from a modeled power grid to wirelessly transfer the information to the server. By monitoring the power grid using ZigBee-based wireless communication, the developed virtual FDR system possesses an advantage in terms of flexibility and expandability. Furthermore, to verify the performance of the proposed application, we constructed a wireless network based on ZigBee and simulated various disturbances using data from two regions (Daejeon and Kwangju). Through the experiments, we were able to verify the real-power grid feasibility of the distributed sensor network-based application for wide-area power grid protection.
Footnotes
Acknowledgments
This work was supported by KESRI (2008T10010013 1) and funded by the Korean Ministry of Knowledge Economy (MKE).