
Abstract
The issue of optimal placement of wireless sensor networks (WSNs) is one of the major challenges for dynamic monitoring of bridges. It should be solved based on combining the effective monitoring of the dynamic performance of a bridge with the energy consumption of WSNs. Thus, the relationship between the bridge modal and the energy consumption of wireless networks is derived. Optimizing sensor location is achieved by using the improved wavelet particle swarm algorithm, which overcomes the disadvantage of the conventional particle swarm algorithm by applying mutation operator to the selected particles with certain small probability. Based on the comparison between the ANSYS simulation results and the measured bridge data, as well as the energy distribution diagram of WSNs, the proposed method is shown to reflect the dynamic performance of the test bridge well. Moreover, the method effectively controls the energy consumption of WSNs and achieves reasonable optimization effects. Therefore, this method can be used for dynamic monitoring of wireless sensors in various bridge types.
1. Introduction
With the rapid development of bridge construction, the safety of the bridges is attracting more and more attention. Once completed and used, the structure or constructional elements of a bridge suffer from continuous degradation, aging of material performance, and external factors. Vehicles, wind, earthquakes, fatigue, overload, and human behaviors are several external factors that damage bridges. Therefore, monitoring and evaluating the physical conditions of bridges to determine their health information are essential. The dynamic monitoring of a bridge structure has become the primary technological means for maintaining the safety of such structures [1–3].
The dynamic monitoring of a bridge structure is based on sensor nodes which collect data on the bridge, such as current structural strains, stresses, and loads. These data are then transmitted to the monitoring center by using a wireless sensor network (WSN). In general, if more sensor nodes are used in a monitoring system, then the structural characteristics of a bridge can be described more accurately. However, because of limits on sensor quantity, economic cost, installation difficulty, and other aspects, the rationality in the number and positioning of sensor node layout is regarded as the premise for guaranteeing quality of structural monitoring [4, 5].
The characteristics of the WSN should also be considered in the actual layout process of its nodes. Excessive sensor nodes will result in oversized transmission data from the WSN. Consequently, an overload in network energy consumption will lead to delayed search speed and poor network stability [6]. Therefore, the optimal layout of sensor nodes is considered as a multiobjective optimization issue based on the aforementioned contents.
Scholars and experts worldwide have studied the optimization issue of sensor layout in bridges. Huang and Zhu considered the maximum nondiagonal elements in a MAC matrix as the objective function and optimized sensor layout according to the contribution of the optional positions of sensors to the MAC matrix [7]. Shan et al. introduced an improved adaptive genetic algorithm for the optimal layout of sensors [8]. Sun et al. adopted classical optimization criteria and the improved genetic algorithm in the form of fitness to obtain optimal layout [9]. Zhang et al. adopted the Pareto genetic algorithm and designed corresponding genetic operators and coding scheme for solving the optimal position of sensors under double criteria [10].
Based on previous researches, sensor layout optimization mainly focuses on a single optimization objective that reflects the static or dynamic characteristics of bridges. Therefore, this paper presents optimal layout conditions of sensor nodes and the optimal conditions of energy consumption of WSNs. This work also established an improved sensor node optimal layout algorithm based on the improved wavelet particle swarm optimization (PSO). The result of the ANSYS simulation analysis was compared with the measured data of the bridge structure. The energy distribution of the WSN was obtained. Lastly, the validity of the optimal layout was verified.
2. Analysis of the Sensor Layout Model for Bridge Monitoring
2.1. Bridge Modal Analysis
Bridge modal analysis is effective in the dynamic monitoring and overall evaluation of the structural state of a bridge [11].
The dynamic equilibrium equation of a bridge can be simplified as
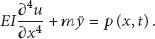
This dynamic equilibrium equation belongs to nonlinear dynamic systems, wherein u represents the dynamic deflection of the beam,

By substituting formula (2) into formula (1) and simplifying the resulting equation, the dynamic response of the beam can be obtained as follows:

The measurement of the dynamic property of a bridge primarily depends on numerous strain gauges. These strain gauges are distributed throughout the bridge space and connected with WSNs. Suppose that


Suppose that

Suppose that
As shown in formulas (4) to (6), the applied force F on the bridge in formula (3) can only be obtained when the strain modal coordinate
The estimate of the optimal strain modal coordinate
2.2. Energy Optimization Analysis of the WSN
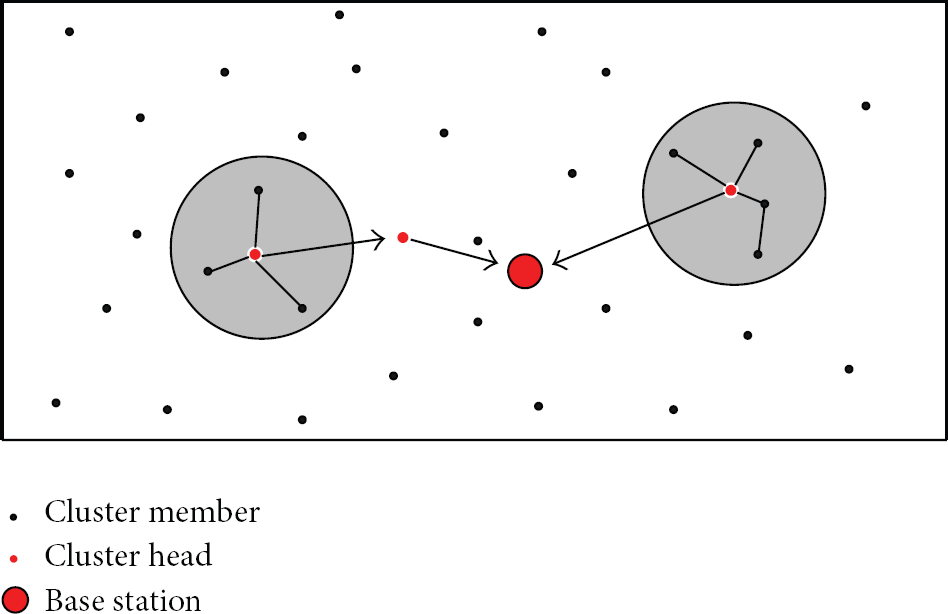
In this research, the dynamic monitoring system of the structural state of the bridge for collecting the dynamic signals of the bridge is based on WSN nodes. Considering the numerous and large-scale network nodes, the entire network is divided into small subnetworks called clusters. The manager of each cluster is called the cluster head. To select the cluster head with proper quantity and optimal position [15, 16], the entire WSN adopts the hierarchical topology establishment method with optimal global energy consumption based on location information. In this manner, the WSN will have a cluster hierarchical topological structure (Figure 1), which can reduce the overall energy consumption of the network and extend its life cycle [17].
Transmission and retransmission of signals.
The following is the description for the computation of the overall energy consumption.
Suppose that L represents the length of the bridge and M represents the width of the bridge. The WSN nodes are randomly distributed in the
Similarly, suppose that
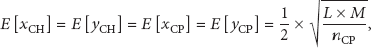

The location of the gateway node is set at (0, 0). Then, the mathematical expectations of the cluster head CH and the gateway node BS at a particular distance are given as follows:

Suppose that the cluster distribution function is as follows:

Then, the mathematical expectations of cluster member nodes CP and cluster head CH on a squared distance are given as follows:

The consumed energy
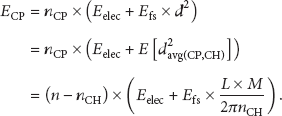

The total energy

As stated earlier, the optimal layout of sensors in bridge monitoring is essentially a multiobjective optimization issue. The number and locations of sensors do not only influence the test accuracy of several-order modals but also affect the energy and data transmission of the WSN. The present study adopts a linear weighting method to design the evaluation function. This weighting method can be described as follows:
3. Optimal Solution of the Layout Based on Wavelet Particle Swarm Algorithm
The wavelet particle swarm algorithm belongs to an intelligent optimization algorithm based on population search which has been developed in recent years. Derived from the simulation of bird population behaviors, this algorithm is simple and easy to perform; moreover, no gradient information is required and fewer parameters are needed. The present work used the improved particle optimization algorithm [19] to obtain optimal solutions.
Suppose that a population consisting of N particles exists in an objective search space of D dimension, where particle i represents the vector of D dimension, as shown in the following:

The flying speed of particle i is expressed as follows:

The optimal position of particle i that has been searched thus far is described as follows:

The optimal position of the entire particle swarm that has been searched thus far is the global extremum, as shown in the following:

Particles update their speeds and positions according to the following:


To improve the performance of the basic PSO algorithm and to avoid premature convergence of the algorithm, the mutation operation in genetic algorithms is added to the former. Hence, an improved PSO algorithm is obtained. Suppose that the mutation probability of each particle is


Based on the preceding analysis, the fitness function is shown in formula (15),

The change in fitness values during evolution.
Based on the relationship between cluster head nodes and member nodes of the aforementioned fitness function, the number of cluster head nodes is confirmed to be 12 and that of sensor nodes is 130. All nodes are discretely distributed throughout an 800 M bridge deck. Several sensor coordinates are shown in Table 1.
The coordinates of several sensors.

4. Simulation and Experimental Analysis
In actual bridge dynamic tests, installing any number of sensor nodes to acquire the dynamic parameters of the entire bridge is not feasible. The acquisition of dynamic parameters is subject to limitation under various conditions. The finite element analysis method can be used to obtain dynamic situations under certain conditions. This research used the finite element software ANSYS to analyze the intrinsic mode of a bridge measuring 800 M long and 10 M wide. The SOLIDE185 was also adopted to establish the model. The elasticity modulus was

The calculation result of dynamic characteristic of bridge: (a) first order, (b) second order, (c) third order, and (d) fourth order.
The test object in this paper is the Xiazhang Highway Bridge in Quzhou. The condition of its underbridge is shown in Figure 4(a). Based on the position relationship between cluster head nodes and cluster member nodes, the positions of 130 sensor nodes and 12 cluster head nodes discretely distributed throughout the 800 M long bridge deck were determined in this study. Free-scale MMA7361 micromechanical acceleration sensors were used to detect vibration data on the aforementioned positions (surface of the underbridge). BX120-100AA strain gauges were placed on these points for the strain test. The specific bounded strain gauge condition is shown in Figure 4(b). The WSN nodes are shown in Figure 4(c). As shown in Figure 4(d), the collection nodes have two functions. One function is used to receive data from the nodes in the network, while another function is used to transmit data to the remote monitoring center by 3G communication network. Figure 4(e) shows the installed network nodes and Figure 4(f) illustrates the interface of data collection. The tested data implemented normalization processing. The cubic-spline method rounding was used for the fitted curve. After comparison with the ANSYS analysis results, the initial four-order modal shape diagram was obtained (Figure 5).

(a) The underbridge condition of the Xiazhang Highway Bridge, (b) strain gauges, (c) WSN nodes, (d) the collection node box, (e) installed network nodes, and (f) the interface of data collection.

Comparison of ANSYS analytical curves with measured experimental data. (a) The first-order mode. (b) The second-order mode. (c) The third-order mode. (d) The fourth-order mode.
The goodness of fit between the ANSYS analysis results and the test results is relatively high, thus indicating that the distribution points have relatively high accuracy. Among the vibration modes, the first two-order vibration modes can accurately reflect the actual vibration mode despite the few measuring points. Orders 3 and 4 vibration modes decrease as the number of measuring points decreases and their goodness of fit becomes poorer. The accuracy test for the higher-order vibration modes requires an increase in the number of sensor nodes.
In the regular operation of each sensor node (with a 250 kbps transmission rate), 1 byte needs 4 μs and the transmission power of the node is 0.0004 W. When the two values are multiplied, 1.6 nJ is obtained. In this manner, the consumed energy of each sensor node per second can be measured. Figure 6 shows the energy consumption diagram of each node. Figure 7 shows the energy distribution diagram.
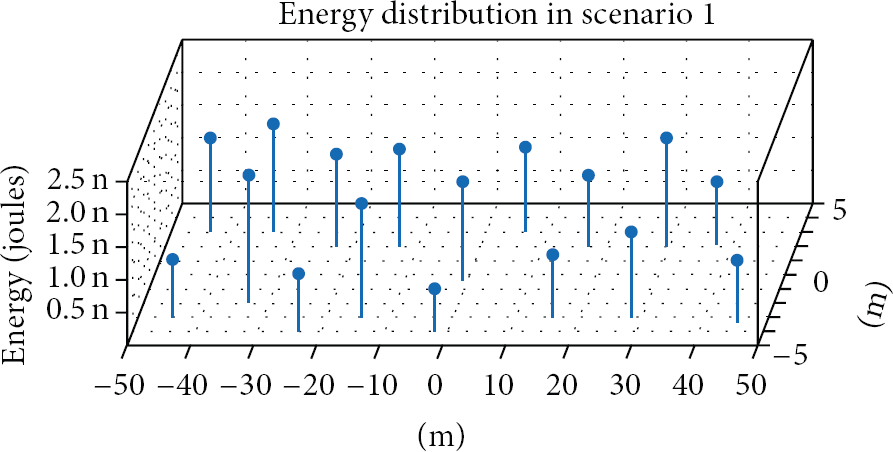
Energy distribution in scenario 1.
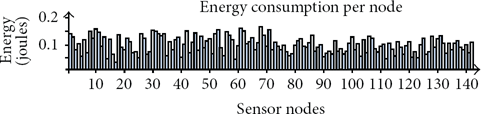
Energy consumption per node.
The relationship between energy consumption and cluster nodes is calculated by formula (15) (Figure 8). According to the fitness function, the number of cluster nodes, that is, 12, is close to the minimum value of the energy consumption curve. This result illustrates the rationalization of the proposed optimization.

Relationship between energy consumption of sensor network and number of cluster head nodes.
Based on formula (6), the change rate of the first 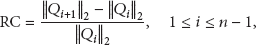

Relationship between RC value and modal number.
5. Conclusion
In this paper, an optimization procedure was put forward and was applied on the dynamic monitoring project of Xiazhang Highway Bridge in Quzhou. The experimental results indicated that the accuracy of the bridge modal measurement could be improved by using a multiobjective optimal layout of sensor nodes. The entire network energy could also be reduced. On the other hand, the improved wavelet particle swarm algorithm improved the convergence rate of the optimization process. However, bridge modal information in an ideal situation was acquired by means of ANSYS simulation. The actual modal data of the bridge must have some deflection with the simulation data. The proposed method has practical value and theory value. It can be analogized to the monitoring issues of WSNs for other types of bridges.
Footnotes
Conflict of Interests
The authors declare that there is no conflict of interests regarding the publication of this paper.
Acknowledgments
This study is financially supported by the Public Welfare Project of the Science and Technology Department of Zhejiang Province (2012C31013), the Teacher Development Project of the Visiting Scholars in Colleges and Universities of the Education Department of Zhejiang Province (FX2012090), and the Faculty Development Fund of Quzhou University (XNZQN201111).