
Abstract
This study proposed a two-dimensional index system which is concerned essentially with urban travel based on travel modes and user satisfaction. First, the public transit was taken as an example to describe the index system establishing process. In consideration of convenience, rapid, reliability, comfort, and safety, a bus service evaluation index system was established. The indicators include the N-minute coverage of bus stops, average travel speed, and fluctuation of travel time between stops and bus load factor which could intuitively describe the characteristics of public transport selected to calculate bus travel indexes. Then, combined with the basic indicators, the calculation models of Convenience Index (CI), Rapid Index (RI), Reliability Index (RBI), and Comfort Index (CTI) were established based on the multisource data of public transit including the real-time bus GPS data and passenger IC card data. Finally, a case study of Beijing bus operation evaluation and analysis was conducted by taking real bus operation data including GPS data and passenger transaction recorder (IC card data). The results showed that the operation condition of the public transit was well reflected and scientifically classified by the bus travel index models.
1. Introduction
The policy of “public transit priority” effectively relieved urban traffic congestion and improved the travel efficiency of residents. Public transport accounts for the maximum proportion of residents travel, but there is still no uniform effective measure to evaluate its service efficiency. The proportion of travelling by public transit had reached 44% in Beijing by the end of 2012 [1]. However, the dynamic information of public transit system currently provided is still insufficient for the bus travelers, operating agencies, and government departments who need more accurate and effective information.
Existing traffic travel information usually put emphasis on conditions of the road network, and released only to the car travelers. There is almost no dynamic information about the public transport provided, and the bus travelers cannot acquire the bus travel speed, comfort, reliability, and other relevant information which is useful for the public transport passengers [2]. In addition, managers who are in charge of public transport operation cannot provide effective methods for diagnosis and optimize the bus routes operation. Furthermore, the lines operation evaluation and analysis still relied on the traditional manual survey. Meanwhile, the government authority for public transport also could not scientifically grasp and assess the service quality of public transit due to the lack of uniform public transport efficiency evaluation indexes.
Previous research on public transit evaluation mainly focused on the evaluation methodologies and index system. However, rare studies have been conducted on comprehensive indexes, and indicators were usually constructed separately from different aspects of the public transport services. Botzow [3] took the city of San Francisco, USA, as a case study in 1974, and put forwarded the public transit evaluation methods and corresponding index system including the average speed, delays, passengers occupy space, and acceleration rate. Alter [4] took the accessibility, travel time, reliability, direct factor, frequency of service, and passenger density as six levels of service quality evaluation to attract the potential passengers in 1976. Flyvbjerg et al. [5] discussed the evaluation method for fixed-line public transportation system, the method divided the total travel time into walking time, waiting time, time on the bus, the transfer time, and potential waiting time. Kopp et al. [6] selected similar indicators with Flyvbjerg, besides the fare rates, and then established a model to evaluate the attractiveness of public transport. Murray et al. [7] discussed methods for evaluating public transport access in 1998, and proposed an indicators system for evaluating the accessibility. Bertini and El-Geneidy [8] proposed a public transport evaluation index system from three aspects of accessibility measures, mobility measures, and economic development. Zhang [9] in 2008 described the level of development of public transport system by using the overall level of facilities, the overall level of operation, and the service quality of bus companies from a macroperspective and running safety, convenience, reliability, ride comfort at micro-level evaluation. Huang et al. [10] established an evaluation index system for small- and medium-sized city's public transportation, which consisted of nine indicators including bus service time, bus service speed, and bus punctuality rate, and so forth.
Previous research on the bus evaluation system mainly focused on the requirement of bus operation evaluation. In 1995, Benn [11] put forwarded five aspects of the multiple bus lines evaluation index from the line network planning, departure time, economic efficiency, accessibility of passenger comfort, and safety. The Transit Capacity and Quality of Service Manual (TCQSM, 2004) [12] divided bus service into fixed-line bus services and demand responded services, and analyzed the factors that affect the quality of service from the views of availability, comfort, and convenience. Ryus et al. [13] analyzed the impact factors of public transit service level, such as service coverage, service frequency, service time, the quantity and quality of pedestrian access to the path of the bus station, and population and residence density. Pei and Xu [14] suggested the indicators for the service level of public transport analysis in 2003, such as buses network density, time punctuality, bus load factor, safe travel mileage of the vehicle, bus station coverage, and nonlinear coefficient. Wang et al. [15] evaluated the reliability of bus service by using the data envelopment method, combined with automatic vehicle location data from three aspects of departure time punctuality percentage, arriving time interval difference percentage, and travel time difference percentage. Sampaio et al. [16] compared the quality and efficiency of several public transport systems from Europe and Brazil, which are determined by a data envelopment analysis (DEA) method based on several factors including the system accessibility, travel time, trustworthiness, frequency, adequate information and support facilities, and so forth.
Being subjected to the lack of dynamic traffic data, the index systems in most studies typically build on the static indicators of the public transport system. Bertini and El-Geneidy [8] extracted some public transit performance measures at four different levels: system level, route level, segment level, and point level, by using the historical data of bus dispatching system. Kuang [17] established the public transit network performance evaluation index system from both the bus-line network layout and operation, and selected eight indicators including bus network density, repetition factor in 2004. Xu and Chen [18] attempted to propose a public transport service level index system suitable for the actual situation in China's city by learning from TCQSM index system in USA; the system contains two levels of lines and networks, and the bus service coverage and convenience indicators at each level were used to reflect the people's bus travel choice process. Li and Hu [19] in 2006 selected 23 indicators including ownership rate of buses, public transit network density, and passenger waiting time from three aspects of facilities, service level, and efficiency, and built hierarchical substructure for urban public transport development evaluation. Yang and Tao [20] proposed a DHGF (Delphi-AHP-Gray Analysis-Fuzzy evaluation comprehensive) algorithm based evaluation method, and established an evaluation index system including the efficiency of vehicles and stops facilities, the development level of public transit information, scheduling and operation of bus, traffic safety, passenger satisfaction, bus corporate profits, environmental and energy saving, and bus utilization ratio.
In conclusion, existing studies on public transit evaluation usually distributed hierarchical index on describing one or several aspects of the public transport services, and it cannot accurately measure the operation condition of the entire public transport system. On one hand, there is still no uniform indicators system on efficiency evaluation of bus travel. On the other hand, the indicators selection usually only considered the application needs of the bus operation, there are still shortcomings during the process of indicator selection. Normally, the selection mainly relies on the static indicators, and the application need of the bus operation is the only concern. Therefore, the existing indexes still did not meet the demands of bus traveler on dynamic information services.
The paper firstly tried to establish a uniform public transport evaluation index system which is subject to a two-dimensional index system of urban travels to monitor different aspects of bus travel. Then, based on the multisource bus data, four bus travel index analysis models were proposed in consideration of convenience, rapid, reliability, comfort, and safety. The models were developed to describe the conditions of public transport operation, and the indexes are also divided into several levels by different performance thresholds. Finally, a case study of Beijing bus operation evaluation and analysis was conducted by taking real operation data of several typical bus lines. The study not only provides a scientific method for the efficiency assessment of the public transport operation, but also provides much more accurate and comprehensive bus travel information for passengers.
2. The Public Transit Travel Index System
The public transit travel index system is the foundation of describing the efficiency and level of public transport service. Moreover, it is also an essential part of the urban travel evaluation index system.
2.1. Two-Dimensional Structure of Urban Travel Index System
According to the multiple travel modes, urban transport system can be divided into public transit (bus and metro), private car, taxi, nonmotorized vehicle, walking, and so on. Additionally, from the views of travelers, the service levels of travel should consider several aspects including the convenience, rapid, reliability, comfort, and safety. Consequently, a two-dimensional index system of urban travel can be established, which considers the travel modes and the service requirements of travelers. The sketch of two-dimensional index system is shown in Figure 1.

Two dimension structure of city traffic system travel indicators.
Regarding specified view of entire city traffic system, the travel indexes could be calculated by weighting the proportion of different travel modes in urban traffic system.
Furthermore, for travel indexes of one certain travel mode, it can be calculated by weighting the subitem evaluation results according to the importance degree of different travel requirements determined by the users' type. Based on multisource dynamic and historical data of public transit, the paper takes the public transit as an example to analyze the travel indexes of different travel views.
2.2. Index Selection for Public Transit Evaluation
In order to describe the features of bus travel scientifically, both the integrity of evaluation system and the data foundation for continuous collection and monitoring should be considered during the process of index selection. In that case, the detailed indicators that the traveler cared for, as well as satisfying the demand of operation, monitor, and decision making of public transit should be included.
Firstly, the study established an initial indexes system from the view of convenience, rapid, reliability, comfort, and safety based on the previous research. Secondly, the study filtered the indicators of which the selected frequency was more than 60% according to the survey gathered from different travelers. Then, a review and evaluation on the importance and applicability of selected indicators was conducted by gathering advices from experts from different institutes or departments including traffic planning, designing, and operation and research. Finally, several key indicators were reserved to establish the final evaluation index system according to the correlation and simplicity of indexes. The flow chart of indexes selection is shown in Figure 2.

Flow chart of evaluation indicator selection.
2.3. Establishment of Public Transit Evaluation Index System
According to the method of index selection, 10 basic indicators were determined to build evaluation index system from the aspect of convenience, effectiveness, reliability, comfort degree, and safety of public transit. The evaluation index system of public transit travel is shown in Table 1.
Evaluation index system of public transit travel.

3. Bus Travel Index Analysis Models
Based on the bus travel evaluation system, four basic indicators were selected from ten basic indicators as shown in Table 1, which included the N-minute coverage of bus stops, average travel speed, fluctuation of running time between stops, and bus load factor, as the key indicators to represent the convenience, rapid, reliability, and comfort degree of bus travel, respectively. It is unnecessary to put safety factor into assessment, because the urban public transit operation usually keeps a high safety performance.
In order to conduct a continuous monitoring and realize the characterization of bus travel indexes from different time-space dimensions, the evaluation indicators should be quantified by applying the multisource data of public transit. These data would include the real-time bus GPS data, IC card data, as well as the bus routes information and bus stops location data extracted from GIS map data. The data requirements of travel index calculation are shown in Table 2.
Data requirements of travel index calculation.

3.1. Convenience Index Analysis Model
The Convenience Index (CI) reflects the availability of the public transit service provided for the bus passengers, which indicates the ease of accessing and using the bus service. Therefore, the higher the distribution density of the bus stops is, the shorter the time that is needed to walk from the bus stop, and the more convenient the passengers will feel. In the study, the calculation of the CI based on the N-minute area and population coverage proportion of the bus stops was at different areas.
3.1.1. The Area and Population Coverage Proportion
N-minute area coverage proportion can be calculated by the ratio of the coverage area of bus stops to the total area of evaluation region, as shown in the following equation:

where AC N is the N-minute area cover proportion of bus stops, A N is the N-minute coverage area of bus stops, and A T is the total area of evaluation region.
According to the ratio of the population that bus stops cover to the total population that the evaluation region possesses, the N-minute population coverage of bus stops could be obtained. It can be described as shown in the following:

where PC N is the coverage proportion of population of bus stops, P N is the N-minute coverage population of bus stops, and P T is the total population of evaluation region.
3.1.2. CI Calculation Model
The CI model integrated the area and population coverage proportion of bus stops. The range of CI value is between 0 and 10. And the smaller the value indicated is, the higher the coverage proportion of public transit service would be which means it is more convenient for bus travels. The CI can be calculated in the following equation:
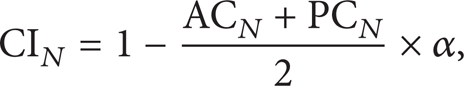
where CI N is the N-minute Convenience Index, AC N is the N-minute area coverage proportion of bus stops, PC N is the N-minute population coverage proportion of bus stops, and α is coefficient of model.
3.2. Rapid Index Analysis Model
The Rapid Index (RI) reflects the rapid degree of buses transporting passengers. According to the average travel speed between stops, it could be measured by taking the effect of congestion mileage and congestion time for a complete bus operation into consideration. However, the higher index value means that the bus route has a worse performance on speed, and the efficiency of passenger transporting is lower.
3.2.1. Bus Travel Speed Estimation
Bus travel speed estimation model takes the interval of adjacent bus stops as a basic processing unit. Combined with the buses GPS data and bus network fundamental data, bus travel speed could be extracted. According to different road classes, the travel speed could be classified into different grades separately, as shown in Table 3.
Bus travel speed rating criterion for different class roads (km/h).

Note: if one certain road section includes different road classes, the final class of the section is subject to the road class which occupied the larger proportion.
3.2.2. Rapid Index Calculation Models
The rapid degree of travel depends on the congestion level of the bus route within a complete operation. Therefore, it is necessary to confirm the route congestion state by deciding the operation rating in process of calculating the Rapid Index based on bus travel speed between stops. Consequently, the study attempted to choose both congestion length proportion (PLX) and congestion time proportion (PTX) to calculate the rapid degree of public transport.
The congestion length proportion (PLX) of bus line refers to the proportion that the entire route mileage of a bus line is divided by the length of road under congestion state. Based on the bus travel speed, if a road section result is equal to or worse than level 3 shown in Table 3, it would be regarded as congestion state. The equation of congestion length proportion is listed as follows:

where PLX is congestion length proportion, LX i is the length of congested road sections in level i, i = 3, 4, 5, L is the length of the entire route, and a, b, c are weight coefficients.
The congestion time proportion (PTX) of bus travel is the ratio of congestion time to the whole running time of an operating shift. The equation is as follows:

where PTX is congestion time proportion, TX i is the time cost on road sections at speed level i, i = 3, 4, 5, T is the total running time, and a, b, c are weight coefficients
The bus line RI can be calculated based on the PLX and PTX, and the computation model of the bus line RI is shown in (6). Here, the coefficient θ can be determined according to the importance degree of various applications, and the range of RI values is 0–10 as a standardized value by using the normalization constant α. Consider the following:

where RI X is the bus line Rapid Index, θ is the specified coefficient, and α is normalization constant.
The bus line RI could be taken as foundation to calculate the RI of bus network which could describe the rapid degree of the whole public transport network. The paper takes passenger kilometers (PKT) as weights. The line which has more passengers and longer distance in operation is expected to be given a bigger weight value. Then, the RI of bus network can be weighted and computed basing on all bus lines RI in the network.
3.3. Reliability Index Analysis Model
The Reliability Index (RBI) reflects an ability of the bus operation to adhere to the headway between successive buses at each stop within a given time period. In other words, it means the passengers could arrive at destination on a fixed time. The bigger fluctuation of headway at stop level means that the larger variation of running time between stops, and means unevenness headway and the worse on-time performance of bus operation.
3.3.1. Reliability Index at Stop Level
Firstly, the study assumes that the T
ij
is the actual travel time that a bus runs from stop i to stop j and defines the

where Pro
ij
is the probabilities of the buses travel time between stop i to stop j which have a bigger deviation ratio than E%, T
ij
is the actual travel time that a bus running from stop i to stop j,
Additionally, considering the deviation distribution of all samples would impact the RBI calculation, the study introduced the Coefficient of Variation (CV) of travel time between stops to make a reduction on reliability of buses operation. Here, the calculation model of CV ij is shown as follows:
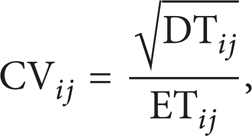
where CV
ij
is coefficient of variation,
Finally, considering both the probability of the unreliable buses travel time in all samples and the CV ij based reduction, we proposed that the Reliability Index (RBI) of bus stops can be calculated by (9) with a value range of 0 ∼ 10. Consider the following:
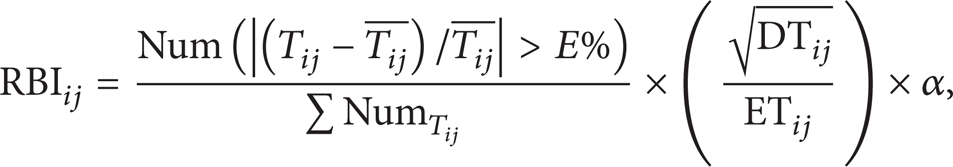
where RBI ij is Reliability Index between stops and α is normalization constant of model.
3.3.2. Reliability Index at Route Level
Route-based Reliability Index (RBI) described the reliability performance of a bus operation at the route level, which could help passengers make a decision for choosing bus lines. RBI at route level can be calculated by weighting RBI of bus stops based on passenger kilometers (PKT).
3.4. Comfort Index Analysis Model
The Comfort Index (CTI) reflects the crowding degree of passenger on bus, and it is based on the space occupancy of bus rated capacity which can be expressed as a load factor. The higher load factor indicated that the passengers feel more uncomfortable.
3.4.1. Load Factor Calculation
Based on the results of bus IC card data processing, the passenger flow volume between stops can be worked out by adopting the cluster analysis method and volume extraction model [21]. Then, the Rated Capacity (RC) could be obtained by summing the passenger capacity of all vehicles that passed through the same interval between stops. The Load Factor (LF) means the ratio of the Passenger Flow Volume (PFV) to the Rated Capacity (RC). The LF is calculated as follows

where LF ij is the load factor between stop i to stop j, PFV ijx is the passenger flow volume between stop i to j of vehicle x, RC x is the rated capacity of vehicle x, and n is the number of vehicles passing through the stop j in given time period.
3.4.2. Bus Line Comfort Index
Based on Load Factor (LF) between stops, the Comfort Index (CTI) model could be established. And the CTI can be described both at stop level and route level. The CTI at stop level could be calculated by the following:

where CTI S is the Comfort Index at stop level, LF ij is the load factor between stop i to stop j, and α is normalization constant of model, the default value could be 10.
The study takes passenger kilometers (PKT) as weight value. The stop sections which are responsible for more passengers and longer distances are expected to have bigger weight value. Then the CTI of bus line can be weighted averaged base on CTI at stop level. Consider the following:

where CTI R is the Comfort Index at route level, W i is the weight value of between stop i to stop i + 1, CTI Si is the Comfort Index of section between stop i to stop i + 1, and N is the number of bus stops for certain line.
3.5. Classifications of Bus Travel Indexes
In order to evaluate the bus operation state intuitively, the study conducted a performance based level division, as shown in Table 4. For each travel index, it could be classified into five evaluation grades separately. In practical application, we can not only evaluate a specific performance by using any of the travel indexes directly, but also can define the weight value of each travel index to achieve a comprehensive evaluation level for assessment according to the demand of different users. When the evaluation grade is at level D or level E, it indicates that the condition of bus operation is poor or rather bad, and it is necessary to improve public transit service and provide more effective measures for passengers.
The level division of different bus travel indexes.
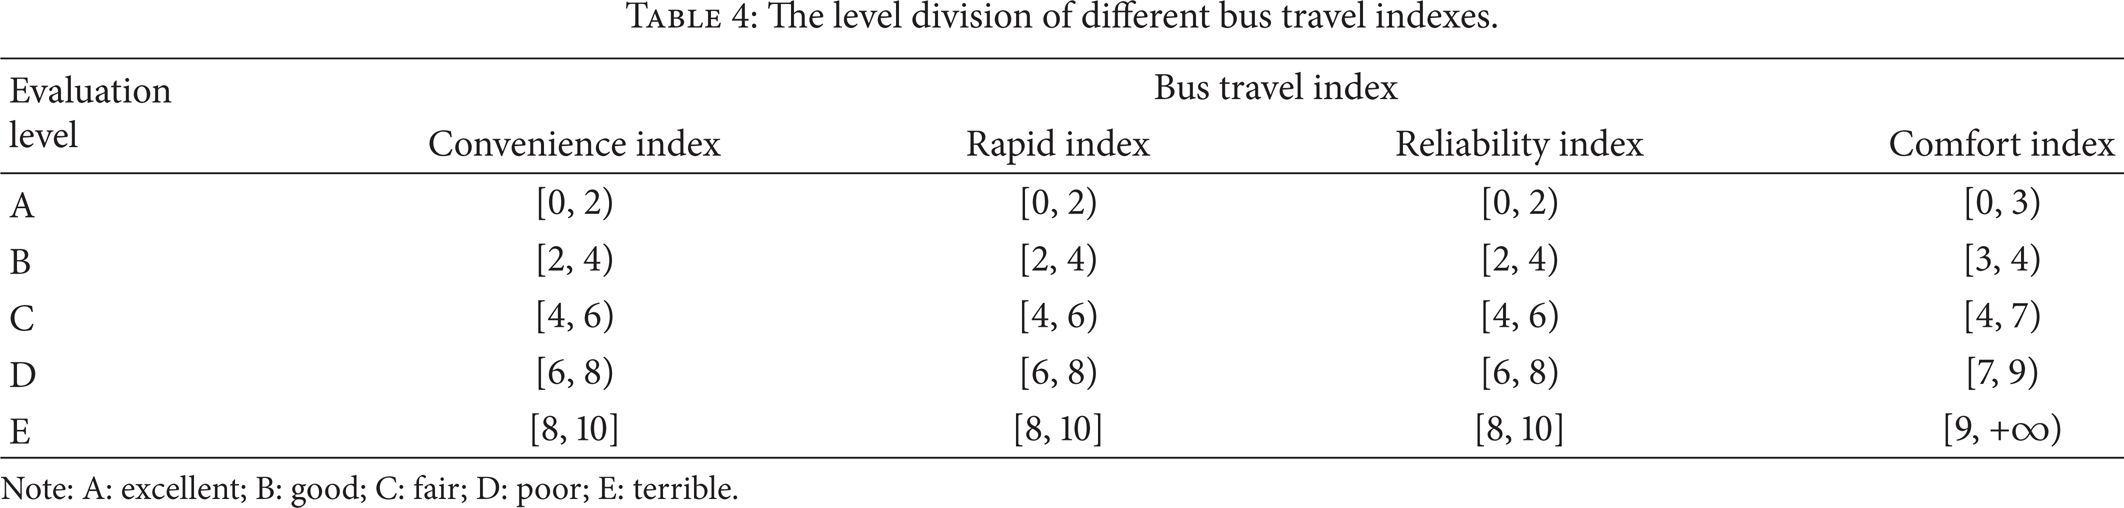
Note: A: excellent; B: good; C: fair; D: poor; E: terrible.
4. Applications of Bus Travel Index Analysis Models
The improvement of Beijing's public transport infrastructure and dynamic operation data collection techniques provide a high-quality data foundation for bus travel index analysis. Consecutive monitoring and evaluation of bus travel index can be achieved by utilizing the multisource data and analysis models proposed.
4.1. Bus Convenience Index
According to the evaluation requirements, the CI of any district could be analyzed. In this study, the area inside the Fifth Ring Road is taken as a demonstration. It is divided into four regions by ring roads: area inside the Second Ring Road, area between the Second and Third Ring Road, area between the Third and Fourth Ring Road, area between the Fourth and Fifth Ring Roads. For example, the 5-min bus CI can be calculated by 5-min area coverage, and 5-min population coverage of bus stops. The result is listed in Table 5.
Public transit Convenient Index (5 min) of the different regions.
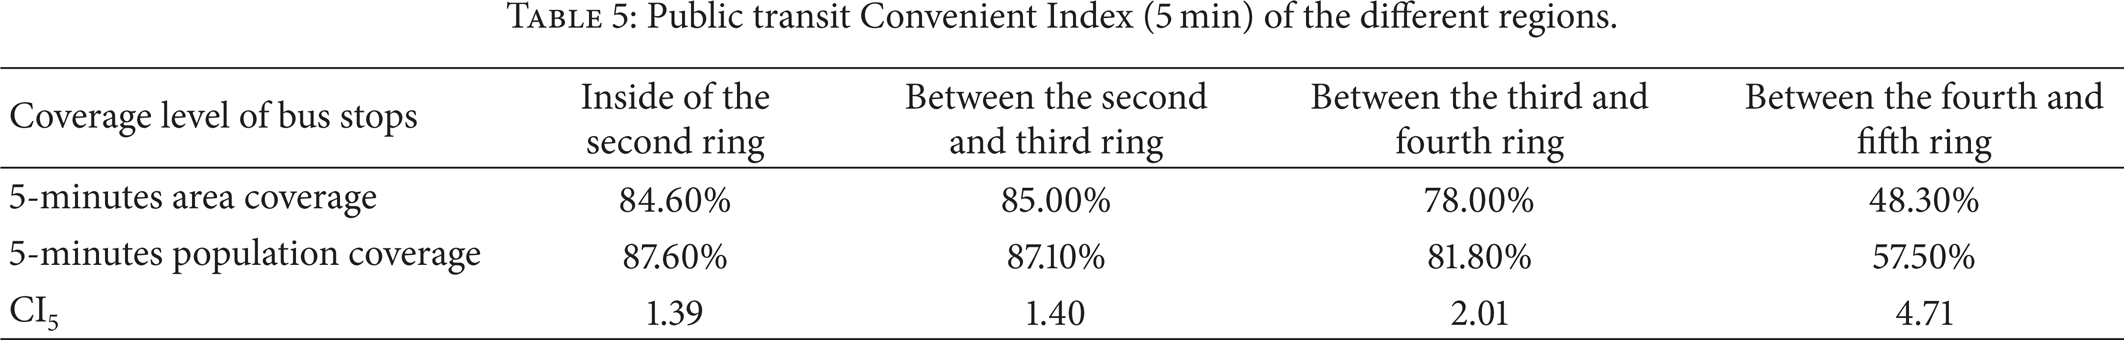
From the results, the CI of the regions inside the Fourth Ring Road is higher than that of the region outside the fourth ring roads, which indicates that bus travels in downtown area are more convenient, and bus stop coverage level between the fourth and fifth ring roads still needs to be improved.
4.2. Bus Rapid Index
The real-time bus GPS data collected from Beijing was applied to calculate the bus line RI and network RI separately to describe the efficiency of certain bus line of bus network. The RI results on weekdays and weekends are listed in Figure 3, as a contrastive analysis.
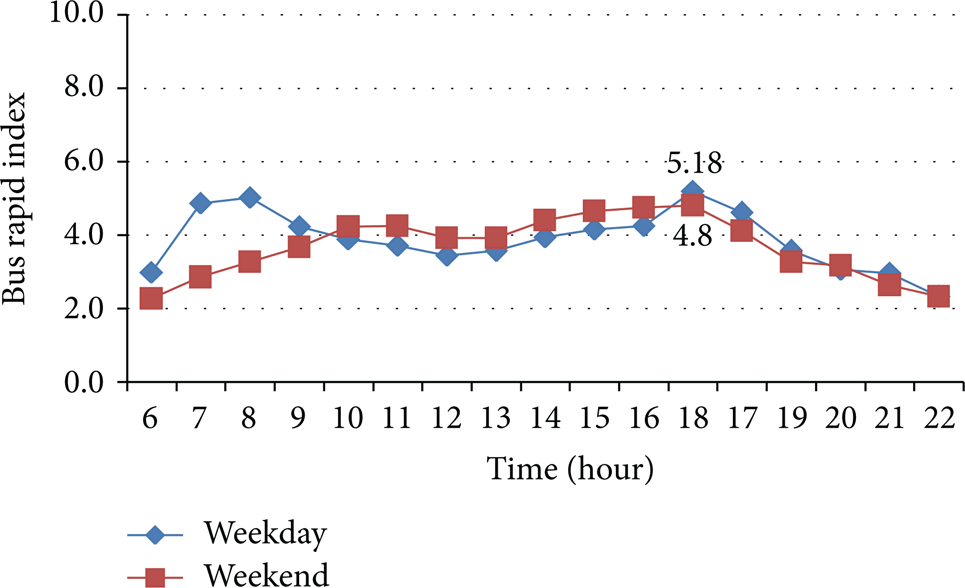
Hourly variation curves of bus network RI (Sun., Nov. 18, 2012 and Mon., Nov. 19, 2012).
As shown in Figure 3, the bus network RI has an obviously increment during the peak hours on weekdays, and the operation status reaches the fair rapid level, compared to the good level during the off-peak periods. And on the weekends, the morning peak is later and gentler than on weekdays, while the evening peak periods are slightly earlier than on weekdays, which complied with the residents' travel.
The bus line RI can also reflect the differences in rapid degree between different bus lines. The paper takes bus line 707, line 658, and line 13 as the examples to illustrate the characteristics of bus lines RI. The results are shown in Figure 4.

Hourly variation curves of different bus lines RI (Beijing, May 29, 2012).
It is obvious that the RI of line 13 is much bigger than the others which means that operation condition is the worst among the three lines. That is because line 13 mainly runs on minor arterial roads or branches which have very complex traffic composition. It also indicated that the RI of bus lines operating in different class roads presents relatively obvious regularity: minor arterial roads and branches > major arterial roads > expressway.
4.3. Bus Reliability Index
The RBI of different bus lines is various. The study calculated the RBI of bus line 300, line 52, line 1, and line 8 which mainly operate on the expressway, arterial roads, minor roads and branches, respectively. The result is shown in Figure 5.

Hourly variation curves of different bus lines RBI.
As for time distribution, during early morning and night, the RBI is a little high since the travel time is much more stochastic under low traffic volume condition. Furthermore, during the morning and evening peak hours, unexpected congestion of road usually leads to an obvious fluctuation of travel time and the RBI increases accordingly. However, the RBI is stable in other hours of the day, which indicate that the travel time would be much more reliable.
From the view of different class roads, the RBI of bus line 300 operating on the expressway is the lowest, which means this line is the most reliable. While the RBI of bus line 8 operating on secondary arterial roads is the highest. So, it can be seen that the RBI of bus lines have strong relation with the road classes, and the higher class roads usually have lower RBI due to more reliable bus travel time.
4.4. Bus Comfort Index
The study took the load factor of every stop section of bus line 486 during 8:00-9:00 a.m. as the sample to calculate CTI between bus stops. The original IC card data reordered the passengers' transaction information including the boarding and alighting time which were used. The result is shown in Figure 6.

Variation of bus line 486 CTI for adjacent bus stops.
As displayed in Figure 6, the CTI of the origin stop is at the level of very comfortable. With the bus running, the CTI increased gradually at the following sections. When the bus arrived at stop 9, the CTI decreased significantly because of the amount of passengers alight to transfer subway. On the contrary, at next stop 10, a large number of passengers get on the bus transferred from subway which made the CTI increase significantly to the maximum 7.01, and it should be The forth level of service under poor comfort, and the section following the stop 10 also is regarded as the peak section of line 486 at that time period.
5. Conclusions
The paper proposed a two-dimensional evaluation index system of urban travel, and built a uniform public transport travel indicator system by considering convenience, rapid, reliability, comfort, and safety of bus travel. Based on the multisource public transit data including the GPS location data, passenger IC card transaction data, as well as the basic indicators of the index system; the study established multidimensional analysis models of Convenience Index (CI), Rapid Index (RI), Reliability Index (RBI), and Comfort Index (CTI) for public transportation. Finally, by using the dynamic bus operation data in Beijing, the paper verified the applicability of travel index models assessment and characteristic reflection of the public transportation system.
The case study shows that the public transport indexes proposed in the paper can intuitively describe the characteristics and service level of public transport travel. It can be applied to the routine operation monitoring of urban public transit, and provide effective tool for diagnosing and optimizing the bus network and bus lines layout. It also could improve the public transit service levels, and increase the attractiveness of public transit if the real-time information can be provided to the bus travelers.
The optimization and parameters modified test of public transit index calculation models could be implemented in the future to continuously improve the stability and accuracy of bus operation monitoring and evaluation.
Conflict of Interests
The authors declare that there is no conflict of interests regarding the publication of this paper.
Footnotes
Acknowledgment
The research was supported in part by the Ministry of Industry and Information Technology of China under the Major Program of national science and technology with no. 2013ZX01045003-002. The authors would like to show their great appreciation for that support.