
Abstract
Indoor localization based on the received signal strength (RSS) values of the wireless sensors has recently received a lot of attention. However, due to the interference of other wireless devices and human activities, the RSS value varies significantly over different times. This hinders exact location prediction using RSS values. In this paper, we propose three methods to counter the adverse effect of the RSS value variation on location prediction. First, we propose to use an index location to select the best radio map, among several preconstructed radio maps, for online location prediction. Second, for an observed value of the signal strength of a sensor, we record, respectively, the distances from the sensor to the nearest location and the farthest location where the signal strength value has been observed. The minimal and maximal (min-max) distances for each signal strength value of a sensor are then used to reduce the search space in online location prediction. Third, a location-dependent received signal strength vector, called the RSS signature, is used to predict the location of a user. We have built a system, called the region-point system, based on the proposed three methods. The experimental results show that the region-point system offers less mean position error compared to the existing methods, namely, RADAR, TREE, and CaDet. Furthermore, the index location method correctly selects the best radio map for online location prediction, and the min-max distance method promotes the prediction accuracy of RADAR by restricting the search space of RADAR in location prediction.
1. Introduction
Indoor localization is important for many real-life applications. For example, it gives the location context of a context-aware system that provides proper settings of the system based on the location, activity, and physiology of the user and the environmental context information [1]. Recently, indoor navigation applications, which require an exact indoor location, are becoming a very popular research area [2]. Due to the increasing need for indoor localization, many indoor localization techniques have been proposed. An indoor localization method can be categorized as a range-based or a range-free method [3]. While point-to-point distance information is required for a range-based method, it is not required for a range-free method. The techniques for estimating the distance between two communication nodes include the time of arrival (TOA) [4], time difference of arrival (TDOA) [5], and the angle of arrival (AOA) [6]. The TOA technique uses the radio signal propagation time to estimate the distance. The TDOA technique utilizes two radio signals with different propagation speeds and estimates the distance between the two communication nodes by measuring the difference between the arrival times of the two signals. Unlike TOA and TDOA, AOA technique measures the angle at which a signal arrives. It can be used to complement TDOA or TOA in location calculation [3]. Indoor localization methods that use range information usually achieve high accuracy in location estimation. For example, the Cricket [7] indoor localization system of MIT reported the error of 1 to 3 centimeters in position estimation. Despite being accurate in location prediction, the range-based localization techniques require large scale deployment and costly devices.
The range-free location prediction techniques have received a lot of attention recently. The well-known range-free location prediction methods include RADAR [8] and the probability-based methods [9–12]. RADAR is developed by Microsoft. In RADAR, for a predefined set of training locations, the received signal strength (RSS) values from several IEEE 802.11 access points are recorded in a database, called the radio map. To estimate the position of a user, the RSS values from the access points are collected at the location of the user. Afterwards, RADAR performs pattern matching of the collected RSS values against the RSS values in the radio map to find a fixed number of locations with the most similar RSS values against those of the user. Finally, the positions with the most similar RSS values are averaged to give the estimated position of the user. The probability-based methods also use the RSS values for location prediction. However, instead of a fixed number of locations for prediction, the probability-based methods use the Bayes theorem to predict the location of the user by finding the location where the collected RSS values of the user can be observed with the highest probability. In [13], the authors proposed to learn, at time
The most difficult problem for the range-free methods in location prediction is that the offline constructed radio map may not be suitable for online location prediction. The variation of the received signal strength values may outdate the radio map when an online location prediction is required. In this paper, we propose three methods to counter the adverse effect of the variation of the received signal strength values on location prediction. First, we propose to construct several radio maps over different nonoverlapping time intervals and use an index location to select the best radio map for online location prediction. Second, for an RSS value of a sensor observed in the location prediction area, we propose to record the minimal and the maximal (min-max) distance from the sensor to the locations where the same RSS value has been observed. The min-max distance information is used to reduce the number of locations required to be searched for in online location prediction. Thirdly, we propose to use a location-dependent received signal strength vector, called the RSS location signature, for pattern matching in online location prediction. A system, called the region-point system, which implemented the three proposed methods, has been implemented. The experimental results show that the region-point system offers less position prediction error compared to the existing methods, including RADAR, TREE, and CADet. Furthermore, the experiment also shows that the index location method correctly selects the best radio map for location prediction, and the min-max distance method significantly reduces the position prediction error of RADAR. The rest of this paper is organized as follows. In Section 2, we describe the phenomenon of the variation of the received signal strength values. In Section 3, we present the details of the region-point localization system. In Section 4, we present the experimental results. In Section 5, we give a discussion of the experimental result. Finally, in Section 6, we give the conclusion of this paper.
2. Variation of the Received Signal Strength
The most challenging problem for location prediction using RSS values is that the RSS values of a sensor observed at a fixed location change over different times [12–14, 16]. In this paper, we use the MPR2400CA sensor, a ZigBee-based sensor called Mote, to show the phenomenon of RSS value variation over different times. The Mote uses the RF frequency band of 2.4–2.4835 GHz for communication. The 2.4 GHz band frequency is a very noisy band since the wireless local area network (802.11b and 802.11g), the Bluetooth personal area network (802.15.1), and the industrial, scientific, and medical (ISM) devices are all using this unlicensed frequency band. The interference from other networks or devices forces the received signal strength value of a sensor at a fixed location to vary significantly over different times. Furthermore, the unpredictable people moving and door opening or closing cause the changes in the reflection, absorption, diffraction and scattering of the RSS values amplify the variation of the RSS values in an indoor environment [13].
To show the variation of RSS values over different times, we collected 500 RSS values from a fixed location which is 84.85 centimeters away from a ZigBee sensor for a time interval of 4 consecutive hours. Figure 1(a) shows the distribution of the RSS values from 10 a.m. to 2 p.m., while Figure 1(b) shows the distribution of the RSS values from 3 p.m. to 7 p.m. These figures show that not only the shapes of the distributions but also the averages of the signal strength values in different time intervals are different. The variation of the RSS values over different times implies that the RSS values collected at the offline training phase may not be good for online location prediction [13].

Distributions of the signal strength values.
3. The Region-Point Location Prediction System
In this section, we present the implementation of a robust sensor prediction system which considers the variation of the RSS values.
3.1. The Components and Layout of the System
The components and the layout of the system are shown in Figure 2. The system is implemented in a classroom measuring 9.3 m × 13 m. There are three rows of tables with a desktop on each table. There are two doors and one electronic podium in the room. We placed ten Mote sensors, denoted by M in Figure 2, as the reference sensors.

The components and layout of the system.
A sensor, denoted by U, is mounted on a moving cart for testing the location prediction algorithm. To predict the location of a user, the sensor U (stands for the user) broadcasts a packet to the reference sensors. Upon receiving the packet from U, a reference sensor records the RSS value of its received packet, stores the RSS value in a new packet, and then sends the new packet to the location prediction computer, denoted by C in Figure 2, to predict the location of U.
3.2. Architecture of the System
Figure 3 shows the architecture of the region-point location prediction system. It contains the offline training phase and the online location prediction phase. The offline training phase contains the following steps.
For different time periods, collect the RSS values of the reference sensors for each training location and store the RSS values in the radio maps. Create a min-max distance table for each radio map. Find the index location for radio map selection.

Architecture of the region-point location prediction system.
The online location prediction phase contains the following steps.
Collect a number of RSS values at the index location. Select the best radio map for online location prediction. At the location that needs to be localized, collect the RSS values from the reference sensors; find the region for location prediction using the RSS values and the min-max distance table. Find the position of the predicted location in the selected region using the RSS signature of the collected RSS values.
The details of each step are discussed in the following.
3.3. Radio Map Construction
During the offline phase, we choose a number of different time intervals and construct a radio map for each time interval. A set of training locations denoted by
An example of the radio map of the system.

3.4. The Min-Max Distance Table
Due to the variation of the RSS values, a reference sensor may observe different RSS values from the localization sensor U when U is fixed at a specific location. Similarly, the same RSS value observed by a reference sensor may be from different packets transmitted by U at different locations. For example, the RSS value −29 dbm of sensor
The min-max distance table.

The min-max distance table is used to reduce the search region of locations during the online location prediction phase.
3.5. The Index Location
As noted in [13], the radio map constructed in the training phase may not be suitable for online location prediction. We propose to use several radio maps for location prediction. Assume that the set of time intervals is
Let 
The index location
During the online localization phase, we collect five received signal strength vectors at the index location. Take the average of the signal strength vectors, and then use the average RSS vector to select the best radio map for online location prediction. Assume that the average RSS vector is 
That is, we choose the radio map which minimizes the Manhattan distance against the online average RSS vector at location
3.6. The RSS Location Signature
While the probability-based methods use the original radio map, as shown in Table 1, for location prediction, we propose to use a refined variant of the RSS vectors, called RSS signatures, for location prediction. An RSS signature of a location is a distinctive RSS representative for the location. Let 
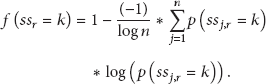
The third and fourth terms of (4) together represent the entropy of location distribution of RSS value k of sensor r over different locations. The second term is used to normalize the entropy value to the interval (0,1). The maximal value of the entropy function occurs when value k of sensor r is evenly distributed over n locations. In this case, value k of sensor r does not have any discernability to distinguish between different locations. The higher the skewness of the location distribution is, the smaller the normalized entropy is. The normalized entropy value equals zero if the RSS value k of sensor r can only be observed at a single location. Therefore, the discernability factor of an RSS value k of a sensor r is a measure of the ability to distinguish between different locations in the system. Note that n in (4) is the number of locations in the system.
Having defined the discernability factor, we define the weight of an RSS value k of sensor r at location 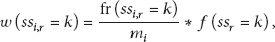
For location
The RSS location signature table.

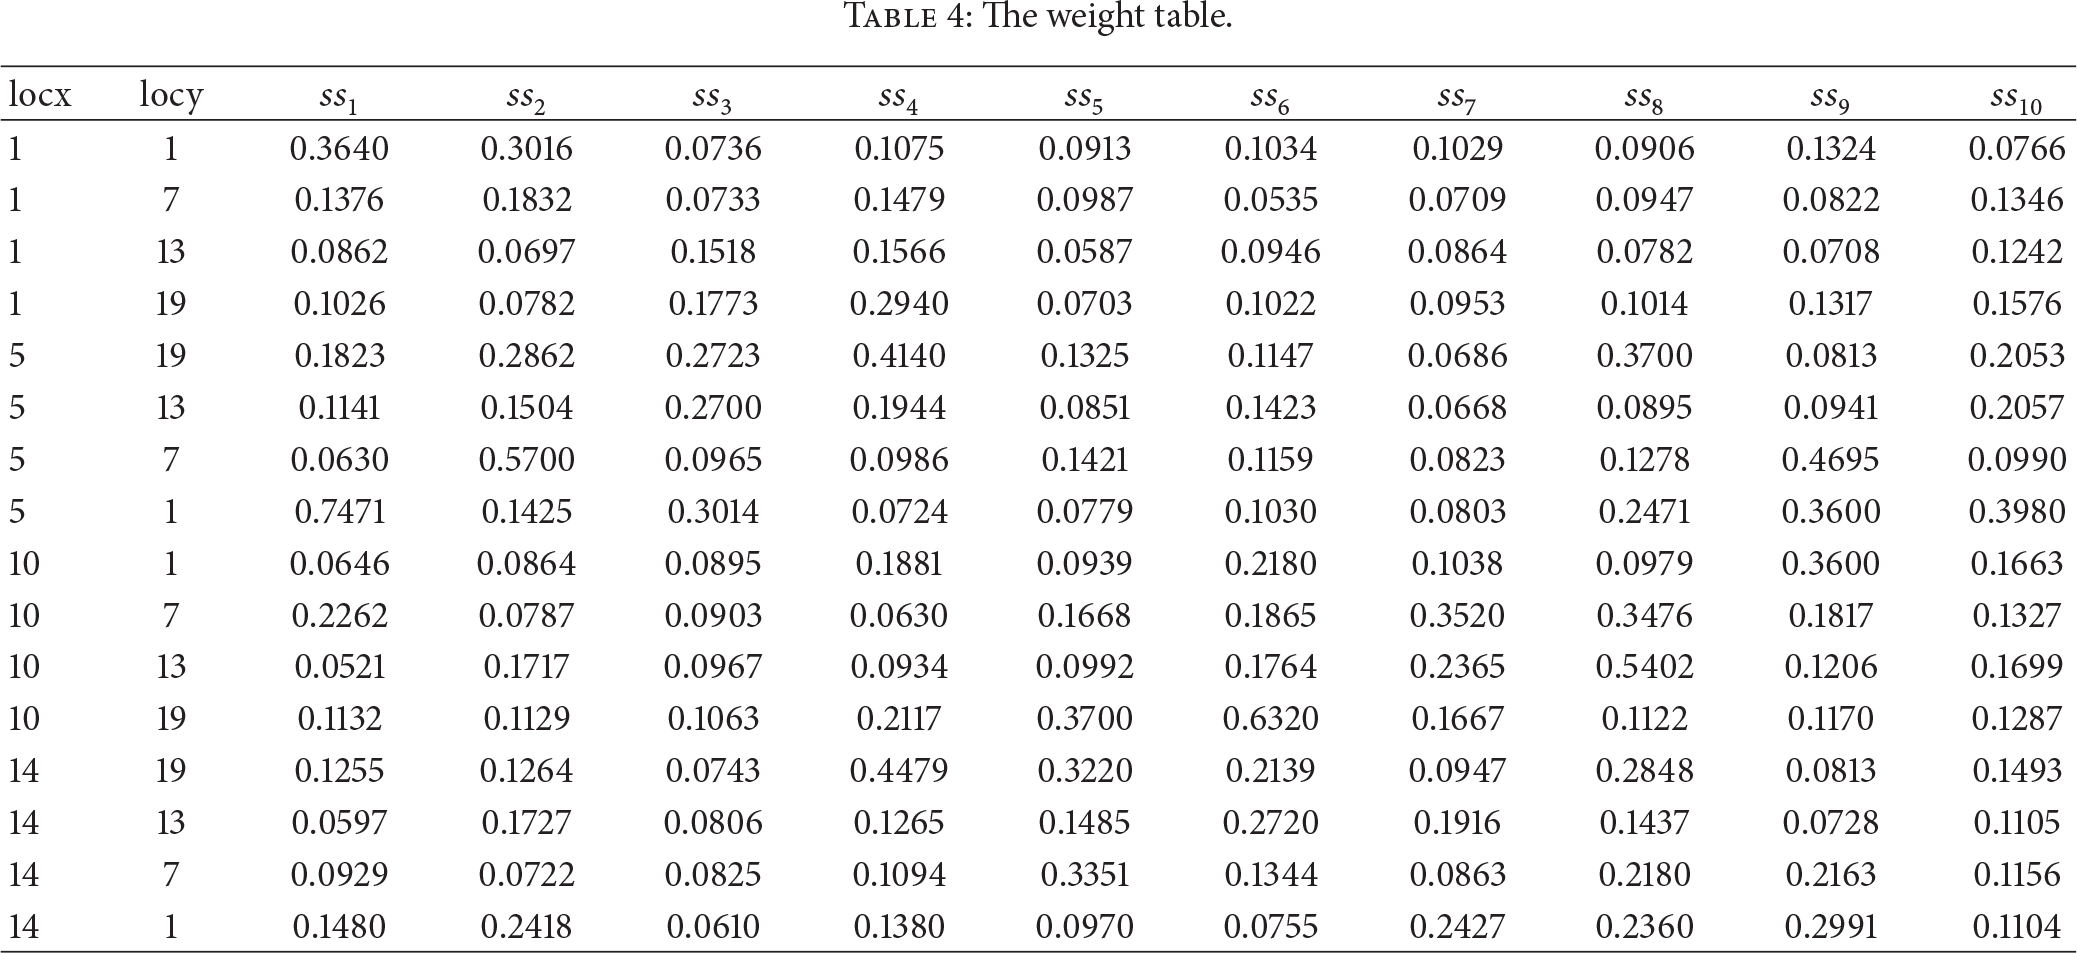
The weight table.
3.7. The Online Location Prediction Phase
During the online localization phase, we first collect several RSS samples at the index location. Then, we compute the average RSS value vector of the collected samples and use it to select the best radio map for online location prediction.
To find the position of the user, we collect an RSS value vector, denoted by

Min-max distance and bounding box.
From the circles with radii of minimum and maximum distances from their corresponding sensors, we can find the intersection points, that is,
Finally, we find the training locations within the bounding box and use these locations to predict the position of the user. The pattern matching on RSS location signatures is used to find the position of the user. For each location 
After computing the distances between
4. Experiments
To show the performance of the region-point system, we perform several experiments on location prediction in the classroom. In this section, we present the experiments and the results.
4.1. The Experimental Environment
As shown in Figure 2, we implement the localization system in a classroom. Figure 5 shows the layout of the reference sensors and the locations where the training samples are taken. The ground of the classroom is decorated with tiles. The tile's dimension is 60 centimeters on each side. We set the origin of the coordinate system at the top left corner of Figure 5. Ten reference sensors, denoted by large circles in Figure 5, are evenly located in the classroom. The training locations are denoted by small circles. Totally, we have 16 training locations. The coordinates of two examples of training locations are

The positions of the sensors and the training locations.
For comparison purpose, we implement the RADAR method and a decision tree method called TREE and the CaDet method. For RADAR, the RSS vectors of different training samples from the same location are averaged. As a result, each location is associated with only one average RSS vector. To predict the coordinates of a test sample, three neighbors whose RSS vectors are among the top 3 shortest distances from the test sample are retrieved from the radio map and their corresponding coordinates are averaged to give the predicted coordinates of the test sample. To examine the effect of the search space reduction on RADAR, we revised the RADAR method by using the min-max distance table to confine the search region of RADAR. We call the revised RADAR method ReRADAR in the experiment.
For the TREE method, a decision tree is constructed for every radio map. The decision tree is then used to predict the coordinates of a test sample. Note that we use the CART decision tree model in R [17] to construct the decision trees. For CaDet method [14], we first use the K-means method in R to divide the training samples into three clusters based on their RSS vectors. A CART decision tree is then built for each cluster. To predict the coordinates a test sample, we compare the RSS vector of the test sample against the cluster mean of each cluster and select the decision tree whose corresponding cluster center has the shortest distance against the test sample to predict the location of the test sample.
4.2. The Experimental Results
Figure 6 shows an execution of the radio map selection algorithm. It shows that the location

An execution of the radio map selection algorithm.
To conduct the experiment, we consecutively collect 20 RSS value samples at each of the 16 testing locations. Totally, there are 320 test samples. Figure 7 shows the four executions of the region point with different lengths of the RSS location signatures.
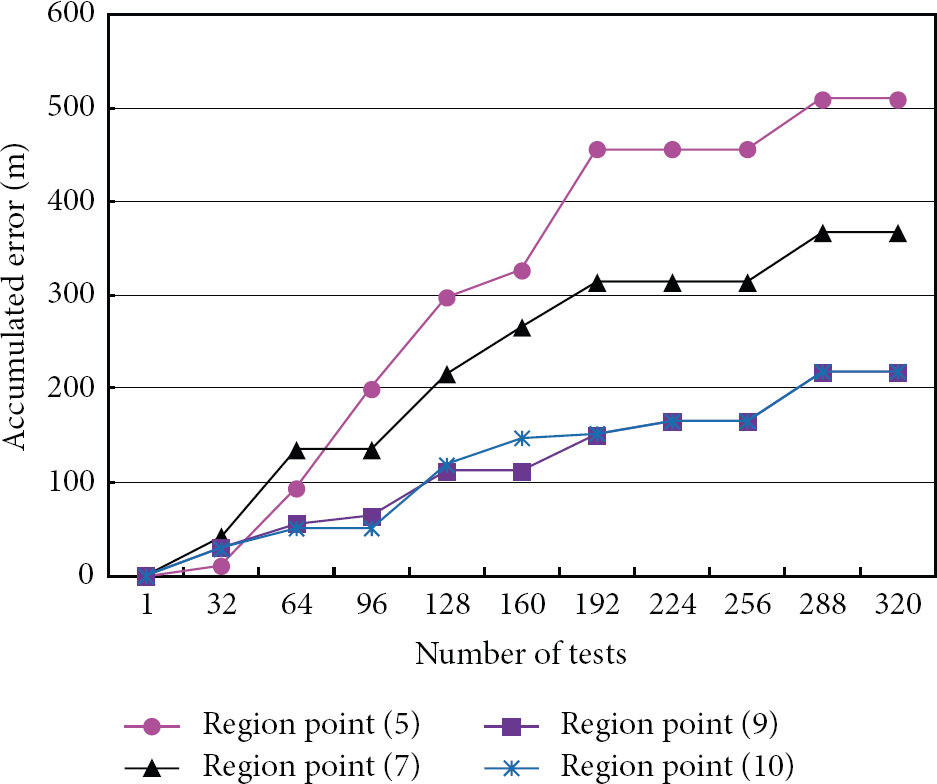
Performance of region point with different lengths of the RSS location signature.
Figure 7 shows that the longer the RSS location signature, the higher the prediction accuracy. However, the length effect decreases as the length becomes longer. This is evidenced in Figure 7, where the accumulated errors for region point with 9 and 10 components, respectively, are almost the same.
Figure 8 shows the accumulated errors for RADAR, ReRADAR, TREE, CaDet, and region point. It shows that the region point method has the smallest accumulated error compared with RADAR, ReRADAR, TREE, and CaDet. It also shows that the accumulated error for ReRADAR is much less than that of RADAR. The mean errors for the 320 test samples are 0.681, 1.29, 2.11, 2.87, and 2.99 for region point, ReRADAR, RADAR, CaDet, and TREE, respectively. Figure 8 shows the fact that the search region restriction using the min-max distance table effectively reduces the prediction error of RADAR.

Accumulated errors for different methods based on radio map
Figure 9 shows the accumulated errors for different methods based on radio map

Accumulated errors for different methods based on radio map
Figure 10 shows the accumulated errors based on radio map

Accumulated errors for different methods based on radio map
5. Discussion
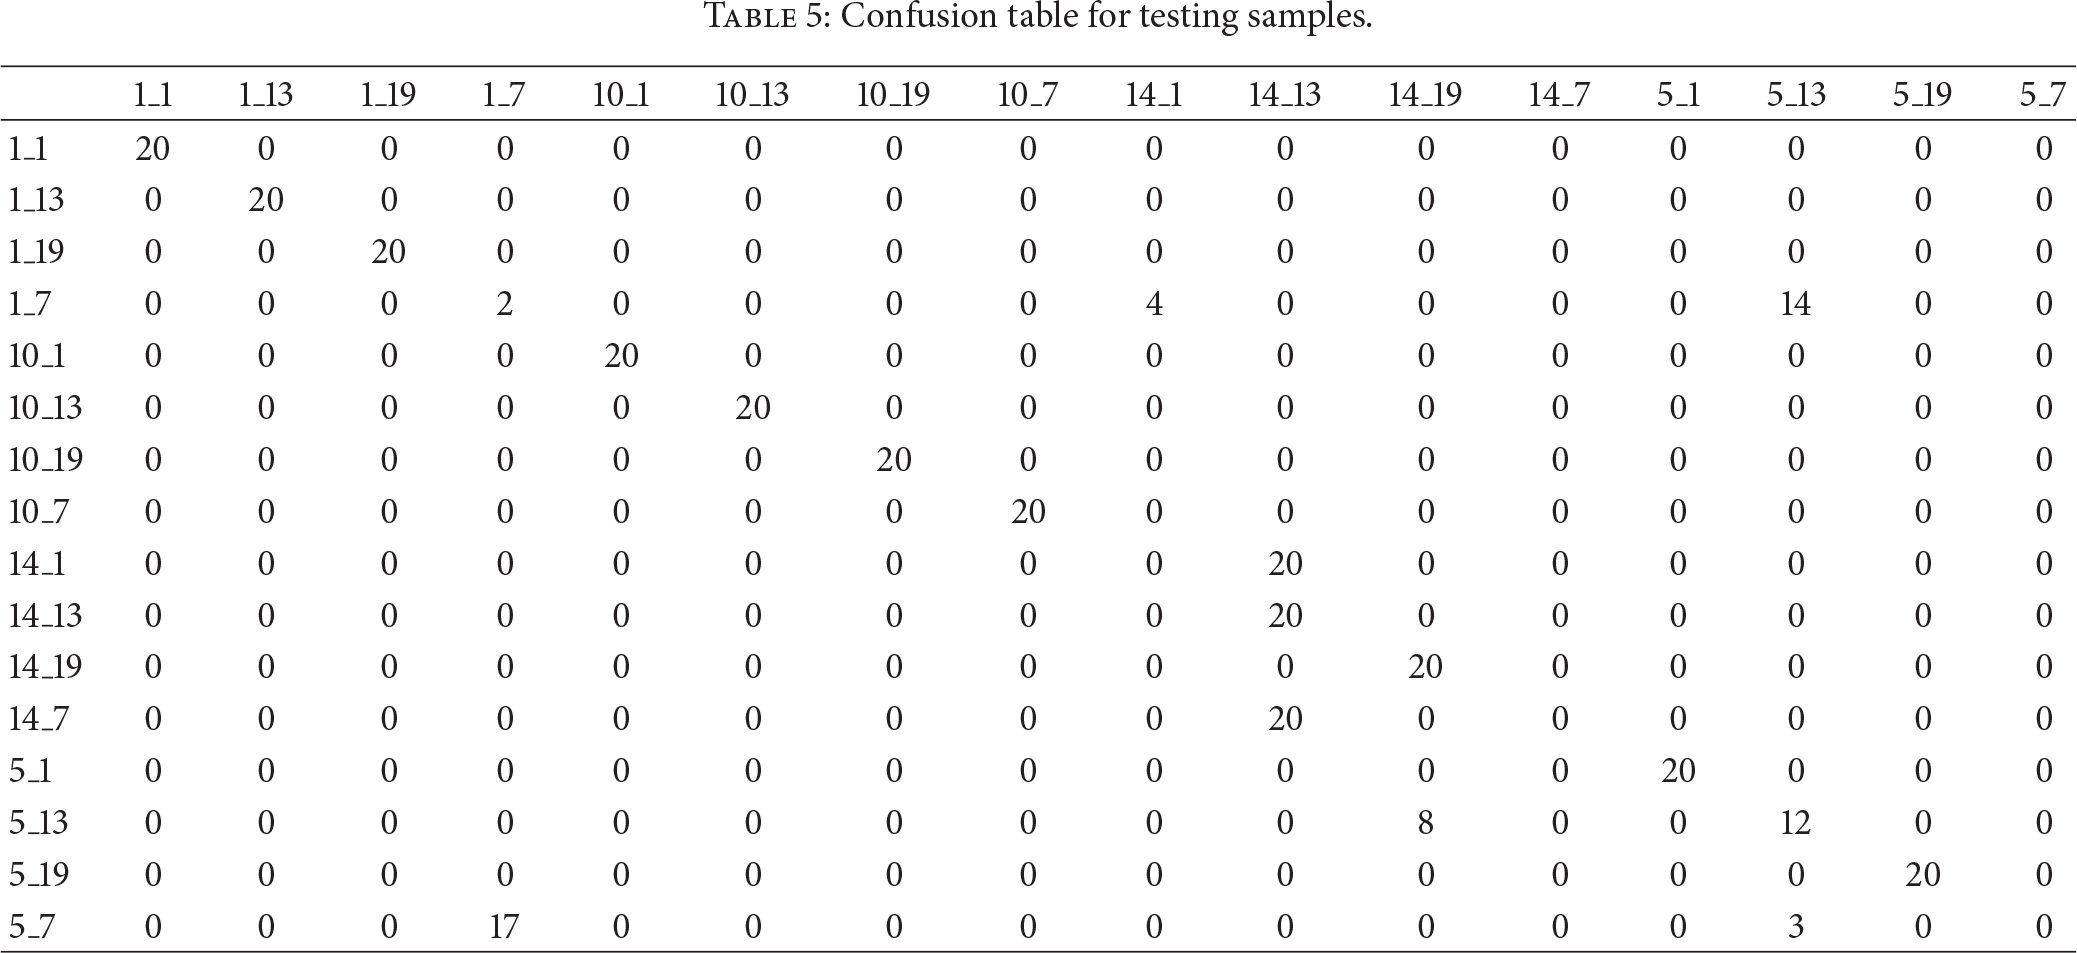
The fact that the TREE and CaDet methods do not perform well in our experimental environment needs to be carefully studied. To do so we show the decision tree built by CART based on radio map
Confusion table for testing samples.
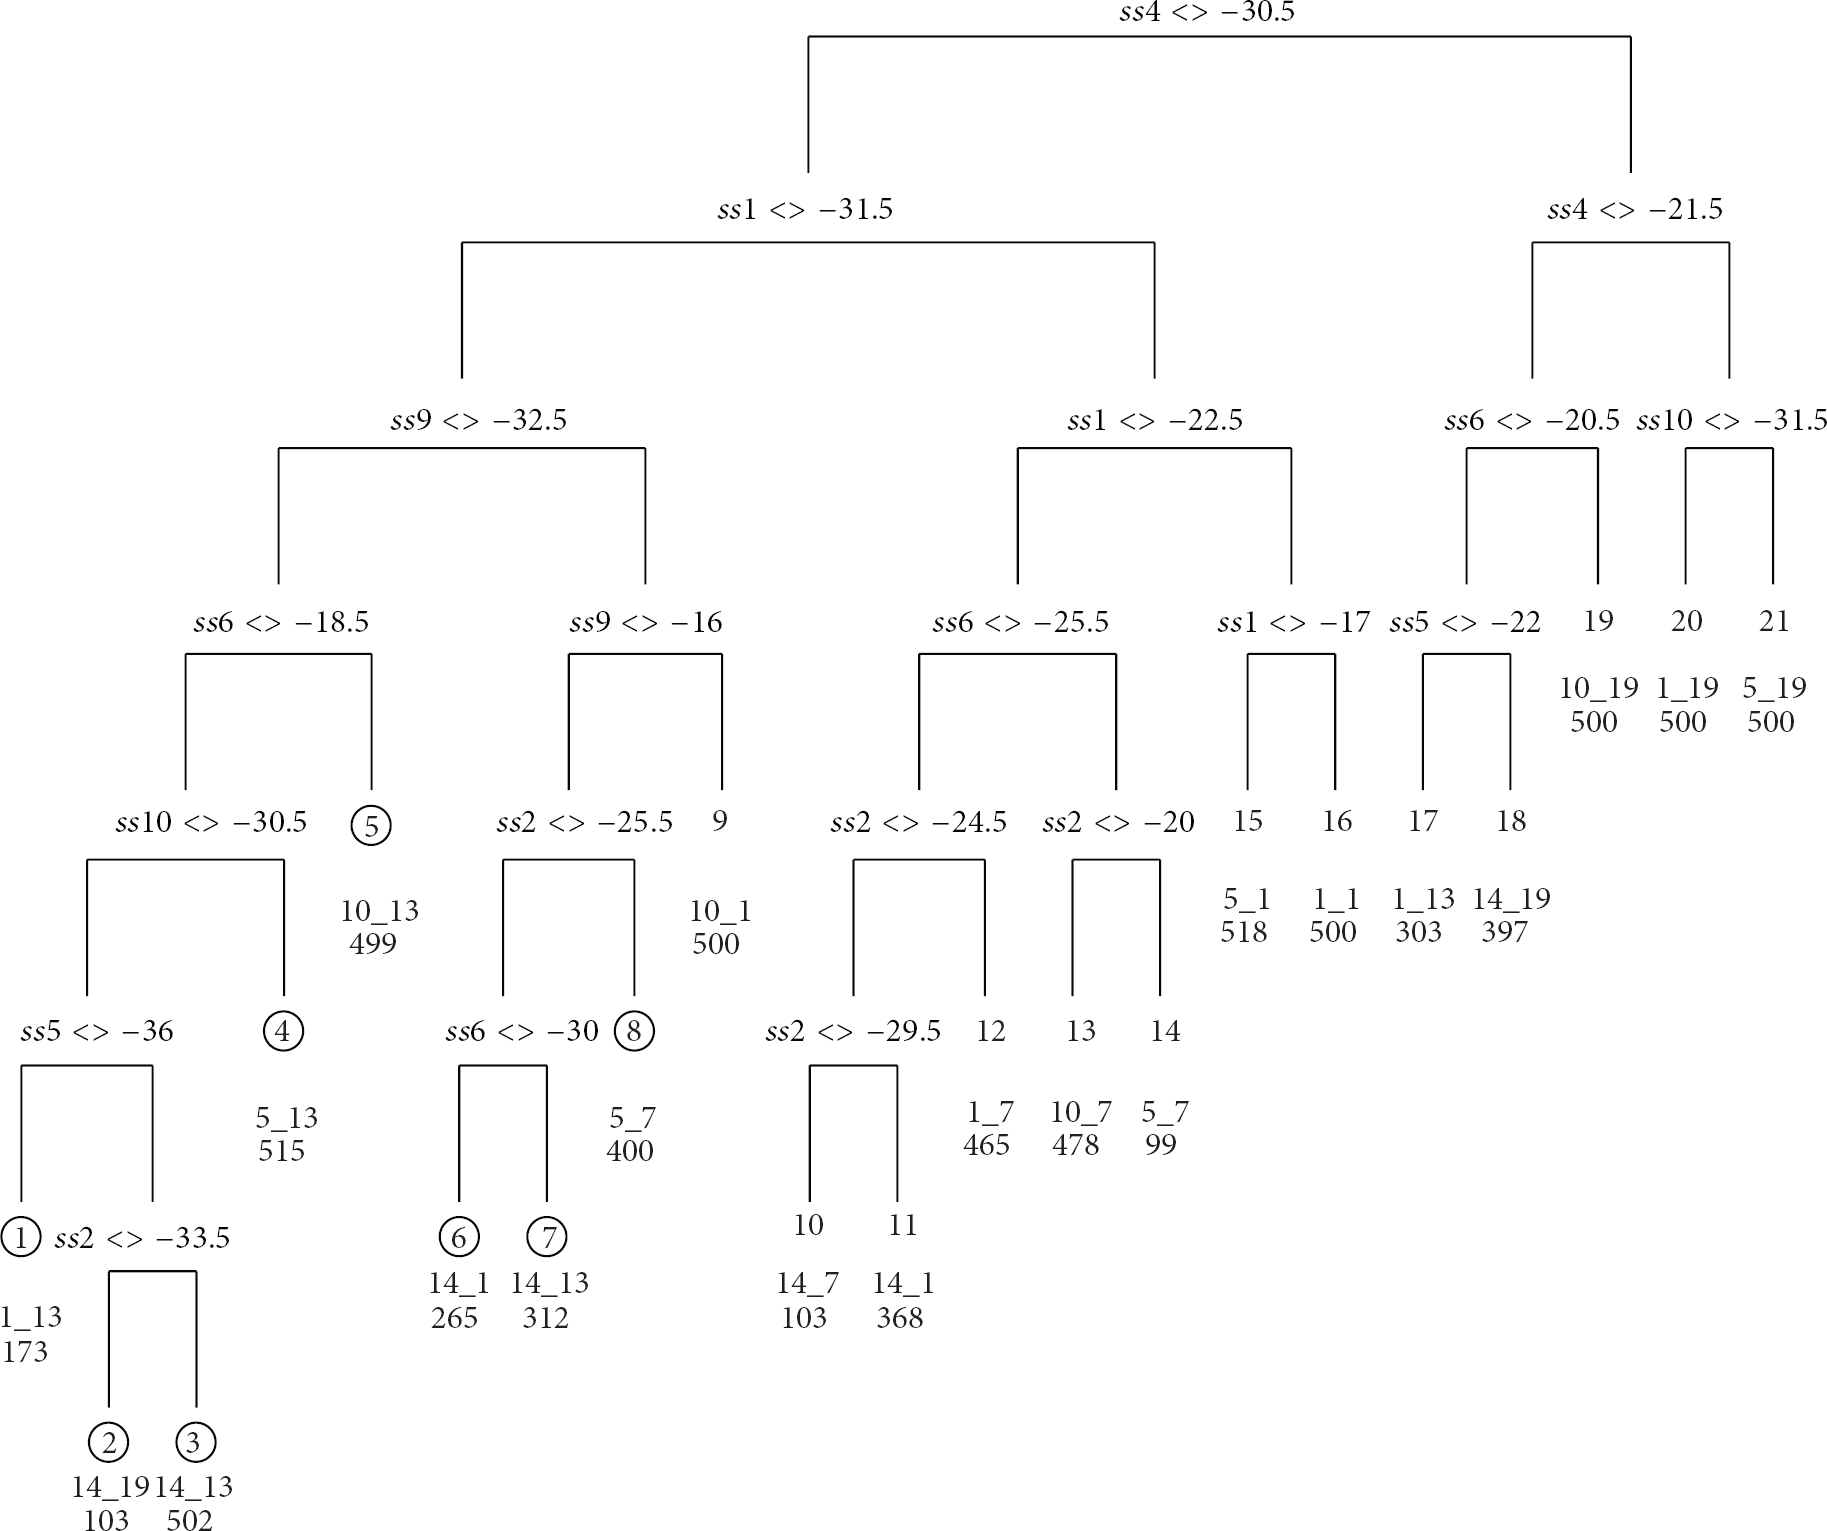
The CART decision tree for radio map

Histograms of prediction errors for TREE and region point.
6. Conclusions
In this paper, we present the implementation of a robust indoor localization system using a wireless sensor network. In this system, we propose three methods to counter the adverse effect of variation on the received signal strength values on location prediction. First, we propose to use an index location to select the best radio map for online location prediction. Second, we propose to use the min-max distance table to confine the search region for online location prediction. Finally, we propose to use the RSS location signature for pattern matching in online location prediction. The experimental results showed that the index location method correctly selects the best radio map for online location prediction. It also showed that the min-max distance table method effectively reduces the prediction error of RADAR, and the region point system offers a higher prediction accuracy than those of the RADAR, TREE, and CaDet.
Footnotes
Conflict of Interests
The authors declare that there is no conflict of interests regarding the publication of this paper.