
Abstract
Large cable-stayed bridges utilize hundreds of stay cables. Thus, placing a sensor on every stay cable of bridges for stay cable damage identification (SCDI) is costly and, in most cases, not necessary. Optimal sensor placement is a significant and critical issue for SCDI. This paper proposes the criteria for sensor quantity and location optimization for SCDI on the basis of the concept of damage identification reliability index (DIRI) under uncertainty. Random elimination (RE) algorithm and heuristic random elimination (HRE) algorithm are proposed to solve the sensor quantity optimization calculation problem. Multistage global optimization (MGO) algorithm is also proposed to solve the sensor location optimization calculation problem. A case study is conducted to evaluate and verify the criteria and algorithms. Results indicate that the HRE algorithm can provide better solution with less elapsed time than the RE algorithm can in some cases, and the MGO algorithm can meet the multistage criterion for sensor location optimization and give a satisfying optimized solution. Theoretical analysis and case study results confirm that the criteria are reasonable and suitable for optimal sensor placement for SCDI. The proposed algorithms are effective and efficient for practical optimization calculation.
1. Introduction
In recent years, bridge health monitoring system (BHMS) has been developed rapidly and widely used in large bridges, especially in cable-stayed bridges. Sensors, which are required to monitor the structural status and influential environmental parameters, are the most important foundation of BHMS. Since the project budget of BHMS is always limited, how to optimally place the limited sensors in a large bridge in order to obtain the best data for parameter and damage identification is a challenging task. Research activities in the last few years have been focused on the design and optimization of sensor placement. Some latest representative studies are presented as follows. Kim et al. [1–3] presented a design of autonomous smart sensor nodes to monitor tendons and girders in prestressed concrete (PSC) bridges and a design of hybrid acceleration-impedance sensor nodes on Imote2-platform for damage monitoring in steel girder connections. Ho et al. [4] presented a type of solar-powered, multiscale, vibration-impedance sensor node on Imote2 platform for hybrid structural health monitoring (SHM) in cable-stayed bridge. Yi et al. [5] attempted to explore the sensitive range of the Fiber Bragg Grating (FBG) sensor and proposed an optimal placement for FBG sensor network fitting with the feature of FBG sensor. Rafael et al. [6] investigated the influence of parametric uncertainties on the optimal sensor placement methodologies for the modal analysis of a truss bridge. Costas et al. [7] investigated the effect of spatial correlation of the prediction error on the optimal sensor placement for modal identification or parameter estimation in finite element model updating of Footbridge in Wetteren.
During the past decades, cable-stayed bridges have found wide application in the world. Stay cables, which bear most of the weight of girders, are the key components in cable-stayed bridges. Therefore, identifying stay cable damage on the basis of cable tension is significant for cable-stayed bridge health monitoring. Considering that hundreds of stay cables are used in large cable-stayed bridges, placing a sensor on every stay cable of bridges is costly and, in most cases, not necessary. Therefore, determining the number and location of sensors for stay cable damage identification (SCDI), namely, the optimal sensor placement (OSP) problem for SCDI, is worth an in-depth study.
Two main problems require further studies in the OSP research area. The first problem is the determination of optimization criterion. Many research activities in previous years have focused on the optimization criterion. Numerous optimization criteria [8, 9], including (1) modal assurance criterion [10], (2) singular value decomposition ratio, (3) measured energy per mode, (4) Fisher information matrix (FIM) [11, 12], (5) mean square error, (6) information entropy, (7) mutual information (MI), (8) representative least squares criterion, (9) visualization of mode shape, (10) modal contribution in output energy [13], and (11) probability-based damage detection criterion, have been proposed. However, most of these criteria, except for probability-based damage detection criterion, were not aimed at damage identification. Therefore, they cannot be used as optimization criteria for SCDI. The probability-based damage detection criterion was developed by Flynn and Todd on the basis of damage detection. This criterion seeks to determine the OSP by minimizing the expected appearance of types I and II error, that is, the global false alarm rate and the global detection rate [8, 14], respectively. An appropriate statistical estimation model of the accuracy of damage detection is needed to optimize sensor placement for damage detection by using this criterion. However, this model is difficult to obtain in large-scale bridge structures. Moreover, the probability-based damage detection criterion was not aimed at SCDI. To solve the first problem, we proposed the criteria for sensor quantity and location optimization for SCDI on the basis of the concept of damage identification reliability index (DIRI) under uncertainty. This criterion does not need complex statistical calculation and can be used in practical engineering.
The second problem is the development of optimization algorithms. Many algorithms have been developed for general optimized solution search. Among these algorithms, the most representative and commonly cited algorithm is the effective independence (EI) algorithm [15–17], which maximizes the determinant of FIM corresponding to the target modal partitions. The following typical improved variants of the EI algorithm have also been proposed: (a) EI driving-point residue (EFI-DPR) algorithm [18, 19], (b) energy coefficient-EI (EC-EI) algorithm [20], (c) QR decomposion (QRD) algorithm [21]. In recent years, some stochastic optimization algorithms have been introduced to solve the OSP problem, which is usually a complex, time-consuming, multiobjective, combinatorial optimization problem [8]. Such algorithms include genetic algorithm [22–27], particle swarm optimization [28], simulated annealing algorithm [29], and ant colony optimization algorithm [30]. Although not the best algorithm available [8], the sequential sensor placement algorithm is a relatively systematic and computationally efficient approach for obtaining a satisfying solution. However, given that most of the abovementioned optimization algorithms are specific (e.g., EI, EFI-DPR, EC-EI, and QRD) or common (e.g., stochastic optimization algorithms), applying them directly to solve the sensor placement optimization calculation problem for SCDI is inefficient. Effective and efficient optimization algorithms should be developed based on certain optimization criteria and problems. In this paper, based on the specific analysis of the sensor placement problem for SCDI and the idea of sequential sensor placement algorithm, we proposed the random elimination (RE) algorithm and the heuristic random elimination (HRE) algorithm to solve the sensor quantity optimization problem. We also proposed the multistage global optimization (MGO) algorithm to solve the sensor location optimization problem.
This study focused on the OSP for the SCDI of cable-stayed bridges under uncertainty. Section 2.1 presents the optimization criteria for sensor quantity and location optimization. Section 2.2 proposes the corresponding optimization algorithms on the basis of the optimization criteria. Section 3 elucidates the case study on an actual cable-stayed bridge to verify the effectiveness of the proposed optimization criteria and algorithms. This section also discusses some problems encountered when using these criteria and algorithms. Finally, Section 4 concludes the paper.
2. Proposed Method
The OSP problem is a kind of combinatorial optimization problem with two key subproblems to be discussed as follows: (1) how to determine the appropriate optimization criterion of sensor placement for SCDI; (2) what kind of algorithm should be applied to solve the complex, time-consuming, multiobjective, combinatorial optimization problem.
2.1. Optimization Criterion
2.1.1. Background and Scope
To solve the first problem, we should focus on the purpose of the sensor placement optimization. This study aimed to accurately and reliably identify the stay cable damage by using a limited number of sensors. Therefore, the optimization criterion should express “accuracy and reliability” by appropriate objective function. Objective functions are constructed based on the SCDI method. Therefore, different types of SCDI methods require different objective functions. The SCDI method based on the change of cable tension (dCT), which is measured by accelerometers or other sensors placed on cables, is currently widely used in practical engineering. Thus, we studied only the optimization criterion for this kind of SCDI method.
2.1.2. Theory Foundation for the Reliability Analysis of Stay Cable Damage Identification
The proposed SCDI method can identify only the cable damage that can lead to significant dCT. Higher SCDI reliability can be acquired when sensors are placed on cables with larger dCT due to cable damage. Accordingly, the rules of dCT should be analyzed to study the SCDI reliability.
Stay cables are considered to be the elastic support of the bridge deck. Considering this fact, a simple finite element model (FEM) of continuous slab was studied. The model, which is shown in Figure 1, has 26 supports that provide the constraints of x, y, z directions. We removed the constraints of the y directions of number 6 support and calculated the value of the change of support reaction (dSR) at every support. The result is shown in Figure 2. The rules of dSR are summarized as follows: (1) removing the constraints of the y directions of one support can lead to the dSR at the nearby support; (2) only the support reaction at the supports marked by black circles in Figure 2 changes significantly; (3) the nearer the support is to number 6 support, the larger the support reaction at the support change.

FEM of continuous slab.

Change of the support reaction (dSR) caused by removing number 6 support.
To obtain more specific rules on dCT, we implemented a complex finite element simulation analysis of the cable damage on a real cable-stayed bridge FEM [31] (see Figure 3). Stay cable damage was simulated by the 30% relaxation of the stay cable. Figures 4 and 5 show the result of dCT due to damage on numbers 6 and 19 stay cables. The rules that are similar to the rules of dCT for simple finite element analysis can be summarized from Figure 5 as follows: (1) the damage of one stay cable can lead to the dCT of other stay cables; (2) the dCT of the damaged cable (about 30% of the original cable tension) is the largest among all stay cables; (3) only the cable tension of stay cables marked by the black rectangle in Figure 5 changes significantly; (4) the nearer the stay cable is to the damaged stay cables, the larger the dCT of the stay cables.
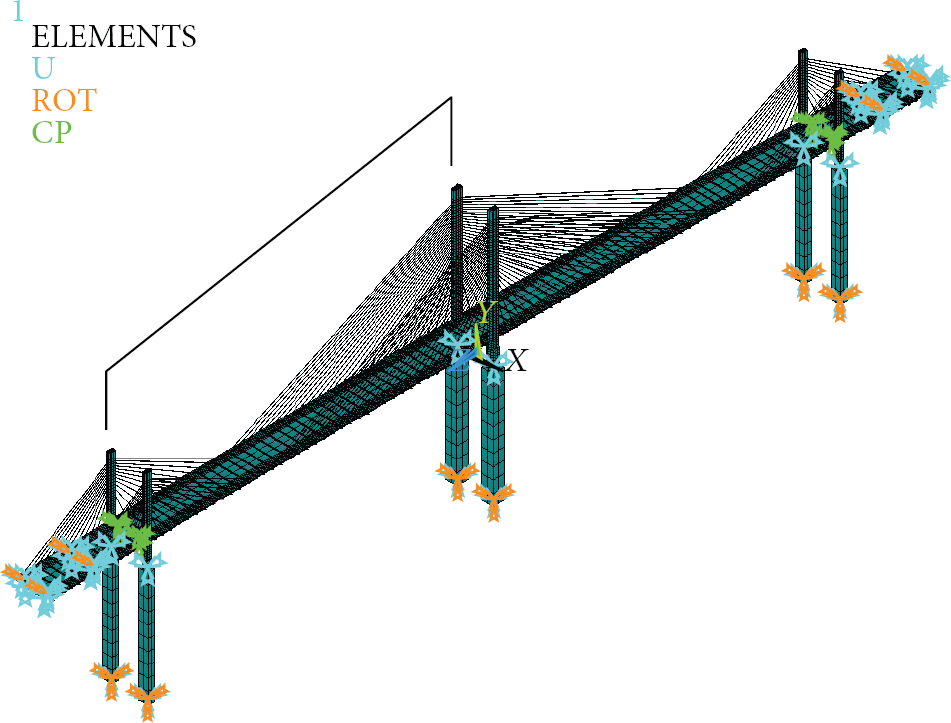
FEM of the Binzhou Yellow River Highway Bridge.
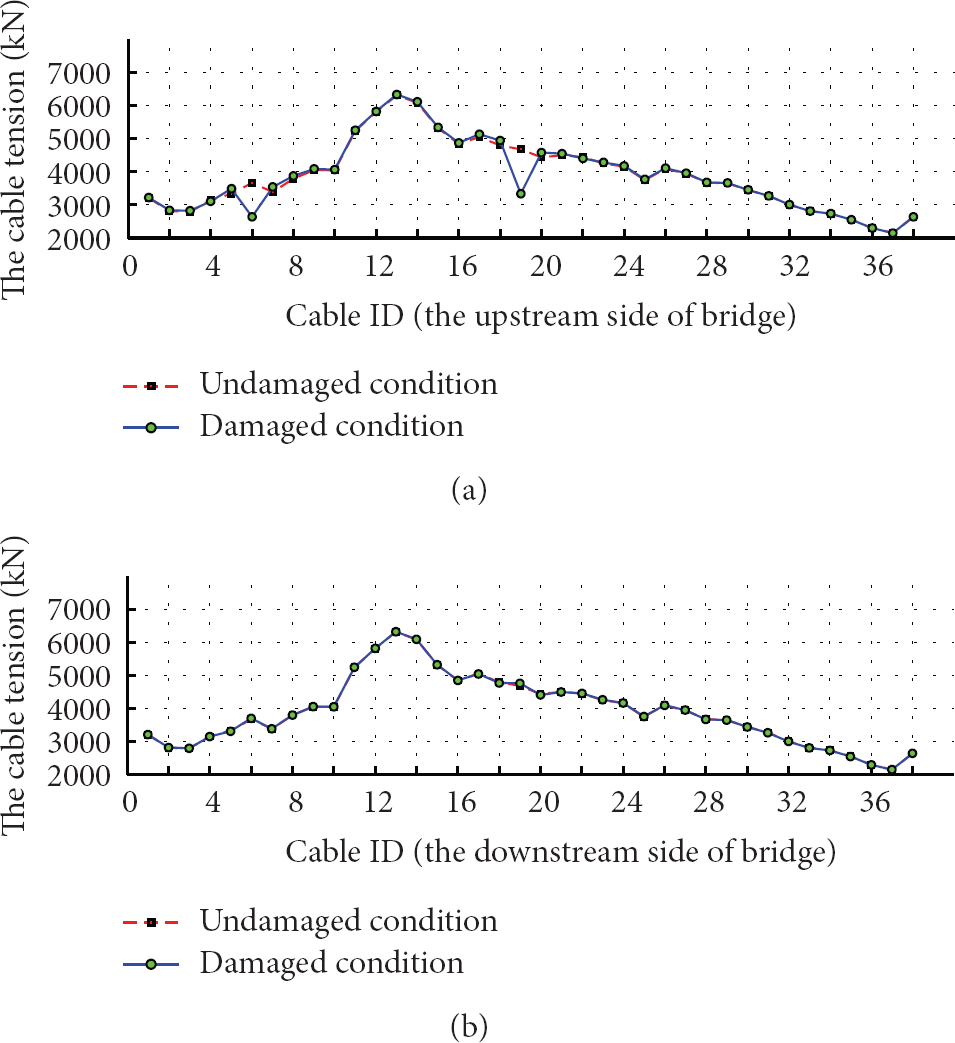
Comparison of the cable tension between undamaged and damaged conditions.
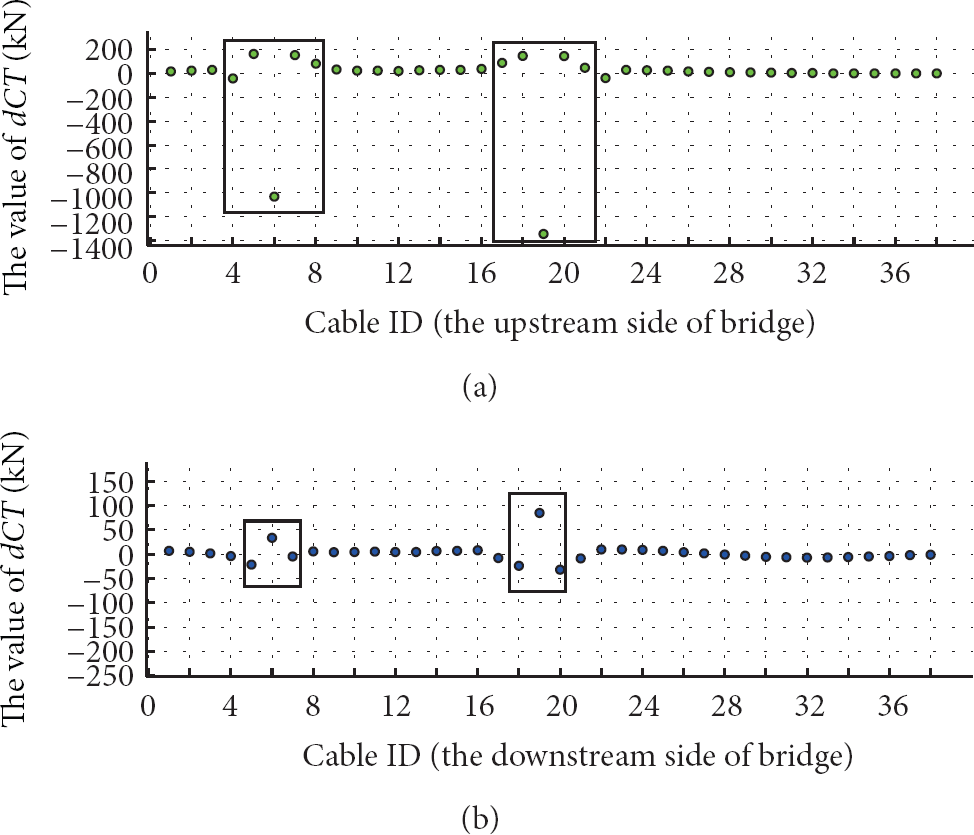
Change of cable tension (dCT) due to cable damage.
We conducted finite element simulation analysis of a simple FEM of continuous slab and a complex FEM of a real cable-stayed bridge. Considering the analysis results and for appropriate simplification, we postulate that only the cable tension of the influenced stay cables can be used for the damage identification of the corresponding damaged stay cable. The influenced stay cables for a damaged stay cable (see Figure 6) can be divided into three groups: (1) the influenced stay cable of group I, which is the damaged stay cable; (2) the influenced stay cables of group II, which are near to the damaged stay cable; (3) the influenced stay cables of Group III, which are farther from the damaged stay cable than the influenced stay cables of group II are.

Influenced stay cables for a damaged stay cable.
Given the uncertainty in the measured data and FEM, an SCDI based on the cable tension of only one or few influenced stay cables is unreliable. The best way to identify stay cable damage is to use the cable tension of all influenced stay cables. However, with limited project budget, we cannot place sensors on every influenced stay cable. The reliability of most SCDI is lower than that of the SCDI with enough sensors. Therefore, the reliability of damage identification for damaged stay cables depends on the sensor placement on the corresponding influenced stay cables.
2.1.3. Damage Identification Reliability Index (DIRI)
This study aims to determine OSP, with the goal that every stay cable of the bridge has an acceptable, satisfying, and high reliability. To achieve this goal, we defined the DIRI index to quantify the damage identification reliability of stay cables. The calculation method of DIRI is associated not only with the sensor placement, as discussed in Section 2.1.2, but also with other factors, including the structure type of the cable-stayed bridge, the specific method of damage identification, the quality of the measured data, and the accuracy of FEM. However, in this paper, we focused only on the relationship between DIRI and sensor placement. Before proposing the calculation method of DIRI, we provide the following premises: (1) the provided calculation method of DIRI is suitable only for cable-stayed bridges with similar rules on dCT; (2) the provided calculation method of DIRI is suitable only for the damage identification methods whose input data are the dCT of the influenced stay cables; (3) assuming that the data uncertainties obtained by sensors on stay cables are of the same level, the effect of uncertainty will not be considered when we calculate DIRI; (4) DIRI is considered a relative index in this paper.
Based on the aforementioned premises, we considered DIRI as a function of sensor placement. However, DIRI is difficult to calculate accurately based on a rigorous theoretical system. In this paper, we provided a selectable and reasonable calculation method of DIRI on the basis of the rules of dCT discussed in Section 2.1.2 and relevant experience. The rigorous theoretical system for the definition and calculation of DIRI needs to be further studied. We considered DIRI as the input data for the OSP method, which is the research emphasis of this paper. In practical applications, experts or decision makers of sensor placement can adjust the proposed DIRI calculation method according to their personal experience and preferences to obtain different results. These results can provide references and suggestions for the final decision of sensor placement.
The proposed DIRI calculation method is described as follows. According to the discussion in Section 2.1.2, the value of DIRI for a damaged stay cable depends only on the sensor placement on eight influenced stay cables. These stay cables can be classified into three groups: G1, G2, and G3 (see Figure 6). The G1 group includes one stay cable, the G2 group includes three stay cables, and the G3 group includes four stay cables. One type of sensor placement was denoted as “sensor placement case.” To identify the stay cables, we denoted the number of possible sensor placement cases on eight influenced stay cables as

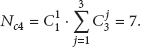
Value of

To calculate DIRI, we defined “reliability contribution score (RCS)” for each stay cable among the influenced stay cables. The RCS of a stay cable quantifies the contribution to DIRI if we place a sensor on this stay cable. 
The values of
Table 1 shows the values of
Calculation and results of DIRI for some typical sensor placements.

2.1.4. Stay Cable Importance Index (SCII)
With consideration that the importance of each stay cable in cable-stayed bridges differs, we defined SCII to quantify it. Suppose the value of SCII is an integer; SCII ranges from 0 to 6. Table 3 gives the description of importance for different values of SCII.
Description of importance for different values of SCII.

The value of SCII can be given by experts or decision makers. We can set the value of SCII of all stay cables as 3 (Normal) at first; and then adjust the value of SCII according to the following aspects.
Size and location of the stay cable: the importance of the longest stay cable or the shortest stay cable will be higher than other stay cables in general because of their representativeness. Probability of stay cable damage occurrence: if historical test data show that potential abnormalities exist in some stay cables, then the probability of damage occurrence on these stay cables will be higher than that of other stay cables. Thus, focus should be given on the former. Consequences of stay cable damage: if some damages have been found in a segment of the girder, then the damage of the stay cables which support this segment of girder may lead to more serious consequences than other stay cables do, and we have a reason to believe that the importance of these cables is higher. If some stay cables have already been monitored by other means, then the SCII of these stay cables should be set as lower value than other stay cables should be. Expert experience and subjective preference of decision makers: if experts or decision makers believe that some stay cables are more important, the SCII of these stay cables will be higher than other stay cables.
On the basis of SCII, experts or decision makers can determine the value of the allowable minimum DIRI and the satisfying DIRI directly. See Sections 3.3.1 and 3.4.1 for details.
2.1.5. Criterion for Sensor Quantity Optimization
The allowable minimum monitoring requirement should be provided to determine the sensor quantity. In this study, the allowable minimum monitoring requirement can be expressed by the allowable minimum DIRI, which can be determined directly by experts or decision makers on the basis of the corresponding SCII.
Accordingly, the optimization criterion and the problem description of sensor quantity optimization are given as follows.
Objective. Determine the minimum number of sensor optimally placed on the stay cable and the corresponding sensor placement.
Subject to

2.1.6. Multistage Criterion for Sensor Location Optimization under the Given Number of Sensors
The core idea of sensor location optimization under the given number of sensors is to increase the DIRI of all stay cables globally under the premise of meeting the requirement of the allowable minimum DIRI of all stay cables and satisfying the DIRI of the stay cables with high SCII. In this study, the satisfying DIRI was determined directly by experts or decision makers on the basis of the corresponding SCII.
On this basis, the multistage criterion and the problem description of sensor location optimization under the given number of sensors are given as follows.
Stage 1
Objective. Determine the minimum number of sensors and the corresponding sensor placement.
Subject to

Stage 2
Objective. Under the premise of completing stage 1, determine the minimum additional number of sensors placed on the stay cables where no sensors were placed in stage 1.
Subject to

Explanation. Priority monitoring group comprises some stay cables with high SCII, which are determined by experts or decision makers. In this stage, the stay cables in the priority monitoring group will be sorted according to the corresponding SCII. The sensor placement will be subject to Inequation (6) for the stay cable with high SCII preferentially when sensors are not enough for stage 2.
Stage 3
Objective. Under the premise of completing stages 1 and 2, find the optimal placement of the remaining sensors to maximize global DIRI (GDIRI), which is defined as follows:

Subject to. The total number of sensors placed on the stay cables is less than the given number of sensors.
Explanation. 
The form of
2.2. Optimization Algorithm
As discussed in Section 2.1, sensor quantity and location optimization are a complex, multiobjective, combinatorial optimization problem. An exhaustive search would be extremely time consuming or even impossible. Thus, a systematic and efficient approach is needed to solve such computationally demanding problem [8].
Calculating the exact solution within a limited time is difficult. Therefore, we focused on the approximate approach for the combinatorial optimization problem. No general approach exists for all types of combinatorial optimization problems. Therefore, we need to develop a specific approach to solve the specific combinatorial optimization problem discussed in this paper.
2.2.1. Algorithm for Sensor Quantity Optimization
The RE algorithm is proposed for sensor quantity optimization. The main idea of the RE algorithm is to set the initial sensor placement and to remove sensors randomly one by one under the condition that the DIRI of any stay cable meets the requirement of Inequation (4). This approach is conducted until no sensor can be removed from the stay cables. The number of sensors left on the stay cables is a feasible solution. However, this solution may not be the best solution. Therefore, we need to repeat the above process (this process is a complete random elimination process which is called a “cycle”) to obtain multiple results and to select the best cycle among all cycles. We cannot ensure that this process will obtain the best solution, but we can obtain the satisfactory solution under the condition that the number of cycles is sufficient.
Figure 7 shows the flowchart of the proposed RE algorithm, which is used to determine the required minimum number of sensors.

Flowchart of the RE algorithm.
The RE algorithm is a random search algorithm in nature and is a common algorithm for sensor quantity optimization with any form of
Figure 8 shows the flowchart of the HRE algorithm proposed in this paper to determine the required minimum number of sensors.

Flowchart of the HRE algorithm.
2.2.2. MGO Algorithm for Sensor Location under the Given Number of Sensors
The MGO algorithm is proposed for sensor location optimization under a given number of sensors. The main idea of the MGO algorithm is described as follows. We determined the OSP through three stages. In stage 1, the sensor placement with the minimum number of sensors is obtained by using the RE or HRE algorithm to meet the requirement of Inequation (5). In stage 2, if the number of sensors placed on the stay cables in stage 1 is less than the given number of sensors, then additional sensors are placed on stay cables with no sensors to meet the requirement of Inequation (6). By using the RE algorithm, we conduct this step on the stay cables in the priority monitoring group. In stage 3, if the number of sensors placed on the stay cables in stages 1 and 2 is still less than the given number of sensors, then the remaining sensors are placed on stay cables with no sensors placed in stages 1 and 2 to increase globally the DIRI of the stay cables (maximize GDIRI). This stage is completed by using the multistep increasing DIRI (MID) algorithm, which is described as follows: the final objective DIRI (
Figure 9 shows the flowchart of the MGO algorithm proposed in this paper for determining the OSP under the given number of sensors. The flowchart of the MID algorithm, which is the subalgorithm in the MGO algorithm, is shown in Figure 10.

Flowchart of the MGO algorithm.

Flowchart of the MID algorithm.
3. Case Study
3.1. Binzhou Yellow River Highway Bridge (BZ Bridge; Cable-Stayed Bridge)
To study and verify the proposed algorithm, a case study for determining the optimal sensor quantity and location on a cable-stayed bridge named BZ Bridge is given in this paper.
The BZ Bridge is a three-tower cable-stayed bridge with a span of

Bird view of the BZ Bridge.
The BZ Bridge is divided into four areas by three towers. Considering symmetry and without loss of generality, we focused on the OSP on the stay cables between one edge tower and the middle tower (see Figure 12). To identify the stay cable damage, we applied accelerometer to monitor the cable tension. The total number of these stay cables is 76; thus, the maximum number of sensors (accelerometers) to be placed on the stay cables in this case study is 76.

Stay cables considered in this case study.
3.2. Description of Programming
For the case study, the programs for sensor quantity and location optimization were developed based on the proposed algorithm by MATLAB R2010b, which is the programming language of technical computing. The related calculation and analysis in the case study were also conducted by MATLAB R2010b.
3.3. Result and Discussion of Sensor Quantity Optimization
3.3.1. Setting of the Main Input Parameters
According to the description in Section 2.1.4, in this case study, we assume that the SCII of the longest and shortest stay cables within a cable plane was set as 5 (very important), the SCII of the stay cables with medium length was set as 2 (unimportant), and the SCII of other common stay cables was set as 3 (normal).
The
Value of DIRImin corresponding to SCII.

It should be pointed out that the users can also set SCII and
3.3.2. Result and Discussion of the RE Algorithm
In the RE algorithm, given that sensors are removed randomly each time, the result of each cycle includes some randomness. To determine the optimal solution, we should select the best solution from the results of numerous cycles. Figure 13 shows the result of the minimum sensor quantity of each cycle, which decreased from 44 to 27. The best solution of the minimum sensor quantity in this optimization calculation is 27, which is marked by large, black dots in Figure 13.

Minimum sensor quantity of each cycle.
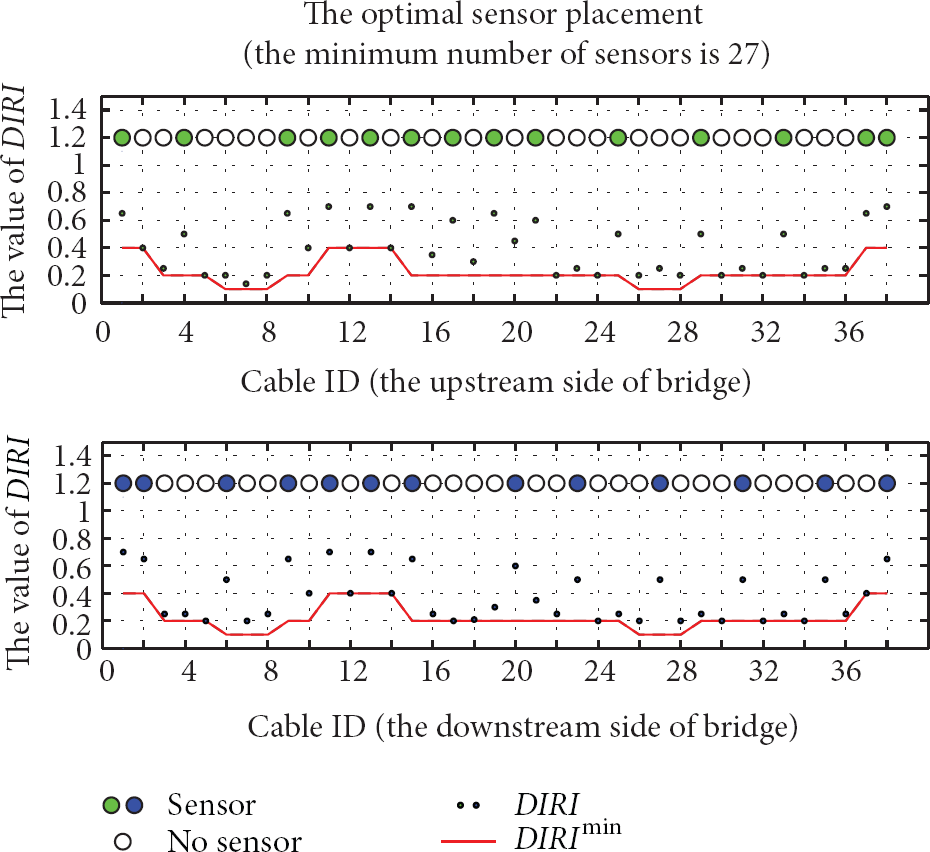
RE algorithm result when the number of cycles was set as 500,000.
Figure 14 shows the sensor quantity optimization result under the condition that the number of cycles in the RE algorithm is set as 500,000. The DIRI of this OSP are all larger than
As discussed earlier, when the number of cycles is set as a different value, the RE algorithm will give a different result. The more the number of cycles is, the better the result obtained, but the longer time the RE algorithm will spend to obtain the result. Table 5 shows the optimal sensor quantity and the elapsed time corresponding to the different number of cycles. The optimal sensor quantity decreased with the increased number of cycles. However, when the number of cycles is more than 100,000, the optimal sensor quantity does not decrease. Therefore, the number of cycles must not be set to more than 100,000. When the number of cycles is 100,000, the elapsed time is 500 s, which is acceptable for the actual project.
Optimal sensor quantity and elapsed time corresponding to different number of cycles.

3.3.3. Result and Discussion of HRE Algorithm
In the HRE algorithm, the initial sensor placement is determined first based on expert knowledge and experience. Therefore, the result may be better than that of the RE algorithm under the condition that the
Figure 15 shows the result from the HRE algorithm. The sensor placement from the HRE algorithm is more symmetrical than that from the RE algorithm. The minimum number of sensors optimized from the HRE algorithm was 25, which is less than that from the RE algorithm by 2 (see Figure 14). The elapsed time of the HRE algorithm was 70 s, which is significantly less than that of the RE algorithm. Therefore, the HRE algorithm is more effective than the RE algorithm in this
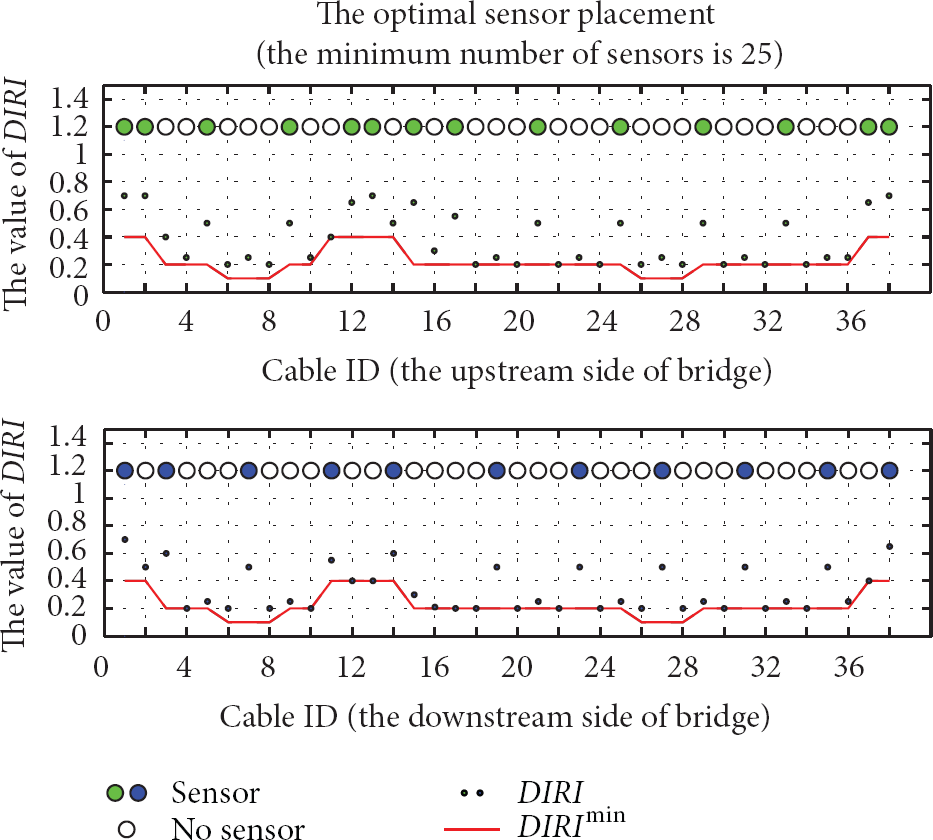
Result from the HRE algorithm.
Figure 16 shows the comparison between RE and HRE algorithms, with other forms of

Comparison between RE and HRE algorithms.
3.4. Result and Discussion of Sensor Location Optimization
3.4.1. Setting of the Main Input Parameters
The setting of
Value of DIRIsat corresponding to SCII.

The

Results after each stage of the MGO algorithm.
To simplify the problem, in this case study, we assume 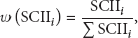
It should be pointed out that the users can also set
3.4.2. Result and Discussion of the MGO Algorithm
Figure 17 shows the sensor placements after each stage of the MGO algorithm, assuming that the given number of sensor is 35. In stage 1, 25 sensors were placed to meet the requirement of
Figure 18 shows the sensor placement results corresponding to different number of sensors. When the given number is 30, stage 3 is not executed because no sensors remained for sensor placement in stage 3. When the given number is 40 or 50, 9 or 19 sensors remained for sensor placement in stage 3. As shown in Figure 18, with the increase of the given number of sensors, the final DIRI level increased globally. Therefore, the MGO algorithm can be considered in line with the core optimization idea described as follows: increase DIRI of all stay cables globally under the premise of meeting the requirements of

Sensor placement results corresponding to different number of sensors.
4. Conclusion
A study of OSP for the SCDI of cable-stayed bridges under uncertainty is presented in this paper. The following conclusions are obtained from the theoretical analysis and case study.
The concept of DIRI is presented first. A reasonable and feasible calculation method for DIRI is then given based on FEM analysis and related knowledge in SCDI. The case study shows that the concept and calculation method of DIRI are reasonable and available and can provide the basis and theoretical framework for the determination of the optimization criteria for sensor placement optimization. The criterion for sensor quantity optimization based on the concept of DIRI is presented. The core idea of the criterion is to meet the minimum requirement of DIRI, which is determined directly by experts or decision makers. On the basis of this optimization criterion, the practical sensor quantity optimization problem can be abstracted as a concise, multiobjective, combinatorial optimization problem. Theoretical analysis and case study results show that this criterion is reasonable and suitable for sensor quantity optimization for SCDI. A multistage criterion for sensor location optimization under the given number of sensors is presented. Theoretical analysis and case study show that this criterion can represent effectively the core idea of the sensor location optimization described as follows: increase the DIRI of all stay cables globally under the premise of meeting the requirements of The RE and HRE algorithms are presented for sensor quantity optimization calculation. The RE algorithm is a common algorithm for any form of The MGO algorithm is presented for sensor location optimization calculation. The MGO algorithm includes three stages that correspond to the three stages of the multistage criterion for sensor location optimization. In stages 1 and 2, the MGO algorithm can give the sensor placement result to meet the requirements of
Although some relatively detailed study has been conducted, the following aspects of this paper require further study.
The calculation method of DIRI is based on the finite element analysis about dCT and expert experience in SCDI. A method of calculating DIRI more theoretically needs to be studied in the future. The RE, HRE, and MGO algorithms presented in this paper can give satisfying optimized solutions. Although these solutions have already been accepted and are sometimes enough in practical engineering, the more effective and efficient algorithms for sensor quantity and location optimization for SCDI require further research.
Footnotes
Appendix
Eight types of predefined typical optimal placements for the setting of the same DIRI (see Figure 19).
Acknowledgments
This research work was jointly supported by National Natural Science Foundation of China (51308094), Key Projects in the National Science & Technology Pillar Program during the Twelfth Five-Year Plan Period (2011BAK02B02), National Natural Science Foundation of China (51278085), and Doctoral Scientific Research Startup Foundation of Northeast Dianli University (BSJXM-201222). The authors would also like to thank the anonymous reviewers for their valuable suggestions.