
Abstract
Seepage is the major factor and monitoring index of levee safety. Leakage may be undetected by conventional monitoring methods and techniques, but optical fiber distributed temperature sensor (DTS) temperature measuring system can achieve real-time temperature monitoring in internal soil of levees. According to the temperature field obtained by DTS system, monitoring and inversion methods of seepage velocity based on double-line heat source and single-line heat source are introduced, respectively. An experiment is designed and composed of DTS temperature measuring system, the heating system, the water supply system, and the computer-aided analysis system to test and verify the effectiveness and feasibility of the monitoring method. On this basis, the system of monitoring seepage based on distributed optical fibers is put forward and designed. Optical fiber intelligent monitoring system will improve the current situation of safety monitoring of levee engineering on the basis of its unique superiority.
1. Introduction
To protect cities, villages, mines, and factories on both sides of the river from devastating floods, levee engineering is constructed. Although levee construction technology for flood control has a history of several thousand years, levee engineering is not an exact science at present, because there are lots of random or uncertain factors during the project operation. Therefore, strengthening safety monitoring of levees is very important. The characteristics of levee engineering in China can be summarized as long distance; poor conditions in the levee foundation; poor quality of levee body filling; numerous ponds and lowland in the downstream areas; too many hidden dangers left by history; and lots of seepage disasters in flood season [1]. In view of the complex characteristics of levee engineering above, levee safety monitoring develops slowly and is not perfect compared with the dam safety monitoring, which needs further research and improvement [2]. With the social and economic development, the demand for flood control becomes higher and higher, and new thoughts of flood control and modernization of water conservancy give more arduous missions for management [3]. The digitization and information of engineering will greatly enhance the efficiency of project management, which will make a revolutionary change in management and method of levees. Safety monitoring of levees is not only beneficial to avoid dangers and disasters but also the precondition for prevention and forecast of levee disasters [4]. Seepage has always been an important factor influencing levee stability. In the flood season, there have been frequent seepage disasters of levee. The complexity of the levee seepage mainly reflects on two aspects: firstly, the complexity of levee foundation and body formation; secondly, the limitation of detecting seepages.
The mission of safety monitoring is to know the “health state” of levee projects at all time, whose core is to discover and forecast abnormal state timely, particularly, dangerous situations for the safety of levees. Therefore, safety monitoring system shall have the ability to capture all the project risk information timely and without omission. Distributed optical fiber sensing technology has the following advantages [5]: (1) easy to form automatic telemetry system with sensing and transmitting information by a single fiber; (2) high sensitivity, antilightning strike, antielectromagnetic interference; (3) low price, delicate, soft, and small influence on mechanical parameters and property of the material; (4) be able to realize distributed and real-time monitoring, reducing the missing rate of traditional detection greatly, and so forth. Distributed optical fiber temperature sensing technology has been successfully applied to oil and gas wells, pipeline leakage detection, dam monitoring, process monitoring, fire detection, power cable monitoring, and so on. Levee engineering seepage and deformation are the main monitoring items. Kappelmeyer [6] started to study the seepage field of dam through the internal temperature field as early as in 1957, which has been considered to be an effective method and has great application foreground to detect seepages, with the further research and perfection. The development of seepage is a slow process, and to have a correct evaluation needs long-term, real-time online monitoring. The temperature field change caused by seepage in levees is a random event in a large range; thus, traditional detection is easy to miss and difficult to locate seepage [7]. Distributed optical fiber sensing technology can meet the characteristics of levee long-distance monitoring and is suitable for the special requirements of seepage detection, which can realize long-term, real-time, online, and whole section monitoring of levee temperature field and strain field.
2. The Method of Seepage Velocity Inversion Based on DTS System
The heated armored fibers can be considered as a line heat source in the infinite medium. By this assumption, boundary conditions of governing equations can be established, and the temperature field influenced by seepage can be solved. On the other hand, the temperature field can be obtained by DTS system. According to actual measured temperature and model calculation, constantly changing the seepage velocity in the numerical model until the theoretical calculating temperature matches the monitoring temperature, the seepage velocity at this time is the actual one.
2.1. Two-Dimensional Coupling Model of Seepage Field and Temperature Field
Under the case of two-dimensional heat conductivity and seepage within porous media, the heat flux includes two parts [8–10]: the result of heat conduction in porous media,
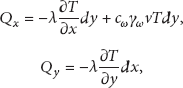

The sketch map of microunit heat flux influenced by seepage.
Similarly, the heat flux exported from the right side and upside of the microunit can be expressed, respectively as

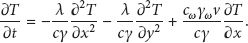
Therefore, the net heat flowing into the microunit within unit time can be got as


Suppose that seepage velocity v is a constant, the above equation can be simplified as


2.2. The Method of Double-Line Heat Source
By a couple of temperature measurement fibers installed in levees, combining temperature measured by distributed fibers and (7), seepage velocity v can be obtained by inversion. The principle diagram of seepage velocity inversion based on the method of double-line heat source is shown in Figure 2.

The principle diagram of seepage velocity inversion based on the method of double-line heat source.
2.2.1. Embedded Method of Optical Fibers
Two parallel temperature measurement optical fibers are embedded in the medium, as shown in Figure 2. Number 1 optical fiber is heated, and number 2 optical fiber is not heated, which is used to sense the temperature rise due to heated number 1 optical fiber. Using DTS to record temperatures changes of number 1 optical fiber and number 2 optical fiber,
2.2.2. The Model to Solve Temperature Field under the Influence of Seepage Field
Above mentioned
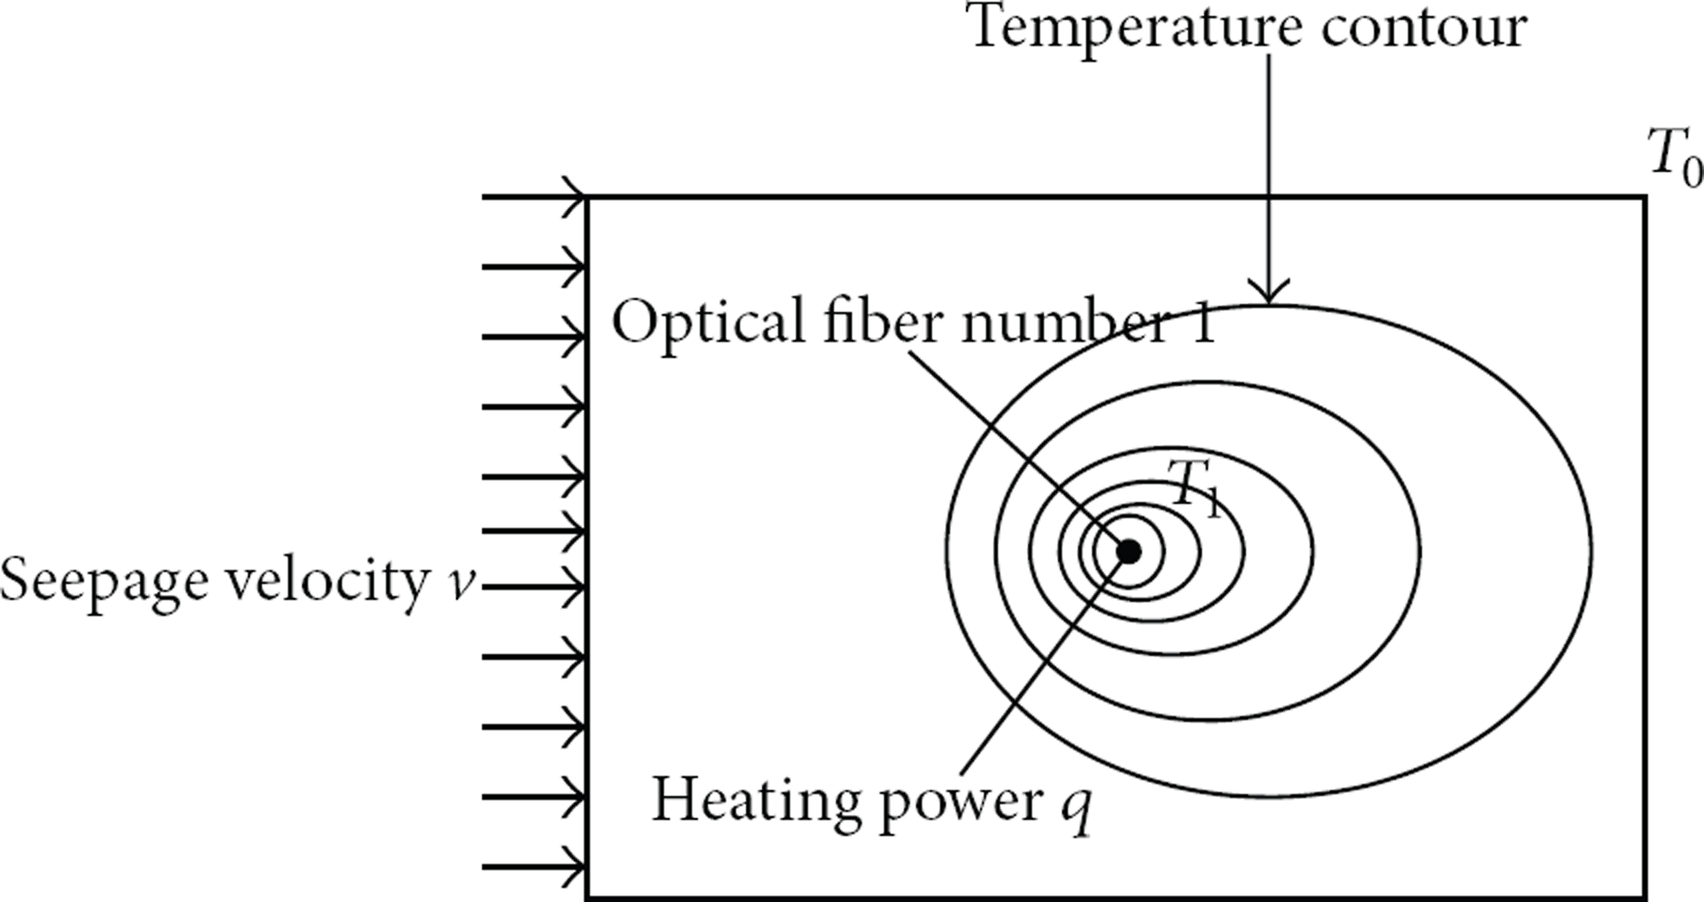
In order to solve expediently, the problem can be simplified as the two-dimensional plane model that sets number 1 optical fiber axis side. As shown in Figure 3, OABC is the outer boundary, and its temperature is ambient temperature

The sketch map of seepage velocity inversion model by optical fibers.
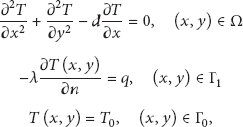
To sum up, the model to solve temperature field under the influence of seepage field can be summarized as

2.2.3. The Steps of Seepage Velocity Inversion
The flow chart of seepage velocity inversion based on the method of double-line heat source is shown in Figure 4. The specific steps are as follows.
Ascertain the temperature Assuming seepage velocity Compare

The flow chart of seepage velocity inversion based on method of double-line heat source.
2.3. The Method of Single-Line Heat Source
The biggest difference between single-line heat source method and double-line heat source method is that the former only requires a heated fiber to make seepage velocity inversion. The steady temperature
The principle diagram of seepage velocity inversion based on single-line heat source method.
2.3.1. The Model to Solve Temperature Field under the Influence of Seepage Field
Taking advantage of above measured
The models to solve temperature field of single-line method and double-line method are similar, as shown in Figure 3. The only difference is that the boundary conditions are different, that is to say, the internal boundary of double-line method is the first boundary condition, while the internal boundary of single-line method is the second boundary condition.
The model of single-line method to solve temperature field under the influence of seepage field can be summarized as
2.3.2. The Steps of Seepage Velocity Inversion
The flow chart of seepage velocity inversion based on the method of double-line heat source is shown by Figure 6. The specific steps are as follows.
Obtain the temperature Assuming seepage velocity Compare

The flow chart of seepage velocity inversion based on method of single-line heat source.
3. Model Experiment
3.1. Seepage Monitoring System with Optical Fibers
In order to model seepage by DTS technology, the experiment system is designed, which consists of heating system, seepage system, DTS system, data processing, and analysis system. As shown in Figure 7, the size of model is 2.6 m × 1 m × 1.15 m.

The model of seepage monitoring system based on DTS.
DTS system is the Sentinel DTS-LR with distributed optical fiber temperature measurement hosts produced by United Kingdom Sensornet, which is one of the most advanced distributed optical fiber temperature measurement system on the market. DTS system can get the temperature curves in different places along the whole length of optical fibers, measuring range up to 10 km, spatial resolution 1 m, and temperature resolution up to 0.01°C. When seepage occurs, the temperature curve varies at where seepage occurs, which will be reflected on the software interface.
The ZTT optical cables are used in the experiment. There are two fixed metal wires between restrictive coating and armor layer in the optical cables. The resistance of metal wires is approximately 0.175 Ω⁄m, and optical cables in the experiment are heated by series heating the two metal wires. There are two optical fibers embedded in the experiment, respectively, recorded as number 1 optical fiber and number 2 optical fiber, and the layout of the two optical fibers is shown in Figure 8 and Figure 9.

The front view of optical fibers layout (cm).

The left view of optical fibers layout (cm).
3.2. Determination of Modeling Region r
The influence region of heated number 1 optical fiber should be specially considered when modeling region is selected. In order to determine the region of influence, the test under saturated without seepage condition is designed, getting the initial temperature and equilibrium temperature of number 1 optical fiber under different heating powers, as shown in Table 1. The inversion of radius r is made by the software module of steady temperature field in the software MARC. Specific methods are as follows.
Calculated equilibrium temperature of optical fiber number 1 under three different modeling region r.

Models of side length 1 m, 0.4 m, and 0.15 m are established, respectively, named model I, model II, and model III. Each cell is 1 cm × 1 cm square in the models by automatic mesh generation. Every model has 7 different kinds of working conditions with 7 different kinds of boundary conditions, as shown in Table 1. Figures 10, 11, and 12 are selected from the inversion results of three models under heating power 6.037 W/m condition.
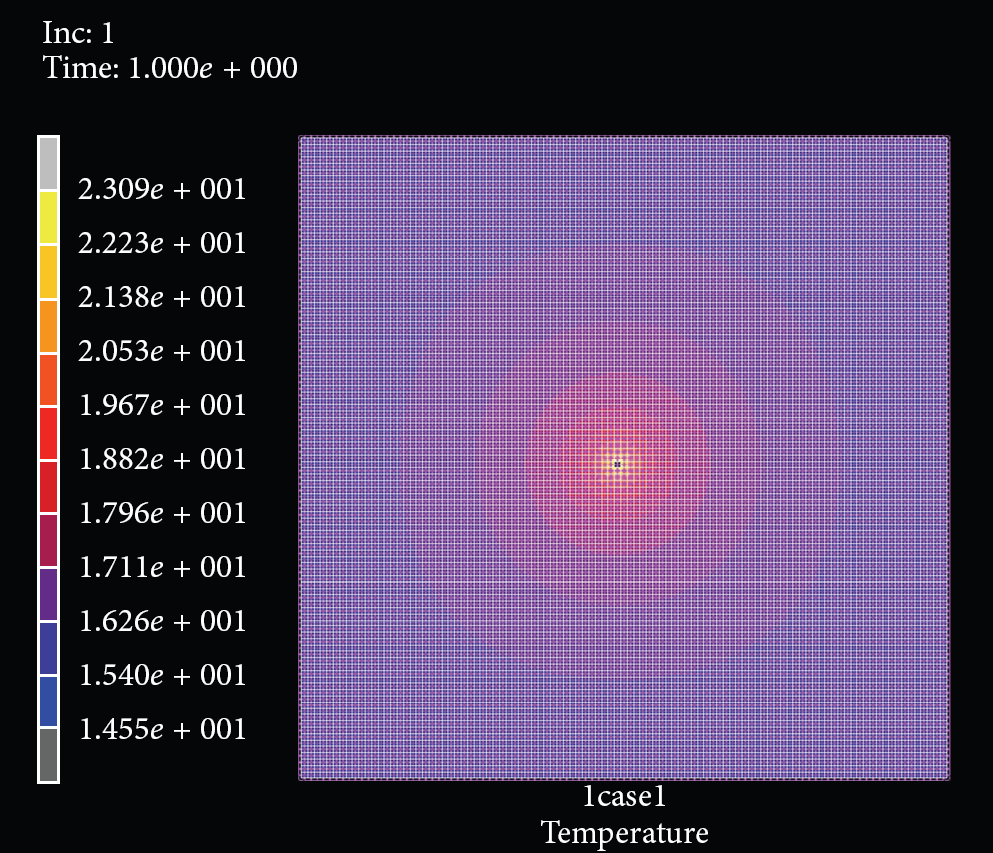
Calculated temperature field in the model I when the heating power q is 6.037 w/m (Unit: °C).

Calculated temperature field in the model II when the heating power q is 6.037 w/m (Unit: °C).

Calculated temperature field in the model III when the heating power q is 6.037 w/m (Unit: °C).
As can be seen from Table 1, Figures 10, 11, and 12, calculated equilibrium temperature of number 1 optical fiber gradually decreases with the diminution of modeling region r. When
In order to verify the correctness of modeling region, a test is designed. In the test, heating power
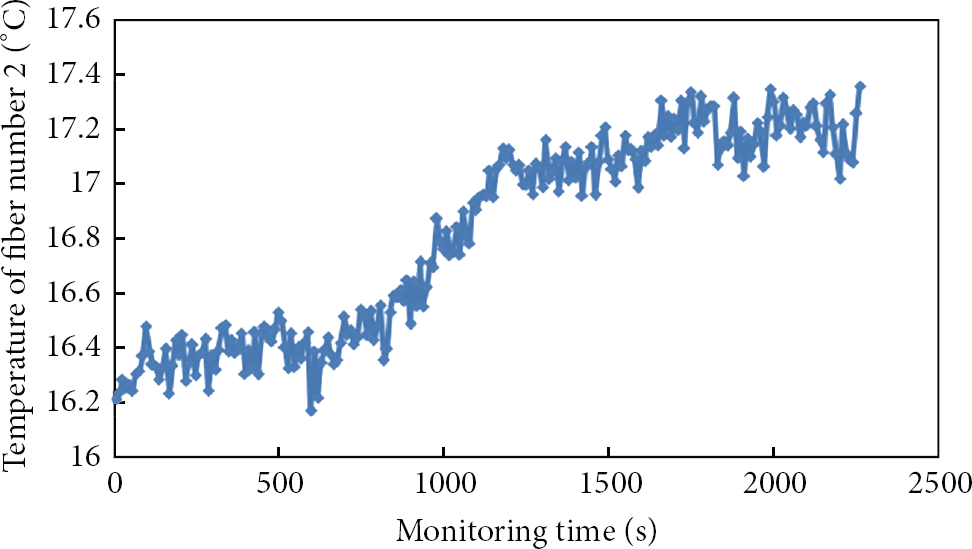
Temperature curve of optical fiber number 2 when heating optical fiber number 1 (
3.3. The Results of Seepage Velocity Inversion
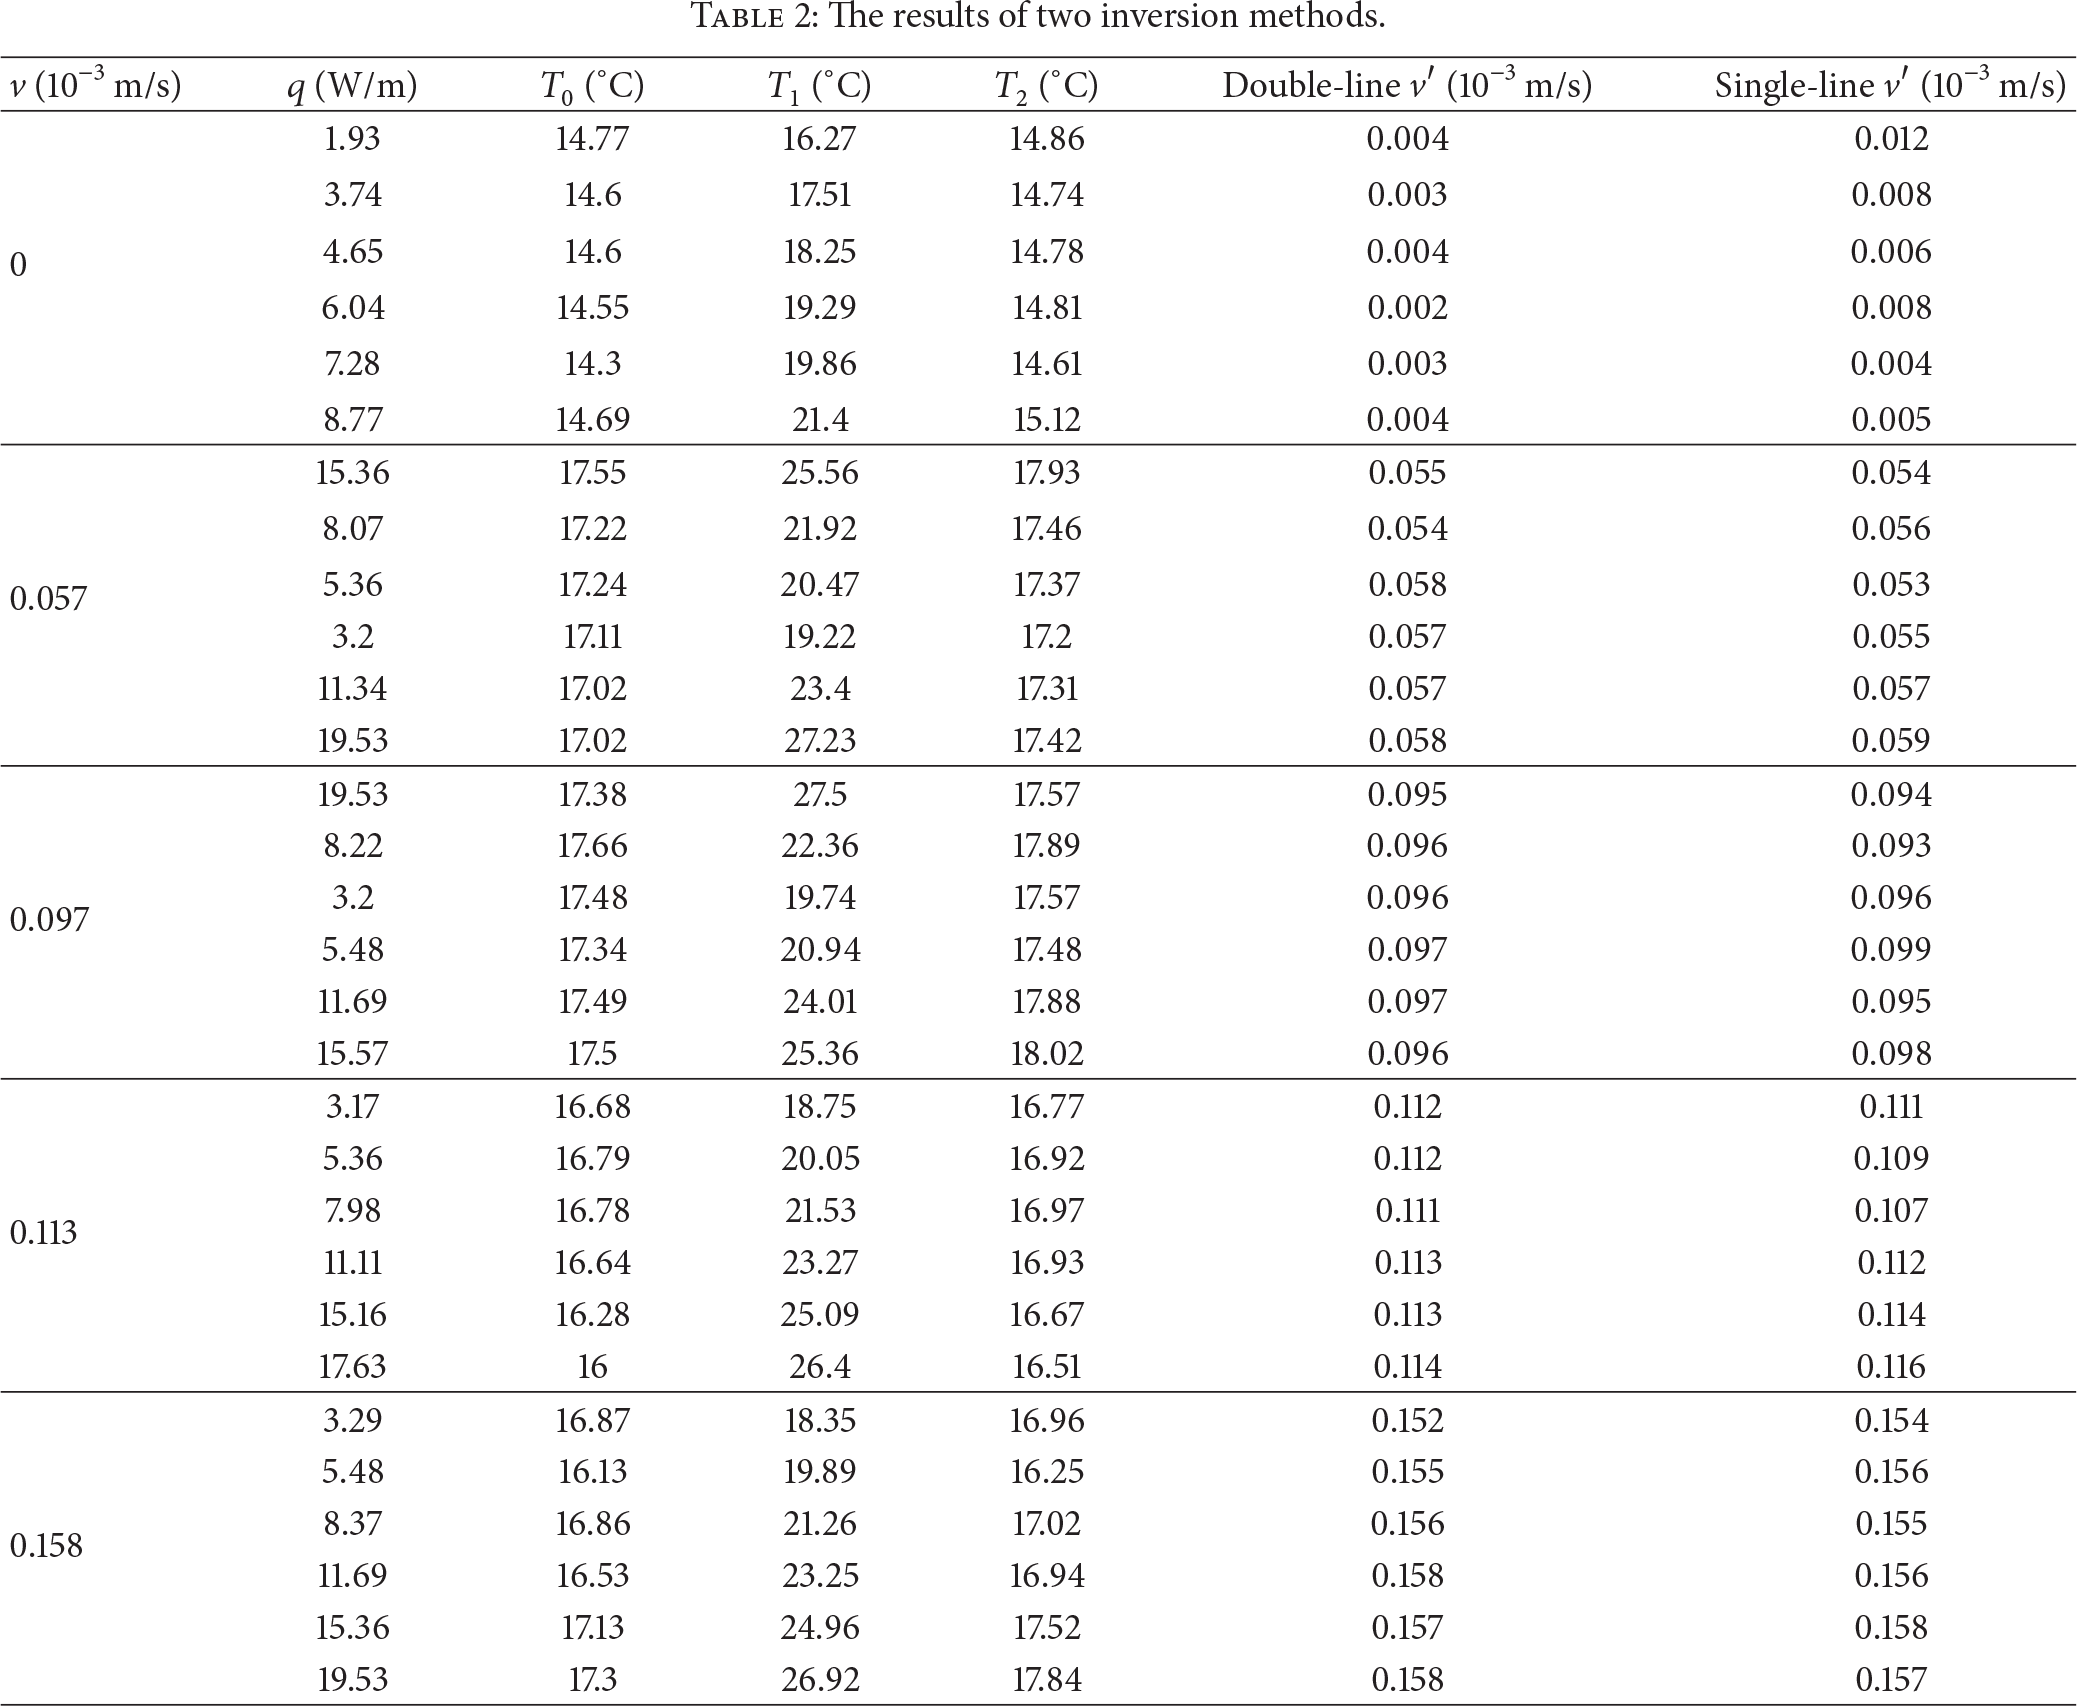
By experimental validation with different seepage velocity and different heating powers, the results of seepage velocity inversion based on double-line heat source method and single-line heat source method are shown in Table 2. As can be seen from Table 2, the results of two kinds of inversion method basically tally with experimental seepage velocity, and the inversion precision of two kinds of inversion method gets higher with increasing heating power. The inversion precision of two kinds of inversion method can meet the need of actual engineering, and the inversion precision of double-line heat source method is higher than the one of single-line heat source method, but it needs to embed more optical fibers based on double-line heat source method in actual engineering.
The results of two inversion methods.
4. Distributed Optical Fiber System for Monitoring Seepage
4.1. Basic Idea
Seepage is the important indicator of levee safety status. Levee seepage occurrence and development are correlated with soil property, soil gradation, flow condition, and the measures of antiseepage and draining. Seepage can cause dangerous situation, even burst if unable to discover and take the appropriate measures timely. Once seepage occurs, the temperature field in levee soil will redistribute; namely, temperature rise curves of optical fiber will change. According to the inversion methods above, monitoring seepage velocity indirectly can be realized. It needs to pay close attention to changes of temperature field under the influence of seepage velocity, and seepages should be processed to prevent further impact on levee safety. For this point, it is required to build a monitoring system that it can monitor the occurrence of seepage and the seepage state such as seepage flow velocity in real time; and capture position where seepage occurs. Therefore, distributed optical fiber temperature monitoring system can better meet these requirements. Similarly, the distributed optical fiber networks can also real-time monitor stress-strain, settlement, deformation, and crack of levees and buildings across dikes, so as to establish systematic levee intelligent systems for health monitoring, as shown in Figure 14.

Intelligent system for health monitoring of levee engineering.
4.2. Design of the DTS System
The DTS system is made up of the host and the DTS network. The light circuit structure plan of the system is shown in Figure 15. In the actual measurement, the two-channel lights intensity comparison method is used. Namely, demodulating Anti-Stokes scattering curves by the optical fiber Stokes scattering curves, Stokes light, and anti-Stokes light are collected, respectively, and then temperature data can be got by demodulating the ratio of two scattering lights intensity. The 3D temperature field distribution of levee can be got by optimal layout of optical fiber network. In the distributed temperature measurement system for levees, effects of optical fibers under loading and bending, drift of light source, splice loss, and environmental interference on temperature measurement precision can be eliminated with the above methods, and then the levee temperature field can be obtained with higher precision.
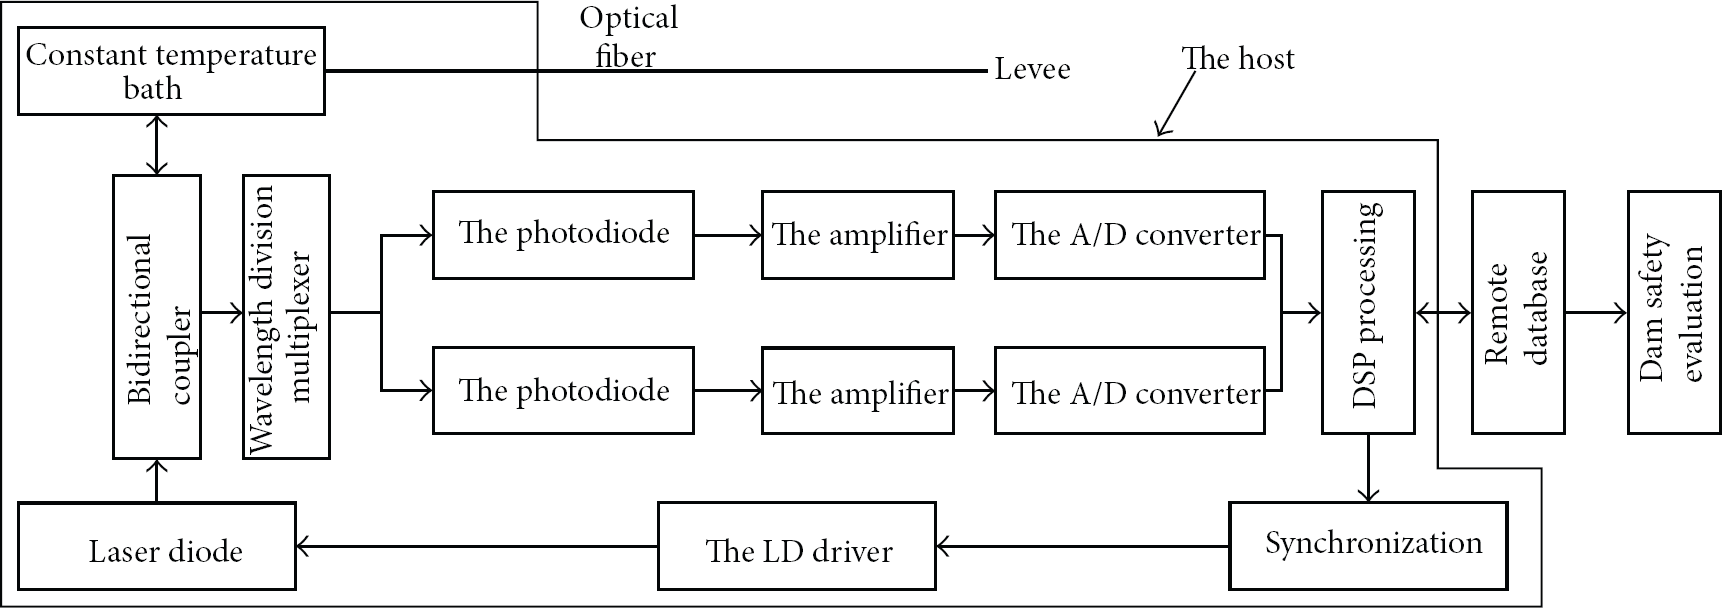
Light circuit structure plan for the DTS system.
4.3. Establishment of the System
With continuing advances in construction technology, levee seepage has been controlled to some extent. However, the water load and environmental factors during levee operation period are unforeseen to a great extent, likely to exceed the design standard. A part of levees are in area with frequent earthquakes, and the design standard of levees cannot take all factors into account. Therefore, under unfavorable load, seepages are prone to take place in some weak parts of levees (such as buildings across dykes and concrete antiseepage wall), eventually affecting levees safety when seepages increase.
Levee safety monitoring technology of distributed optical fiber network has the “potential” to acquire comprehensive and continuous levee safety-related information. But due to the economy, as well as distributed optical fiber monitoring mechanism and capabilities, it needs to distribute optical fiber sensor networks reasonably to achieve the optimized arrangement of distributed optical fiber temperature monitoring network. Combining the engineering geologic and hydrological conditions, the possible seepage position of levees can be analyzed under adverse conditions taking advantage of numerical simulation software. In addition, simulation model can also be established using same soil material of engineering in accordance with the principle of proportionality. By applying all possible loads to the model, analysis of levee seepage can be made during operation period. By Finite Element Method (FEM) computation and model experiment comparative analysis, where seepage occurs and seepage may occur can be obtained to optimize the design of sensing optical fiber network layout. In addition to this, it is feasible to increase density of optical fiber network arrangement in weak parts based on past experience for monitoring the joint part seepages. If it is possible to measure the likely seepage location under adverse conditions during operation in the future before construction, distributed optical fiber monitoring system can be arranged during the construction period to acquire the temperature and seepage conditions of internal soil body.
Before levee construction, the distributed optical fiber temperature monitoring system is designed, and the layout of optical fiber network is made in accordance with the design during the construction. Optical fiber temperature monitoring system can analyze the temperature rise of internal soil body for predicting seepage. Once there are temperature rise anomalies in some parts, it is able to analyze and locate the seepage timely. When seepage does not affect the overall performance and safe operation of levee, real-time monitoring and quantitative analysis for the levee seepage can be made based on nominal thermal conductivity method, and if seepage increases, measures should be taken promptly to control it.
Optical fibers are embedded in some soil layers of levees, and all optical fibers are connected together, constituting a three-dimensional distributed optical fiber sensor networks. A host computer of optical fiber monitoring system can be arranged for each layer or adjacent layers, which is similar to the body's central nervous system. And information is transmitted through optical cables to a central control room, which is similar to the human brain, making analysis and response according to collected information. Due to the optical fiber sensor networks, installment will have an impact on construction progress to some extent, so it only needs to increase density of optical fiber network arrangement in some parts such as the soil under normal water level and high probability of seepage. If the distributed optical fiber sensor network is compared to the human nervous system, increasing density of optical fiber network arrangement where seepage may occur can be compared to human body parts with more nerve endings. Intelligent system of distributed optical fiber for levee seepage prediction and monitoring is built, and its data collection and analysis process are shown in Figure 16.

Safety monitoring system of levees based on distributed optical fibers.
As can be seen from Section 3, the heating power is bigger, the temperature rise is larger, and the result of experiment is better. However, the practical operability for projects must be took into account, such as the problem of the total heating power for entire optical cable. On the one hand, if heating power is too big, it will be dangerous and its cost will increase. On the other hand, if heating power is too small, temperature rise of optical cable is not obvious, and the influence of ambient temperature is also big. For large hydraulic structures such as levees, heating power must be controlled in the appropriate range.
5. Conclusions
Through the optimization of optical fiber networks layout, real-time seepage monitoring of levees can be implemented, and the location and relevant information of seepage can be achieved according to the analysis of anomalous changes in temperature field based on the inversion methods above. The effectiveness and feasibility of the monitoring method is verified by the test designed. Distributed optical fiber sensing system is able to monitor the occurrence and development of seepages, continuously and three-dimensionally, achieving real-time, online and automatic safety monitoring of levee engineering. Optical fiber intelligent monitoring system will improve the current situation of safety monitoring of levee engineering on the basis of its unique superiority. However, the following issues still need further research.
The compatible issues of laying optical fiber with construction for new levees and how to establish distributed optical fiber monitoring system for the constructed projects are the technical problems need to be solved. In view of the long distance of levees and complex geological and environment conditions, how to optimize distributed optical fiber layout in levees has significance to reduce engineering cost and for engineering safety. The calculation of seepage flow velocity based on the inversion methods, with more assumption and simplification, is a numerical model with measured temperature data. How to ascertain seepage flow velocity, taking environmental, hydrological, and geological factors into account, is an urgent and practical issue of distributed optical fiber for monitoring seepage. There are many buildings across dykes and concrete antiseepage walls in levee engineering, where seepages are prone to take place. Therefore, how to strengthen the seepage monitoring and research of soil-stone joint parts in levees is also a key issue for levee safety monitoring.
Footnotes
Acknowledgments
This research has been partially supported by Jiangsu Natural Science Foundation (SN: BK2012036), Non-profit Industry Financial Program of MWR (SN: 201301061), National Natural Science Foundation of China (SN: 51179066, 51139001), the Program for New Century Excellent Talents in University (SN: NCET-10-0359), and the Specialized Research Fund for the Doctoral Program of Higher Education of China (SN: 20130094110010).