
Abstract
Nowadays mobile activity recognition (AR) has been creating great potentials in many applications including mobile healthcare and context-aware systems. Human activities could be detected based on sensory data that are available on today's smart phone. In this study, we consider mobile phones as an independent device since sending the data to central server can generate privacy issues. Furthermore, applying AR on mobile phone does not only require an effective accuracy rate but also the lowest power consumption. Normally, an AR model learnt from acceleration data of a specific person is distributed to other people to recognize the same activities instead of generating different models individually. This work often cannot create accurate results on the prediction in broad range of participants. Moreover, such AR model also has to allow each user to update his new activities independently. Therefore, we propose an algorithm that integrates Support Vector Machine classifier and K-medoids clustering method to resolve completely the demand.
1. Introduction
Currently, mobile-based AR has been applied widely in various technological aspects to enhance the quality of life. In healthcare applications, it has been used to assess physical activities and aid cardiac rehabilitation, detect a fall event as in our achievement [1], predict user's energy consumption based on monitoring activity of daily living (ADL), and generate daily, weekly, and monthly activity reports in order to promote health and fitness. In context-aware pervasive computing systems, mobile accelerometer has gained significant achievements. In term of user's device security improvement, gait recognition is studied as a potential protection mechanism [2, 3]. Moreover, human activity information can also be used to adapt automatically the behavior of using mobile phone. It can include sending calls directly to voicemail if a user is bicycling or jogging, turning on music when jogging is taken place, and so forth. In order to gain these benefits, mobile phone accelerometer data must be processed at device or central server via communication channels (Wi-Fi, Bluetooth, etc.). In this study, we consider mobile phones as an independent device since sending the data to central server from mobile device can generate privacy issues [4]. Normally, there are 3 steps in AR. First, data windows from segmentation of accelerometer signals are taken. Second, some features that describe the clearest properties of studying activity are extracted. These preprocessing steps are the most important parts of AR system since the last step is classification that can be studied by any existing machine learning algorithms.
Some recent mobile achievements attempted to recognize ADL as in [5, 6]. However, these achievements also remain restrictions including the instability of accuracy especially in cross-people prediction which measures the sustainability of classification features in predicting activities of new people based on a trained model from a specific person and lacking of evidence about energy consumption since mobile devices are powered by limited energy resource and memory storage. To resolve these problems, in our latest studies [7, 8], we proposed (1) an effective classification feature extraction to balance accuracy and energy consumption and (2) an adaptive strategy for energy saving by selecting appropriately the combination of feature classification (CF) and sampling frequency (SF) for each activity.
From our previous achievements, classification models were created offline from the training data and ported to different mobile users to measure the tolerance of the classification. However, in fact it is hard to generate a unique model that can classify all users' motion activities in a large scale of participants.
This issue was denoted in our previous achievement as in Figure 1. The overall accuracy descended significantly when we increase the number of subjects. Moreover, an effective mobile AR system should allow users to update their own new activities instead of only predicting predefined activities. Addressing these needs, we propose an algorithm to achieve the following goals:
enhancing the personalization in mobile AR system for predefined activities based on the actual data of its owner; allowing new activities that are updated on each mobile user.
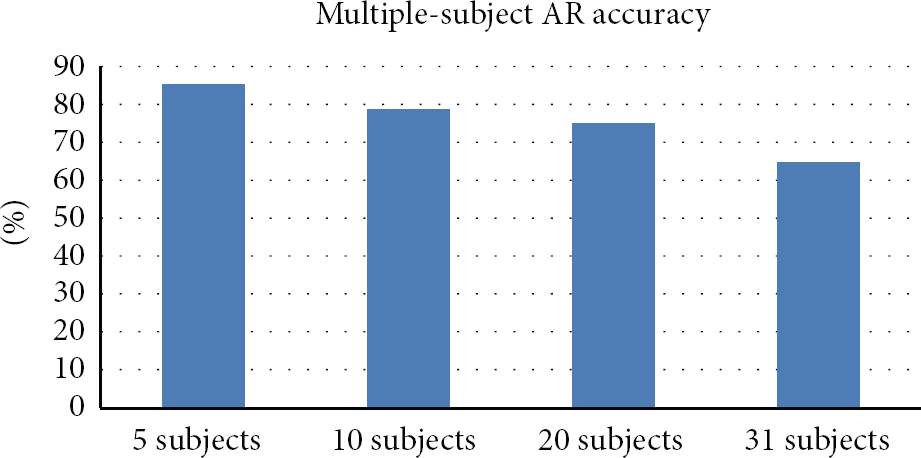
Accuracies of mobile AR system in multiple-subject prediction type on SCUT-NAA dataset in our achievement [8].
Applying AR on mobile phone is not like applying on power machine. It not only requires effective accuracy but also guarantees the lowest power consumption. Therefore, we propose the following methods.
Firstly, we propose an effective real-time mobile AR system. Its preprocessing phase includes motion analysis on Y- and Z-axes from mobile triaxial accelerometer and segmenting on main Y-axis based peak detection algorithm. Proposed classification features in each window are extracted in time domain. Section 3 presents this core system. A personalization algorithm is presented through the method that selects confident samples to update the existing model. The proposed algorithm is integration of SVM classifier and clustering algorithm. In this study, clustering algorithm is aimed to explore two common partitioning methods—K-means [9] and K-medoids [10]. Section 4 presents our personalization method.
ADLs in this study include walking, jogging, bicycling, going upstairs and downstairs, and running while the phone is attached at front pant pocket of mobile user. Experiments of our two main contributions are presented in Sections 5 and 6, respectively. Finally, Section 7 gives our conclusion.
2. Related Works
A few recent AR achievements, like ours, did use a commercial mobile accelerometer to measure real-time running capability of mobile phone without sending data to central server. The authors in [11] achieved 75.3% and 73.95% in walking, jogging, upstair, and downstair activities by using J48 and Multilayer Perceptron. By using iPhone accelerometer, the authors in [12] predicted walking, running, biking, and driving activities with average accuracy to reach 93.88% by using SVM. However, driving is similar with relaxing activity which does not have significant changes in acceleration. Therefore, prediction becomes easier. Other authors in [5] had restrictions in detecting upstairs and downstairs activities.
According to on-board training on mobile phone as the classification model is created individually on every user [11, 13], this approach can allow users update their own new activities. However, a sufficient training sample quantity must be collected on each phone user that could cause unexpected inconvenience. Thus, an implicit method that allows personalization on predefined activities and updating new activities is necessary in user's mobile AR system.
Based on transfer learning technique [14], personalization issue was also recently studied on mobile [15]. In this approach, K-means is used to select confident samples, and the convergence of personalized model comes from comparing parameters inside the model at two continuous iteration steps. In our solution with another approach, the equality of confident samples at the steps is considered as a stopping condition in the personalization phase. With the core SVM classification, we measure the performance of clustering methods among the K-means and K-medoids through the presented targets.
In our study, the targets are denoted as in Figure 2. Model A is generated from user A's data on specific activities. The model is then distributed to other users with essential demands including personalizing these activities and updating new activities for each user independently.

Distribution model A to users and demands of personalization and updating new activities.
3. Mobile AR System Based on Gait Cycle
In this study, we paid particular attention to front pant pocket because of the popularity of attaching phone at this position. The mobile phone was vertically placed at the pocket location as shown in Figure 3. From three axes of accelerometer, the X-axis captures horizontal movement of the user's leg. The Y-axis captures the upward and downward motion; the Z-axis captures the forward movement.

3-D coordinate of accelerometer and phone attached to the trouser pocket position.
3.1. System Overview
A flowchart of the proposed mobile AR method is depicted in Figure 4. Only effective axes of mobile accelerometer that presents the most clearly gait cycles in human motion are used. A set of features is extracted on time domain after passing preprocessing steps. SVM classification is used in our core system.
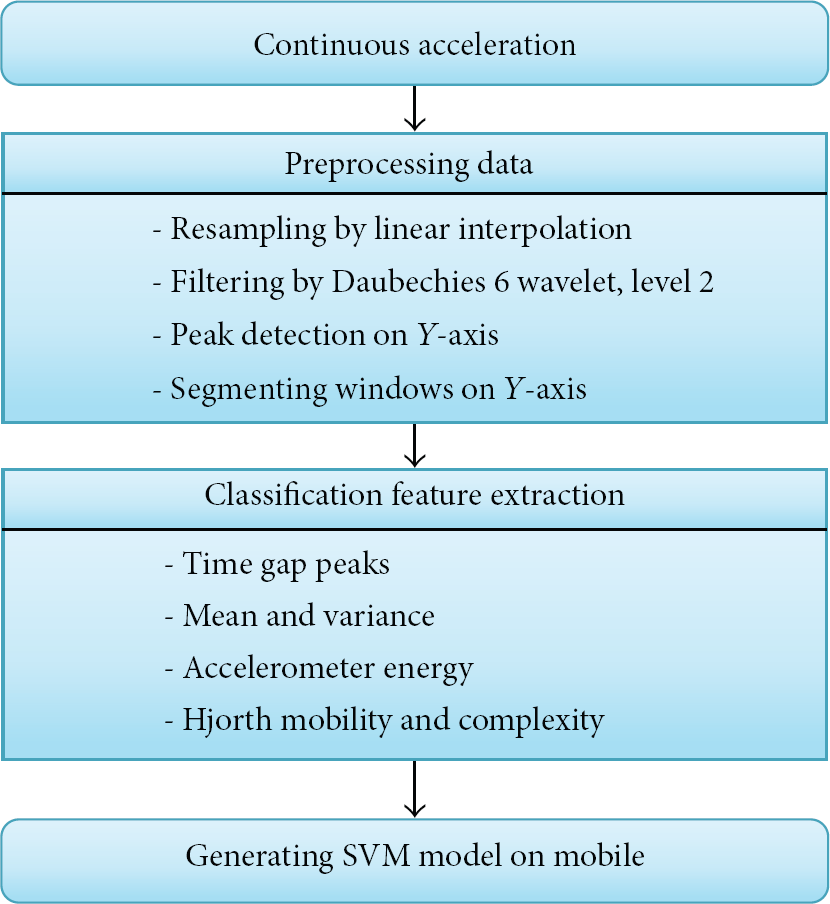
A Proposed method for real-time mobile AR system.
3.2. Effective Axis Selection
Gait cycle notion is used to explain the combinative force that is recorded by mobile accelerometer. The notion is defined as the time interval between two successive occurrences of one of the repetitive events when walking. In other words, two consecutive steps form a gait cycle. As shown in Figure 5, the cycle starts with initial contact of the right toe, then it will continue until the right toe contacts the ground again. The left goes through exactly the same series of events as the right, but displaced in time by half of a cycle.

An illustration of a gait cycle.
When the toe touches the ground in phase “a” or phase “g” as in the figure, the association between ground reaction force and forward inertial force together makes the Z-axis signal strongly changes and forms peaks with the high magnitude. In fact, in order to make changes of Z-axis we need the change of Y-axis beforehand since heel touches the ground. It explains why we always have peaks of Y - and Z-axes like negative peak, and positive peak respectively, as illustrated in Figure 6.

Amplitude in X-, Y-, and Z-axes.
From our observation, we realized that ground reaction force is expressed most clearly especially in jogging and upstair, downstair activities by negative peaks. Therefore we consider Y-axis signal as the main axis. The first window segmentation is started by the first peak on Y-axis instead of choosing first point of the window. This reflects clearly properties of activities since it shows how many peaks existed in one window so that it enhances accuracy in matching method. In overlapping of windows, a next window is still started at a peak which occurred in previous window.
Other values on Z-axis are just selected at the same time with Y values. A gait cycle is defined between two consecutive peaks on Y-axis.
In previous studies [5, 6, 11, 16], windows can be segmented from arbitrary points which only guarantee the length of the window. This might cause an incorrect reflection of human activities on each gait cycle. Thus, the segmentation method based on Y peaks is used in our study to extract clearly gait cycle's features.
3.3. Linear Interpolation
Due to power saving function and the built-in nature, an accelerometer on mobile phone is simpler than standalone one. The sampling rate is rather low. Time intervals between two consecutive acceleration values are also not equal. A sensor only generates value when the forces acting on each axis have a significant change. Therefore, we interpolated the acquired signal to 32 Hz (Figure 7) using linear interpolation method to ensure that the time interval between two sample points will be fixed.
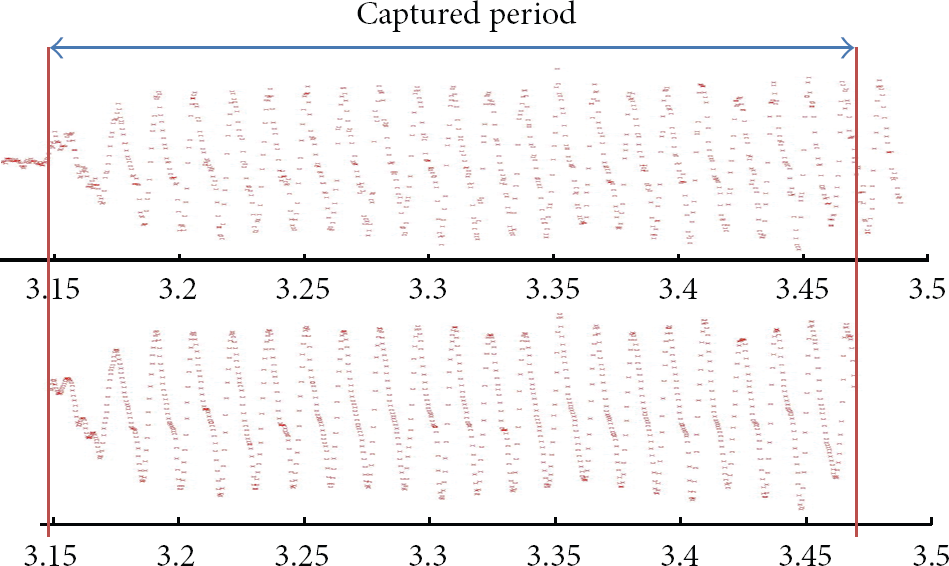
Before and after using linear interpolation into 32 Hz on Y axis.
3.4. Noise Elimination
When accelerometer samples movement data by user walking, some noises will inevitably be collected. These additional noises could have come from various sources (e.g., idle orientation shifts or bumps on the road while walking). A digital filter needs to be designed to eliminate noises. Multilevel wavelet decomposition and reconstruction method are adopted to filter the signal.
According to Figure 8, original signal is denoted by
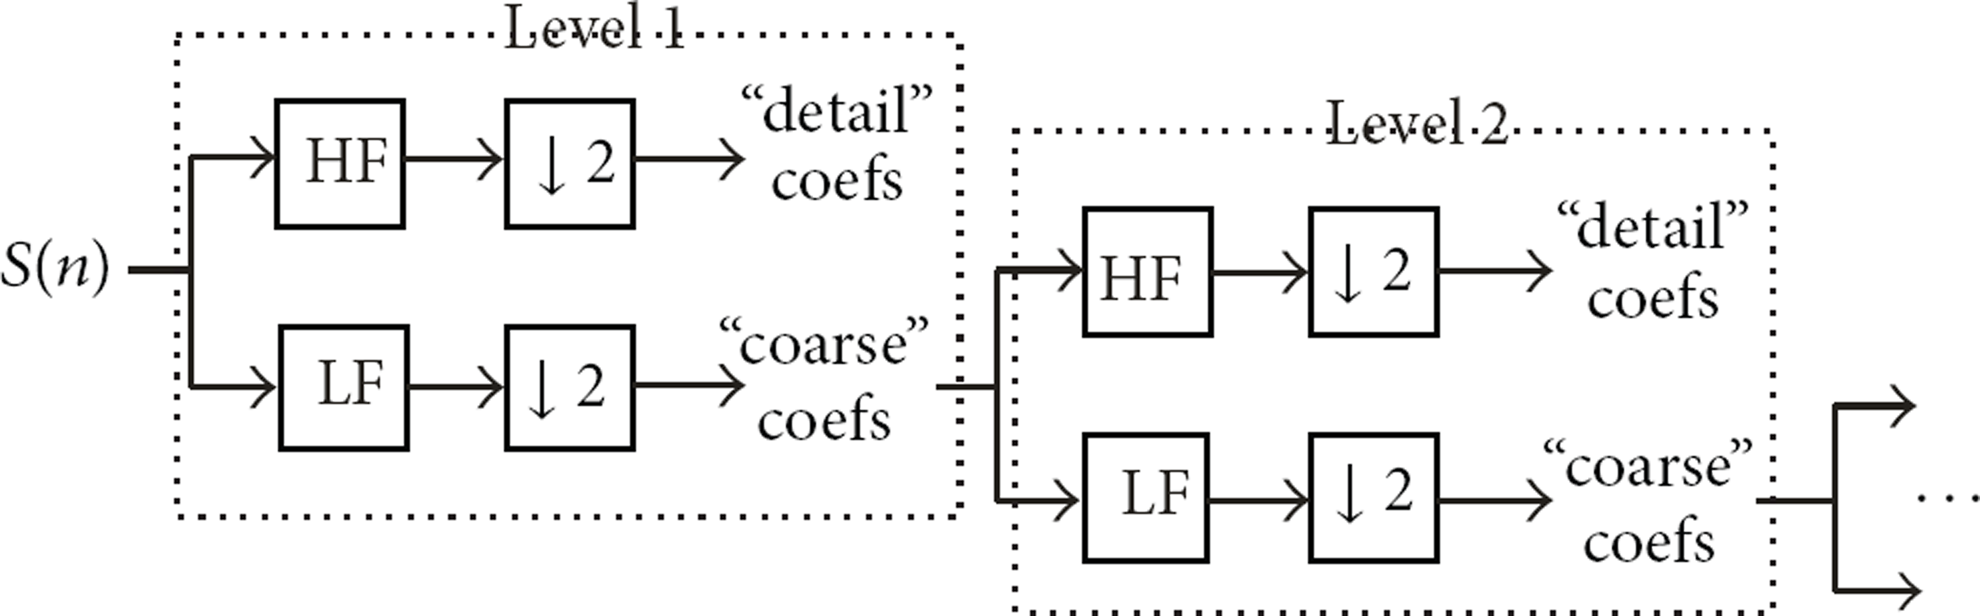
Multi-level wavelet decomposition.

3-D acceleration after noise reduction.
3.5. Peak Detection Algorithm
In order to segment window based on Y axis peaks, we designed an algorithm to detect these peaks as follows.
The original signal is denoted as


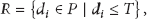
Illustration of true peaks R and the thresholds T with various k values on Y axis.
3.6. Classification Feature Extraction
Features in our proposed method are extracted in time domain. Each window is segmented by a 256-sample length and the overlapping of 128 data points between consecutive windows. First window is started at the first peak on Y axis in a specific analyzing period of continuous acceleration data.
The following time features (TFS) on sliding windows are chosen in order to record the most clearly gait cycles on each window. They are extracted on effective Y- and Z-axes, and this is different from [6, 11, 16] since these achievements used features on all axes.
Time Gap Peaks. An average value is computed between two consecutive peaks. This value is only computed on main Y axis. Mean and Variance Acceleration. Mean value is a numerical average of the acceleration values. Variance value shows the mount of variation of the values in the same window. Accelerometer Energy: This value was also introduced in [5, 17]. Since sampling frequency rate was stable by using linear interpolation, this energy value shows amount of the change on a physical activity. Its value has a significant difference among activities like changes in jogging occurred in both of Y- and Z axes but the concentration only focuses on Y axis in bicycling. Equation dedicating it in a window size T is presented as
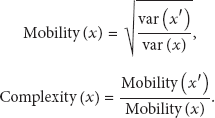
Hjorth Mobility and Complexity. In electroencephalography (EEG) signal analysis, Bo Hjorth [18] derived certain features that describe the EEG signal by means of simple time domain since this signal cannot be associated with the sine function used in frequency domain. These parameters, namely, Activity, Mobility, and Complexity, were used to characterize the EEG pattern in terms of amplitude, time scale, and complexity. These values were applied in [5, 19] for emotion assessment and also in accelerometer, respectively. Mobility is a measure of the signal mean frequency. Complexity measures the deviation of the signal from the sine shape. Both values are scalar features performed as follows with
From analyzed TF features, our classification is acted by using SVM classifier which is used widely in AR [5, 16]. SVM algorithm is set of support vectors which separate training samples to a corresponding class by maximizing margin of hyperplanes among classes. In this work, we use Radial Basis Function (RBF) kernel in order to map support vectors to multiple dimensions since there are eleven TF attributes.
4. Personalization in Mobile AR System
An AR model is firstly trained offline on power machine by actual mobile acceleration data on known activities of a specific person through the proposed feature extraction. Personalization on mobile AR system in our method is studied on two phases. Firstly, the system has to allow users to update their own new activities. Secondly, in the context of sharing the trained model, the system has to update implicitly and suitably activities trained on that model. This is to predict accurately activities of new users since each person has different ranges in data distribution.
4.1. On-Board Training Undefined Activities
Generating individual model for each person causes a large data acquisition and inconvenience for mobile users in reality. Thus, as the simulation shown in Figure 2, the phone on person B uses the model
4.2. Improving Personalization in Predefined Activities
In the scope of a small user group, a user's trained model could recognize the data of other people with acceptable accuracy rates. However, in fact, it is hard to generate an effective model that can classify all users' motion activities in a large quantity of participants; this means that the trained model is not sustainable for a really new person because of the different data distribution among participants. Thus, the solution of taking an effective amount of unlabeled data of person B for personalizing not only makes more convenience but also enhances prediction ability for those who use this model instead of keeping fixed accuracy.
With activities trained on
Our solution for this issue is combining an effective clustering algorithm and SVM classifier together. Firstly, we build model A with labeled samples of person A. The model is then transferred to person B's phone. Secondly, we classify the unlabeled samples of person B to model A. These data are then used to adjust model B based on choosing confident samples for updating model A. These steps are represented as in Figure 11.

Our algorithm for personalizing on predefined activities.
In the first step, user B's samples

In second step, clustering algorithm is a division of samples into group of similar objects. Objects possessed by the same cluster tend to be similar from their feature set

Each partition is represented by either a centroid or medoid. A centroid


(1) (2) (3) classify( (4) cluster (5) distance( (6) closest to its center point. Update label Add these data to Confidence_Samplelist
(7) update( (8) (9)
At step (1), model
5. Experiment Results in Mobile AR System Based Gait Cycle
SCUTT-NAA dataset [16] and our self-constructed data are used in our experiment to measure the efficiency of our real-time AR mobile system and personalization algorithm.
5.1. With SCUT-NAA Dataset
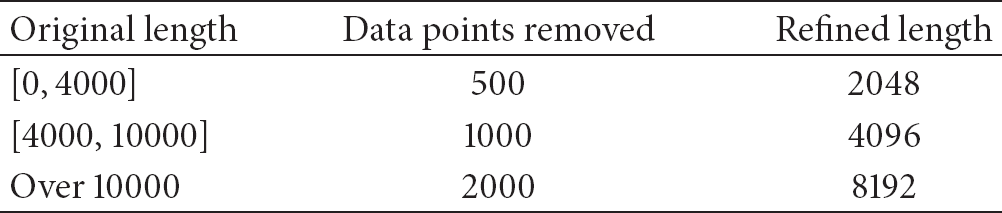
SCUTT-NAA dataset contains 1,278 samples from 44 subjects. It was collected from ADXL 330 Accelerometer and sampling frequency is 100 Hz. Because of the limitation of activities in our study, the dataset only provides fully in 31/44 subjects. Each subject experimented two times. In preprocessing phase, some last data points in each experiment time of these subjects were removed because these points almost could not present clearly a specific activity's change. Moreover, since our noise elimination step requires a
Original and corresponding refined lengths.
After that, a Daubechies level 3 filter is applied in this step to gain certain information in the change of each activity. Next, peaks on Y axis are detected to segment windows. In this dataset, we found that positive Y peaks could describe more clearly than negative peaks on the same axis. As our best analysis, this phenomenon can be explained such that the author of this dataset placed accelerometer's direction different from our built-in mobile accelerometer. Therefore, our peak detection algorithm is changed a little bit including replacing (1), (2) and (3), respectively, as follows:

Moreover, the interval between true two consecutive peaks has to be greater than 29 data points. We did not choose overlapping method on sliding windows since there was a large data length in each activity of subjects. We separate 512 samples per window. Each window is started from a Y axis peak which is the nearest peak to the last one of previous window. LIBSVM was used to train and predict activities in the dataset and our data.
Figure 12 shows overall accuracy from our four methods and Xue and Jin [16]. By using SVM with RBF kernel, our TF method shows stable accuracy in predicting the activities. Our contribution in this work is expressed by removing last points in data, selecting effective Y- and Z-axes without using X-axis, selecting different filter, and segmenting windows from peaks on main Y-axis. To the best of our knowledge, this is a novel approach to predict accurately ADL activities based on mobile accelerometer.
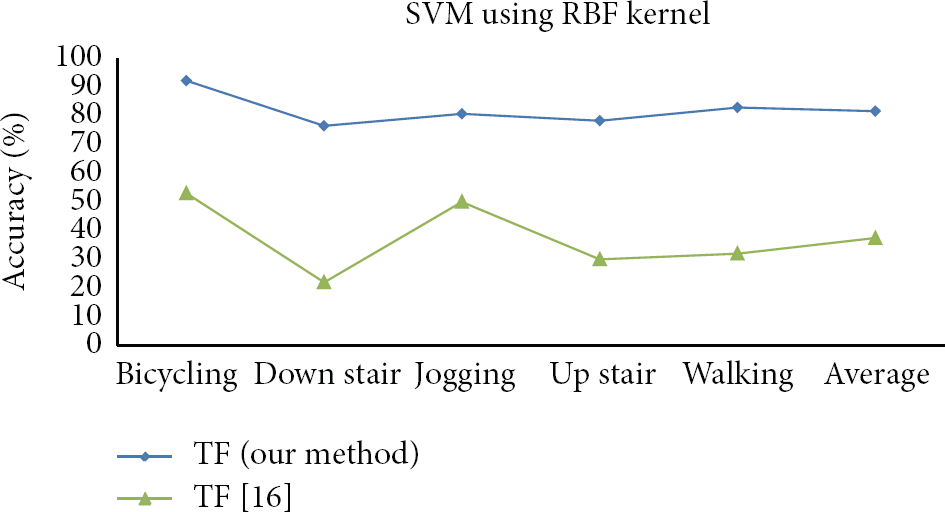
Accuracies in our prediction and Xue and Jin [16].
5.2. With Our Self-Constructed Data
In order to ensure running successfully in real-time environment on mobile accelerometer, we also develop an application for collecting data from triaxial BMA 150 accelerometer on Google Android HTC Nexus One from six volunteers. The mobile device measures acceleration force up to ±2G. The sampling rate is approximately 30 Hz on SENSOR_DEPLAY_FASTEST mode in Android SDK. The data were collected at normal speed of each subject in natural environment. Table 2 shows the numbers of training and predicting data of each activity.
Number of samples per user and activity.

In our data, we used Daubechies at level 2 as noise filtering. Distance between consecutive peaks has to be greater than 23 data points. From the proposed method, our overall accuracies in single and multiple-subject types are shown as in Table 3. The overall accuracies express our contribution in preprocessing phase of mobile AR system based on gait cycles. They guarantee an effective prediction and improve the precision of achievements presented in Section 2.
Accuracies in single and multiple-subject prediction types.

5.3. Efficiency in Real-Time AR on Mobile Users
To measure the performance of our system in real-time running on mobile, we developed two prototypes for this experiment. First prototype uses the proposed method which extracts features in time domain, and the remaining is implemented by using classification features in frequency domain. Public libraries including Android 2.3 OS, Jtransforms, LibSVM, and Weka are used inside these prototypes. Since mobile accelerometer does not collect data when the screen is turned off, our prototypes are developed as a foreground service. Other functions including wireless, light screen were turned off during the experiment. We also developed a power measurement module based on battery event API from Android SDK to record battery's changes. Trained SVM model of each volunteer approximately taking 42KB is ported to SD card of the device to predict new incoming signals. Each prototype takes about 11MB on phone's memory. Its snapshot is shown as in Figure 13.
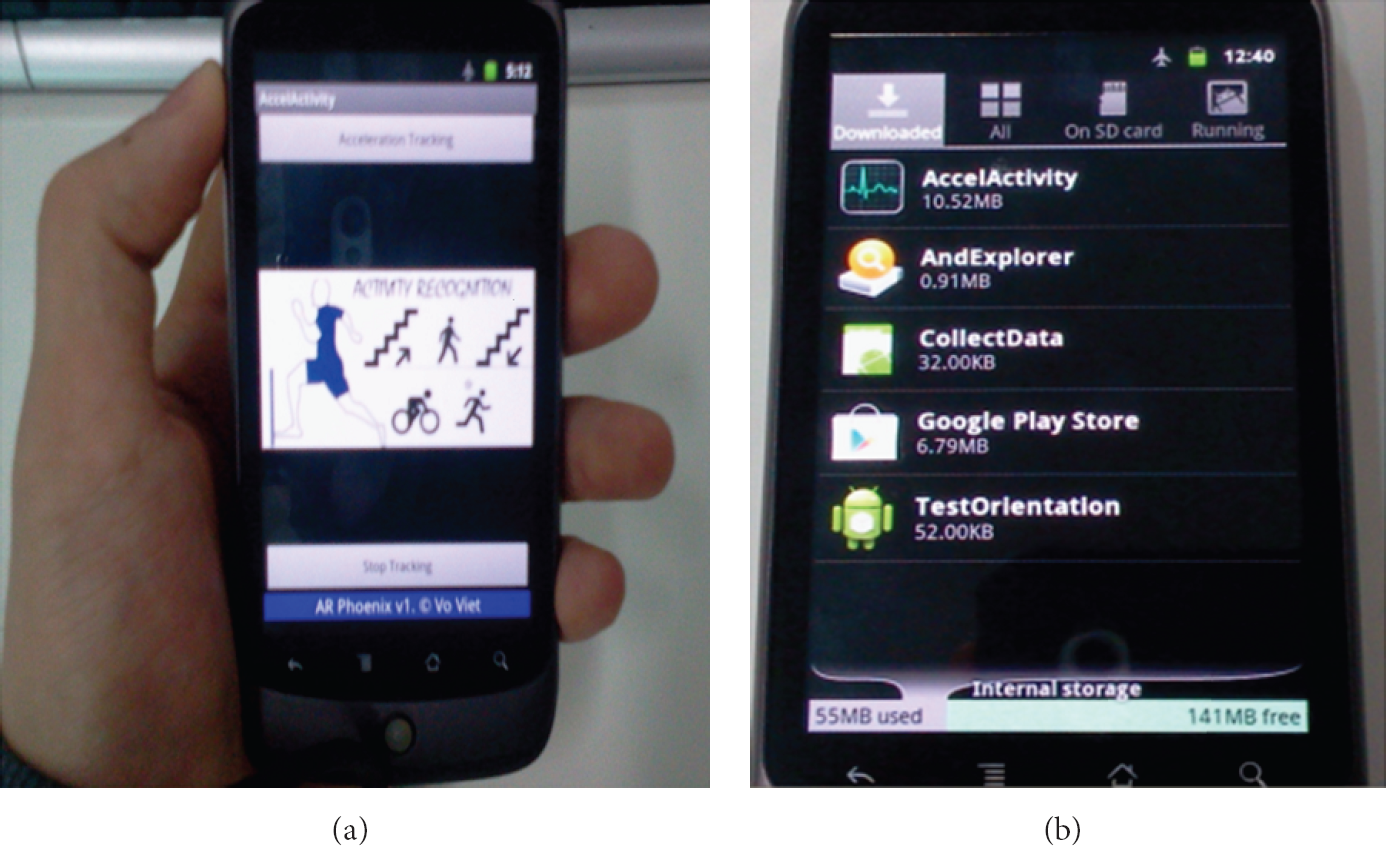
The implementation on HTC Nexus and its volume.
Figure 14 shows average consumptions of two prototypes within 2.5 hours of volunteers. The method using SVM classifier and features on frequency domain consumes much energy than the remaining method in average.

Battery lifetime in two prototypes and normal running.
Moreover, computational complexity on time domain is more effective than frequency domain as follows:

6. Performance of Personalization on Mobile AR System
To illustrate the performance of our algorithm, we verify the personalization algorithm with two subjects who yielded the lowest accuracy from multiple-subject prediction type as shown in Table 2. Experiment is formed by two phases including personalizing predefined activities and measuring the efficiency of the personalized model in predicting new activities.
6.1. Personalization in Predefined Activities
Firstly, we measure the impact of training samples in multiple-prediction type of these two subjects. SVM model A was created by person A from total 148 samples of five activities including bicycling, downstair, upstair, jogging, and walking. In 148 training samples of person A, we divided them into five groups with different sizes corresponding to 30, 58, 86, and 148 samples. Each group is used to train a model and predict all testing samples of person A and person B, respectively. The results are shown in Figure 15.

The impact of training samples of person A.
The accuracy of the SVM model from person A increases significantly when the number of training samples varies from 30 to 86 samples. Otherwise, from 86 to 148 samples, the accuracy increases less than the previous range. In other words, with 86 training samples, we can build well a sufficient model to predict testing of person A. Accuracy of predicting all testing data of person B also increases gradually when we increase user A's training samples because the probability for successful prediction is improved when new data of person B are added more.
In order to observe the effect of K confident samples used for personalizing algorithm in cases of K-means and K-medoids clustering algorithms, we used all 148 training samples of person A to predict different groups of testing data of person B, respectively. We divided testing data of person B into five groups with quantities as in 30, 60, 77, 89, and 106 samples.
Figure 16 shows the accuracies when we vary K and the number of testing samples. For each K case, its accuracy can converge regardless of whether K is small or large when we increase testing samples. It can be explained that new testing samples of a new user are very diverse, and the probability of matching correctly to personalized model can be increased. However, the samples must perform a unique motion style of individual people in each activity. They cannot have quite difference to each other. Moreover, K-means algorithm of personalization process divided separately activities into different groups. These reasons made a convergence in accuracy of a person when we increase testing samples to a sufficient quantity.
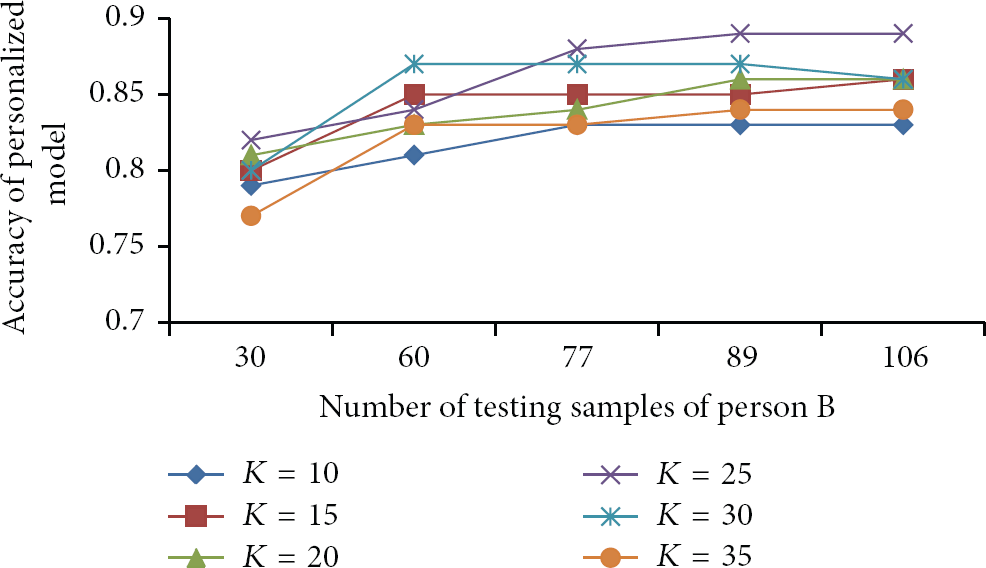
The impact of K confident samples and testing samples in K-means method.
At each quantity of testing samples, changing confident samples can add more noises. Thus, its accuracy can be descended. We found that a value of
Figure 17 represents the performance of K-medoids method. In contrast to the previous method, this clustering method performs stability when we vary number of testing samples. Higher accuracies compared to K-means method in small testing sample groups are achieved. However, when testing sample number is over a 77-sample size, it involves a converging reduction in the cases of K except for the value at 20.

The impact of K confident samples and testing samples in K-medoids method.
In fact, K-medoids method is more robust than K-means in the presence of noise and outliers, because a medoid is less influenced by outliers or other extreme values than a mean, while k-means perform well in processing large data sets with a discrete distribution. In cases of small testing sample groups, the model is updated by crucially correct samples when we select
Performance of K-means and K-medoids.

i: the total number of iterations.
k: the total number of clusters.
n: the total number of samples.
During the test, the user-defined threshold for iteration
6.2. Updating New Activity in Personalized Model
In this experiment, we use two personalized models based on K-means at
The models are firstly trained by 40 running samples. In terms of prediction phase, a quantity of 60 samples on the activity is collected and then divided into four groups with different sizes as in 20, 40, 50, and 60 samples. From Figure 18, we could observe that
the model based on K-medoids method performs the effective tolerance while sample size is varied; a convergence appeared in both methods regardless of increasing testing data quantity from the size of 40 samples. Since there are many activities that need to be updated on the model, more training samples should be on-board trained to maintain an effective accuracy rate.
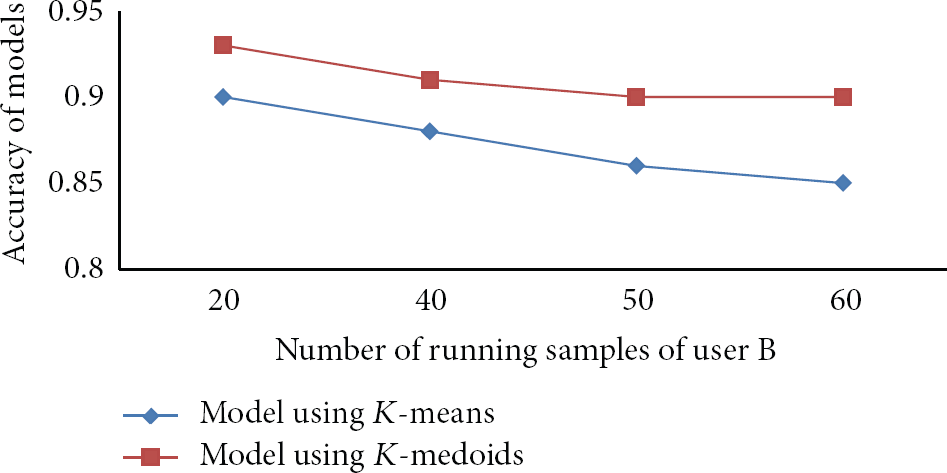
The impact of running testing samples in the models using K-means and K-medoids methods.
7. Conclusions
In this paper, an effective personalization algorithm that integrates SVM classification and K-medoids clustering method is proposed to select confident samples for updating a given AR model. The algorithm's performance is verified through recognizing predefined and new activities. An increasing accuracy of 11% is compared to nonpersonalization approach. The personalization algorithm is developed based on a basic mobile AR system that extracts time domain features from windows segmented by peaks on Y axis. The effectiveness of system is compared to previous achievements in accuracy standard and another system that uses frequency domain features for energy consumption standard.
Footnotes
Acknowledgment
This research was supported by Basic Science Research Program through the National Research Foundation of Korea (NRF) funded by the Ministry of Education, Science and Technology (2012-035454).