
Abstract
The effect of driver's physiological and psychological characteristics on traffic safety is represented mainly as driver's propensity. Previous researches focus mostly on psychology test and its influence on traffic safety from relative static and macroscopic perspective. However, in the field of vehicle active safety, there are few studies on driver's affective measurement and computing from microcosmic and dynamic perspective, and previous researchers did not consider the influence of environment. The emphasis is about situation factors which directly influence driver's affection in all environment factors under two-lane condition. Various experiments are designed to collect driver's microdynamic information, and characteristics of driver's propensity toward different environments are extracted using genetic simulated annealing algorithm. Results show that the method can provide a basis to establish dynamic recognition model of driver's propensity further which is adapted to multilane environment.
1. Introduction
The effect of driver's physiological and psychological characteristics on traffic safety is represented mainly as driver's propensity. Previous researches focus mostly on psychology test and its influence on traffic safety from relative static and macroscopic perspective. However, in the field of vehicle active safety, there are few studies on driver's affective measurement computing from microcosmic and dynamic perspective, and previous researchers did not consider the influence of environment changes.
In the driver's psychology test and its influence on traffic safety aspect, many scholars have done some researches. Rowe et al. [1] reported the construction of a self-report Violation Willingness Scale for predrivers, examination of the existing Attitudes to Driving Violations Scale in predrivers, and some preliminary data on the development of propensity to risky driving. Sang and Li [2] established the Psychology Fatigue Measurement System. Critical flicker fusion test, perceptual speed test, distribution of attention value test, and reaction time test were used to test bus drivers. As a conclusion, changes of each index obeyed normal distribution and changes in indicators were independent. Pêcher et al. [3] assessed the effect of music's emotional valence on driving behaviour. Results showed that happy music distracted drivers the most, as their mean speed unexpectedly decreased and their lateral control deteriorated. Sad music influenced drivers in a different way, as they drove slowly and kept their vehicle in its lane. Di Stasi et al. [4] aimed to uncover whether emotional auditory stimuli could affect risky behaviour in hazardous situations. These results suggested that auditory warning systems for vehicles should avoid using emotion-laden sounds, as their affective content might diminish their utility to increase driving alertness. Trick et al. [5] studied the influence of short emotion on risk perception and steering. Chan and Singhal [6] examined the potential for driver distraction from emotional information presented on roadside billboards. The research suggested that drivers had lower mean speeds when there were emotional words compared to neutral words, and this slowing effect lasted longer when there were positive words. Gwyther and Holland [7] explored whether drivers adopt self-regulatory behaviours and examined the effects of affective and instrumental attitudes on self-regulation across the lifespan. Results suggested that younger and older drivers reported higher scores for self-regulation than middle-years' drivers. Taubman-Ben-Ari [8] examined the effects of positive emotion priming on the willingness to drive recklessly. Positive emotions of a relaxing nature, as well as thinking about the meaning in life, lowered the willingness to engage in risky driving. Abdu et al. [9] examined the direct causal relation between situational anger and driving choices and abilities. In conclusion, it appeared that state anger affected driving behaviour by increasing risk taking, without necessarily compromising the skilled driving behaviour at least in emergency situations in simulated driving. Lu et al. [10] explored how and why anger and fear influenced driving risk perception. Results showed that anger reduced risk perception, whereas fear increased it. Rhodes and Pivik [11] examined the relationships among risk perception, positive affect, and risky driving. Interactions of positive affect and perceived risk with gender and age showed that positive affect more strongly predicted risky driving for teen and male drivers than for adult and female drivers. Hu et al. [12] explored how two states of affect, emotion and mood, would influence driver's risky driving behavior through risk perception and risk attitude. Negative emotion significantly elevated drivers' risk perception, but such perception failed to develop an appropriate attitude for drivers. In the studies of Roidl et al. [13] different combinations of goal congruence, goal relevance, and blame influenced participants' emotions. Anger, anxiety, and positive feelings, such as hope, relief, and satisfaction, were related to the situational factors. Mesken et al. [14] investigated the frequency, determinants, and consequences of three relevant emotions in traffic. Based on appraisal theory, it was predicted that the combination of three appraisal components (goal congruence, blame, and threat) affected the occurrence of anger, anxiety, and happiness. Schmidt-Daffy [15] concluded that cautious driving behaviour could be guided either by fear or anxiety. In Nesbit and Conger's [16] study results suggested that higher aggression drivers demonstrate a different pattern of affective experience, problematic cognitive tendencies, and subsequent negative outcomes in comparison to those reporting lower levels of aggression. Wang et al. [17] found that the safety-based approaching behavioural model could be used to analyze driver's car-following behaviour for driving support and to reveal the essence of traffic flow characteristics at the microscopic level. Cai and Lin [18] presented an emotion and performance relation model in a virtual driving environment. It could be used to predict operators' performance degradation based on the observed transition of emotions. Leu et al. [19] established a behavioral model in an artificially multiagent environment to implement the real-time formation of drivers' mental states and hence the context-generated decision making in different traffic conditions.
Wang and Zhang [20, 21] have conducted the primary and explorative studies on some special situations, such as free-flow and car following, without fully considering influence of changing environment. However, characteristic vectors of driver's propensity are changeable in multilanes environment, different environment complexities correspond to different dividing methods and different characteristic vectors. Therefore, characteristic data and recognition model should change with environment. In multilane environment, driver's microdynamic information of each propensity type in different vehicle groups can be obtained by the calculation of physiological rhythm and various tests. Various tests include character test, dynamic measurement test of driver's physiology and emotion, and real vehicle test. Characteristics of driver's propensity in different environments are extracted using genetic simulated annealing algorithm, and the characteristics provide a basis to further establish dynamic recognition model of driver's propensity which is adapted to multi-lane environment.
2. Analysis of Vehicle Group Complexity
Vehicle group consists of dynamic transportation entity. It plays a decisive role in driver's behavior. Obviously, different vehicle position has different influence on target vehicle's driver. Within areas of influence, the front vehicle on the same lane has the largest effect, followed by the around vehicles on the adjacent lanes and the rear vehicle on the same lane.
As an example of the two-lane road, because rear vehicle has little influence on target vehicle, the model can be simplified without considering the rear vehicle. The dividing results of the vehicle group are shown in Figures 1 and 2.

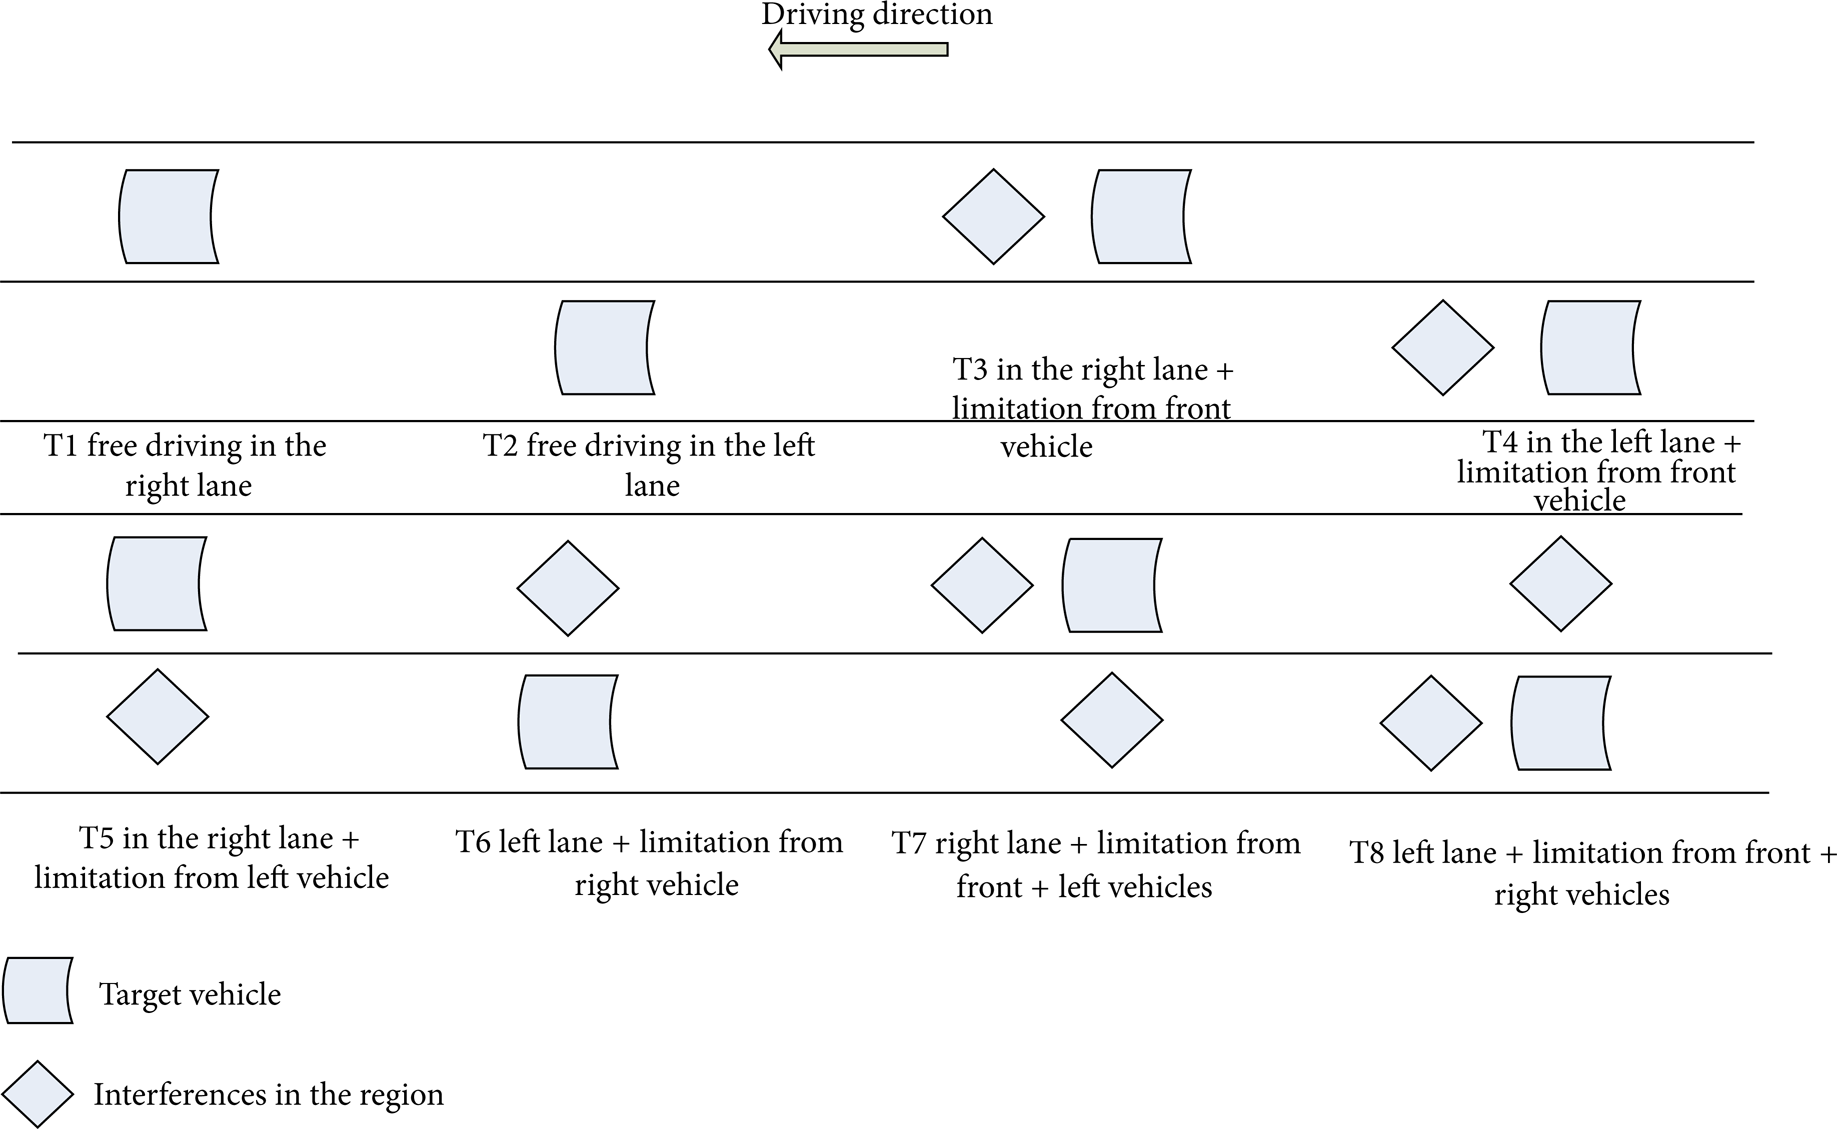
Vehicle group of two-lane road (A).
Vehicle group of two-lane road (B).
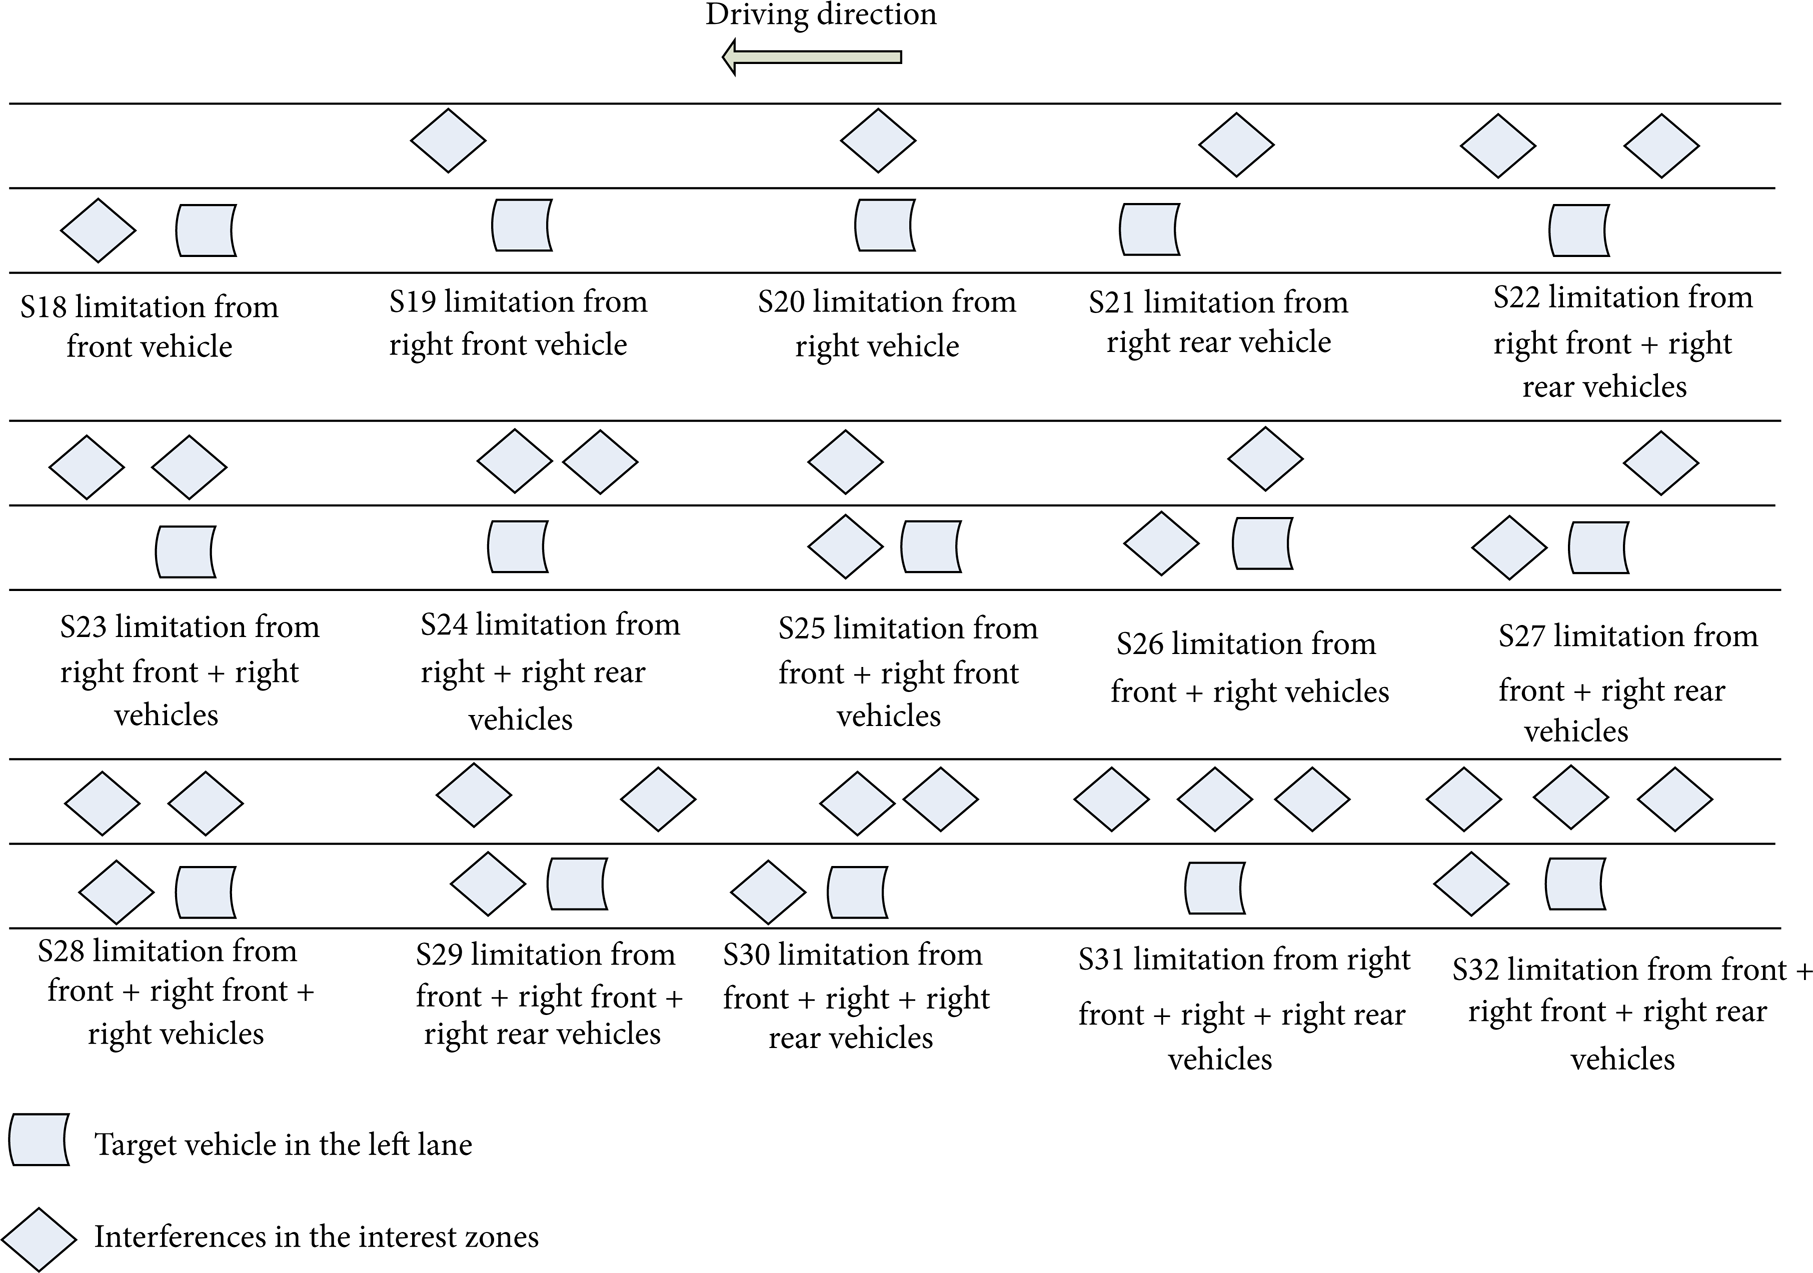
Through simplifying the mode further, the vehicle relationship of left front side, left side, left rear side, right front side, right side, and right rear side can be divided into two types: vehicles on left side and vehicles on right side. If there is more than one vehicle on target vehicle's left or right side and the distance between them meets the minimum gap acceptance, then suppose that the vehicle's spatial distance is minimum and has restrictions on target vehicle. If the distance does not meet the minimum gap acceptance, then the two vehicles will be regarded as one interference vehicle. So the complicated group is simplified as shown in Figure 3. Characteristics of driver's propensity are extracted, respectively, from eight vehicle groups.
Simplified vehicle group on two-lane road.
3. Dynamic Feature Extraction of Driver's Propensity
The dynamic driver's propensity can be represented by speed, acceleration, headway, and physiology characteristics. Driver's microdynamic information and main characteristics representing driver's propensity are obtained through designing various experiments. Driver's microdynamic information includes human, vehicle, and environment.
3.1. Feature Extraction Method Based on Genetic Simulated Annealing Algorithm
Genetic simulated annealing algorithm (GSA) is an optimization algorithm combining genetic algorithm with simulated annealing algorithm [22, 23]. Supposing that initial characteristic vector is N dimension, then individual length Lindividual = N. Each individual gene corresponds to corresponding characteristic. When one characteristic is chosen, then the corresponding gene is “1”, otherwise the corresponding gene is “0.” In the binary string of random generated length n, the number of “1” is random. If there are F random strings continuously produced, then F is group size.
(1) Determination of Adaptation Function. The classification criterion based on the between-class scatter and within-class scatter is adopted; different samples can be separated because they locate in different areas of characteristic space. Obviously, the larger the distance between classes is, the better the separability is. In the given R dimension characteristic space, r characteristics should separate different samples. Inside classes, r characteristics should aggregate different samples as much as possible. The larger the distance between classes is and the smaller the distance inside the classes is, the better the classification effect will be. Individual adaptation function is as follows:

where Sbetween is fuzzy distance between classes and Swithin is fuzzy distance inside classes.
(2) Genetic Operation Design
Selection operator: each individual (chromosome) adaptation value is calculated and the adaptation values are ranged from small to large. 10% excellent individuals are directly passed into next generation, and others are selected by the proportionate choice method of roulette [24], in order to ensure that the best individuals of next generation are not inferior to those of the previous generation.
Crossover operator: individual crosswise stages adopt one-point crossover operator, and whether each individual can cross depends on crossover probability P c . Selected individuals cross with each other and the crossover location is random.
Mutation operator: individual x selects a gene to mutate with probability P m , which changes from “0” to “1” or from “1” to “0.” In order to ensure good computing performance, P m should set an appropriate value. If P m value is too small, then the algorithm will tend to be premature and the found good solution may be destroyed in the mutation process. If P m value is too large, then the algorithm will pass from the present search state to previous bad conditions.
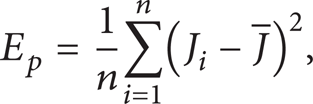
(3) Metropolis Criterion of Group Replacement. Metropolis update mechanism of simulated annealing is introduced into survival strategy in genetic algorithm. Firstly, mean square error E p of environment parameter is defined and it corresponds to the temperature in thermodynamics:
where n is the number of individuals, J
i
is adaptation value of individual i, and
When individual adaptation value of offspring is larger than that of parent, use the offspring individuals to replace the parent individuals; otherwise, retain parent individuals with the acceptance probability as shown in the following formula:

where e is natural logarithm, foffspring is individual adaptation value of offspring, fparent is individual adaptation value of parent, E p is mean square error of environment parameter, and k is real number that is greater than 0. When E p ≥ 1, k = E p + 1; otherwise, k = 1. In the initial stage, E p is larger, the acceptance probability is near to 1, groups are close to complete update ways, and the convergence of genetic algorithm can be speeded up. In the later stage, E p is smaller and groups update ways can prevent genetic algorithm from premature convergence. Procedures of feature extraction are shown in Figure 4.

Procedures of feature extraction.
3.2. Experiment Design
(1) Experiment Equipment. The data are collected through designing experiment in urban road environment using dynamic human-vehicle-environment information acquisition systems (shown in Figure 5, including nontouched multifunction speedometer of SG299-GPS, laser range finder sensor of BTM300-905-200, high definition cameras; Minivap monitoring systems, HDTV camera, and notebook computer). Then driver's propensity can be extracted through processing the data. In addition, the software used in the experiments includes SPSS17.0 and Ulead Video Studio 10.0.
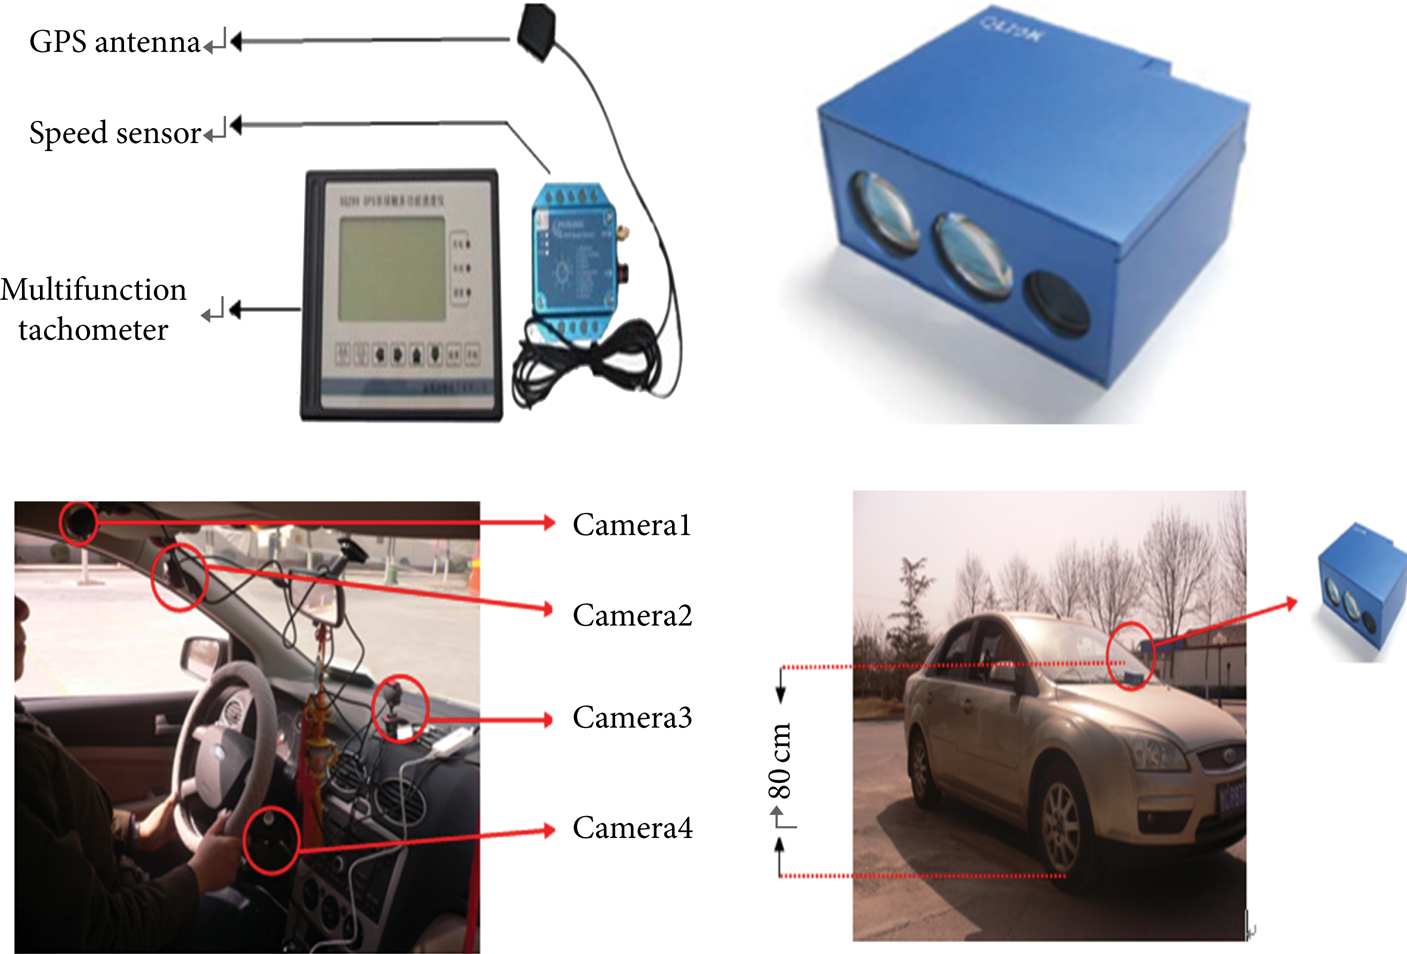
Dynamic human-vehicle-environment information acquisition systems.
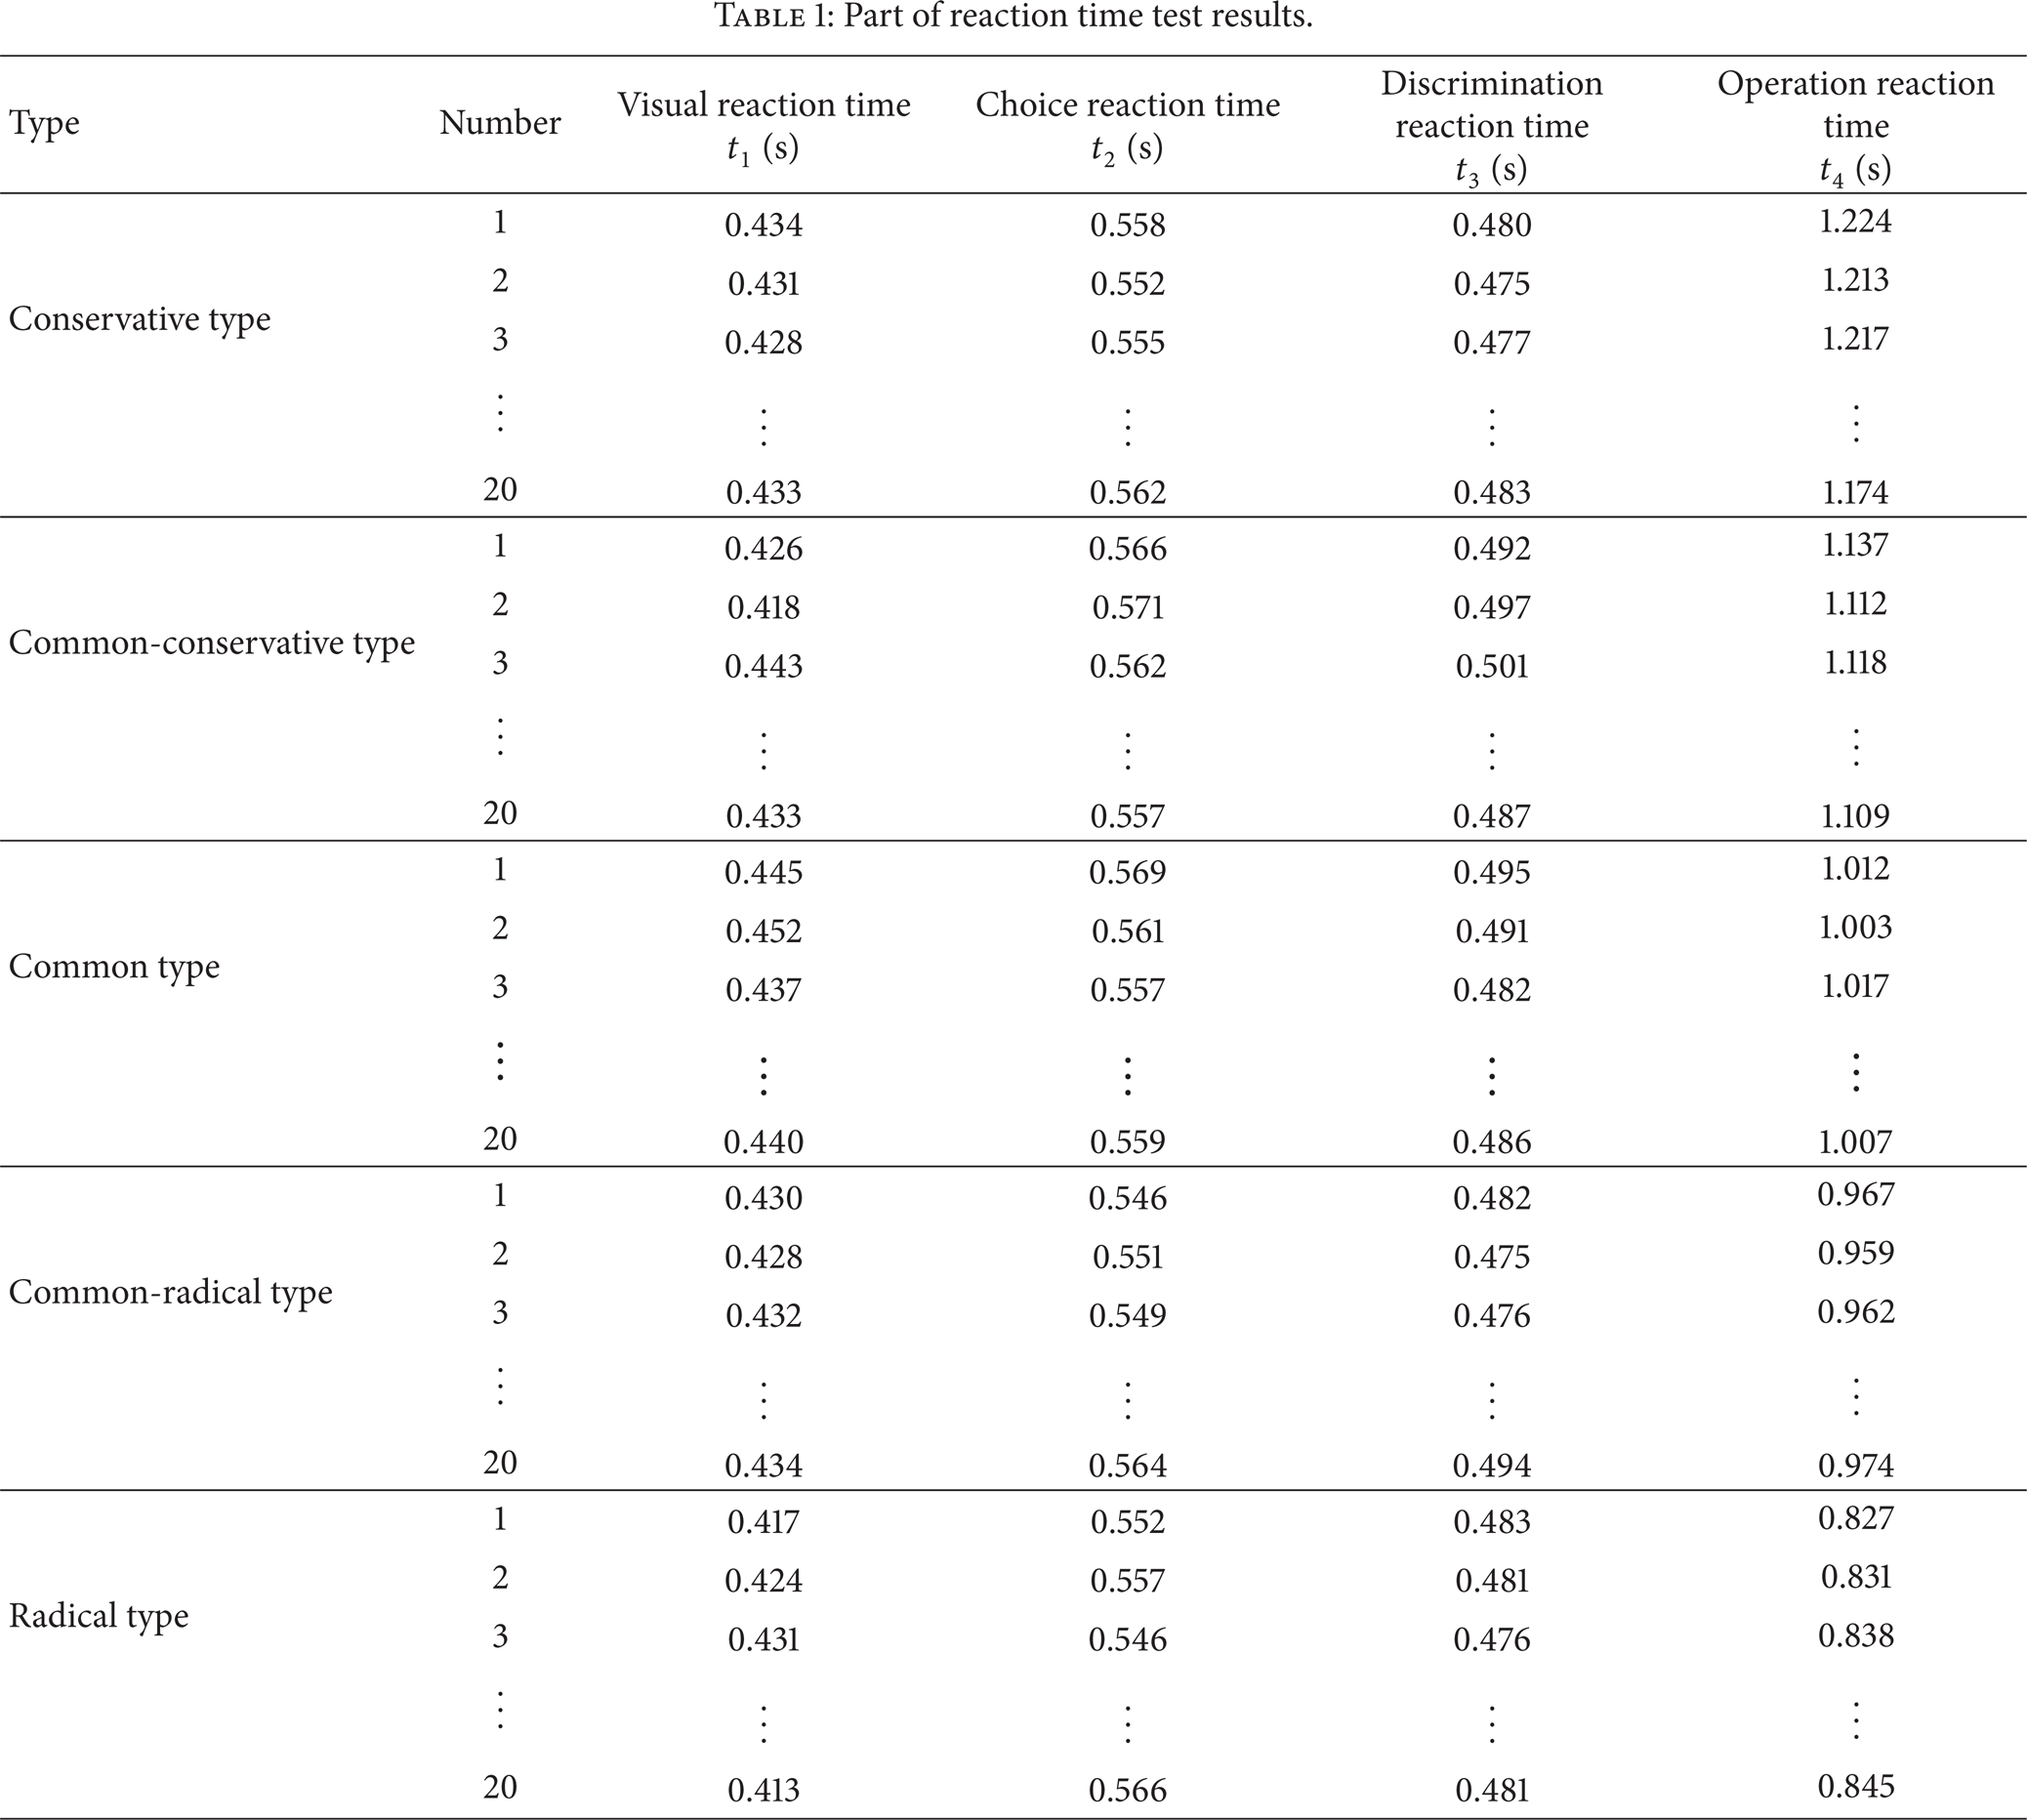
(2) Experiment Content Prediction. Standard data are obtained through designing various tests. The data include driver's character, physiological rhythm, real-time state of driver's psychology, and emotion. Then dynamic driver's propensity prediction can be carried out, and the type of driver's propensity can be determined. Because blood pressure, heart rate and other measuring indicators, are strongly invasive, they influence driver behavior. So the selected driver's reaction time is obtained through nontouched measurement, including visual reaction time, choice reaction time, discrimination reaction time, and movement reaction time. Driving experiment involves eight car groups on two-lane environment. Experiment data are collected by using dynamic human-vehicle-environment information acquisition systems.
(3) Experiment Conditions and Objects. The experiment is arranged in sunny days and on dry pavement. Traffic is heavy but does not meet the congestion. Sample capacity is 50 people, including 41 males and 9 females. Their ages range from 27 to 58 years old and average age is 34.6 years old. Driving years range from 3 to 22 years and the average is 8.16 years.
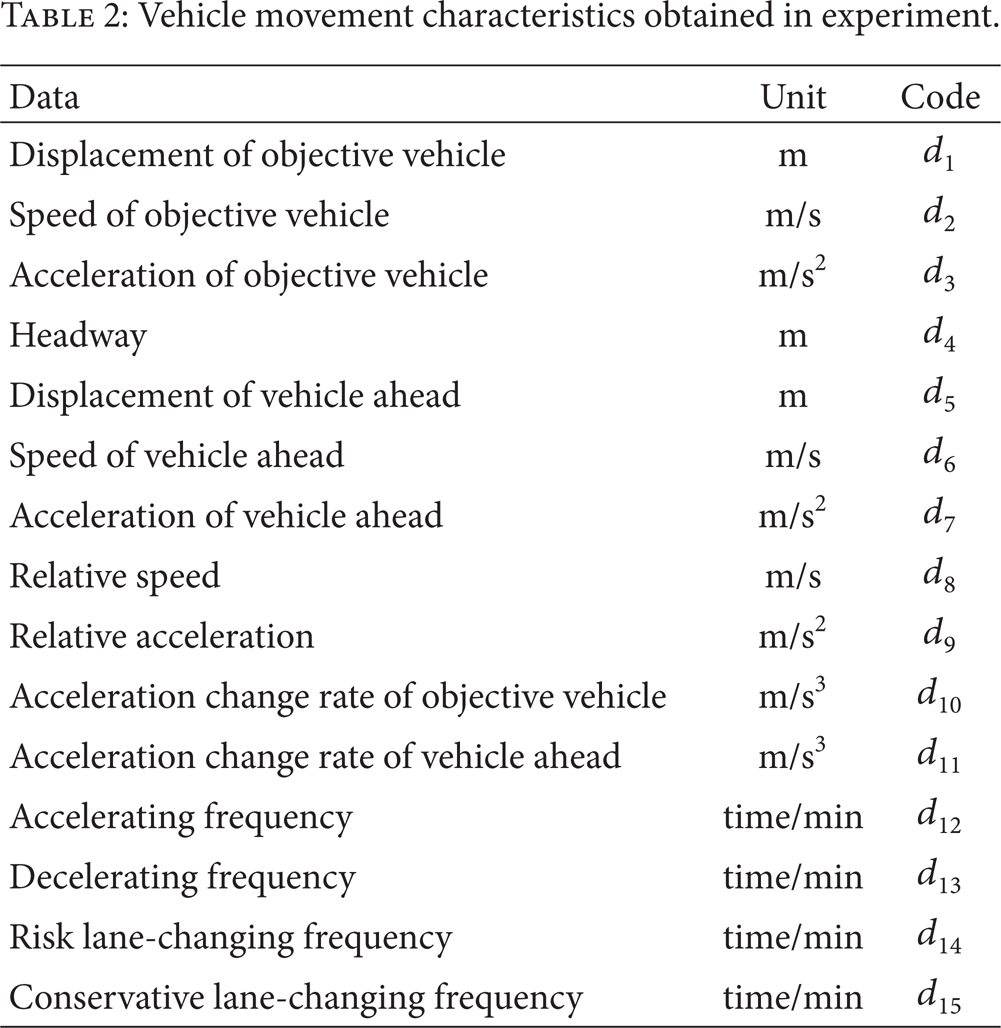
(4) Experiment Data. Experiment data include physiological characteristics and vehicle movement characteristics. Parts of physiological characteristics are shown in Table 1. Vehicle movement characteristics obtained in experiment are shown in Table 2.
Part of reaction time test results.
Vehicle movement characteristics obtained in experiment.
Each driver's expected gap acceptance is obtained through collecting gap acceptance in the process of lane changing. Then comparing the actual gap acceptance and expected gap acceptance, when actual gap acceptance is smaller than the expected, driver's lane-changing is radical; when actual gap acceptance is larger than the expected, driver's lane-changing is conservative; when actual gap acceptance is equal to the expected, driver's lane-changing is normal and there is no need to record. Part of vehicle movement characteristics is shown in Table 3.
Part of vehicle movement characteristics.

3.3. Feature Selection
(1) Physiological Characteristics Selection. Driver's reaction time cannot be acquired in real-time like vehicle movement state data. It needs to be tested individually; for example, if objective vehicle, driver's behavior, and environment factors are compared together, because time base is unmatchable, then the reliability is little. Therefore, reaction time is extracted individually.
There are four types of data for each driver. Typical 20 groups of typical data are selected from each driver's propensity type, and there are 100 groups of experiment data in all. Control parameters are initialized and groups number n = 100, threshold ∊ = 0.01, crossover rate P c = 0.8, and mutation rate P m = 0.01.
After repeated computing, the final optimization result is t4, namely, driver's operation reaction time.
(2) Vehicle Movement Characteristics Selection in Multilane Environment. T7 is taken for example. Large numbers of data are obtained in experiment and selected seriously. Finally, 30 quality groups are selected out. Each group has 5 classes and the same class has 20 individuals.
Control parameters are initialized and groups number n = 100, threshold ∊ = 0.01, crossover rate P c = 0.8, and mutation rate P m = 0.01.
30 groups' features are extracted through the above selection process. The selection results are shown in Table 4.
Selection results of characteristic data.

Based on the data above, extracted characteristics data of driver's propensity under the vehicle group of left and front vehicle restrictions on right lane (T7) are d4, d8, d12, d13, d14, and d15, namely, headway, relative speed, accelerating frequency, decelerating frequency, risk lane-changing frequency, and conservative lane-changing frequency.
Feature extraction of other vehicle groups is carried out with the same method. Finally, characteristic data of eight vehicle groups are shown in Table 5.
Feature extraction results of different vehicle groups.

3.4. Validation
Dynamic recognition and simulation of driver's propensity are carried out by using feature extraction of different vehicle groups. The identification and recognition results are shown in Figure 6.

Accuracy of recognition in different vehicle groups.
Simulation results are shown in Figures 7, 8, and 9. Curve 1 is the result without considering the change of driver's propensity in the simulation process. Curve 2 shows the situation process with considering driver's propensity in real-time. Results show that feature extraction of driver's propensity in this paper is scientific and reasonable.

Verification results of speed.

Verification results of headway.

Verification results of acceleration.
4. Conclusion
Driver's propensity represents their psychology and affection states in the process of vehicle operation and movement. It evolves along with environment and affects drivers' cognition and dealing process on environment information. Therefore, the identification of psychology and affection states in real time is the key to realize the driver-assistance systems and the active security warning systems. Based on the analysis of driver's behavior, vehicle state, and traffic environment, dynamic data of physiological and psychological characteristics, traffic environment, and vehicle movement state are obtained through nontouched measurement. Driver's propensity characteristics are optimized and selected through genetic simulated annealing algorithm, and then characteristic vectors are extracted in different vehicle groups. Experiment validation result shows that dynamic characteristics of driver's propensity in different vehicle groups on two-lane condition can represent driver's propensity accurately, and it makes a solid foundation for the further research to establish dynamic recognition model of driver's propensity which is adapted to multilane environment.
Conflict of Interests
The authors declare that there is no conflict of interests regarding the publication of this paper.
Footnotes
Acknowledgments
The project is supported by the National Natural Science Foundation of China (61074140), the Natural Science Foundation of Shandong Province (ZR2010FM007 and ZR2011EEM034), and the Young Teacher Development Support Project of Shandong University of Technology.