
Abstract
Uncontrolled charging of large-scale electric vehicles (EVs) can affect the safe and economic operation of power systems, especially at the distribution level. The centralized EVs charging optimization methods require complete information of physical appliances and using habits, which will cause problems of high dimensionality and communication block. Given this, an ant-based swarm algorithm (ASA) is proposed to realize the EVs charging coordination at the transformer level, which can overcome the drawbacks of centralized control method. First, the EV charging load model is developed, and the charging management structure based on swarm intelligence is presented. Second, basic data of the EV using habit is sampled by the Monte Carlo method, and the ASA is applied to realize the load valley filling. The load fluctuation and the transformer capacity are also considered in the algorithm. Finally, the charging coordination of 500 EVs under a 12.47 KV transformer is simulated to demonstrate the validity of the proposed method.
1. Introduction
As a new effective means of alleviating the energy crisis, reducing environmental pollution and global warming, EVs have more incomparable advantages than conventional cars and become the focus of governments, automakers, and energy companies now [1, 2]. The EV development strategy research report, accomplished by the Ministry of Industry and Information Technology of China, predicted that there will be 60 million EVs in 2030 in China.
If widely used, EVs will aggregately contribute a new large load to the power grid. Large-scale integration of EVs will pose new challenges to the safe and economic operation of the power system [3–6]. Charging load may further increase the peak load. Grid congestion, network losses, and power quality may be worsening. In overall, the randomness of EVs' charging activities in time and space brings uncertainty and risk to the power system operation. If appropriate charging strategies are adopted, EVs can be used for the load valley filling, congestion management, and other ancillary services for power systems.
Most distributed energy resources, such as small wind turbines and roof-top photovoltaic panels, have the characteristics of random and intermittent. It is very difficult to dispatch the traditional generators to balance their power. If appropriate charging strategies are adopted, EVs can also be used to improve the performance of distributed energy resources. So it is very important to do some deep research on the EV charging model and the charging control algorithm.
Smart grid revolutionizes the current electric power infrastructure by integrating with advanced communication and information technologies which can provide efficient, reliable and safe energy automation service with two-way communication and power flows [7]. Recently, wireless sensor networks (WSNs), which are suitable for the communication among EVs, have gained great attention from the research community in various smart grid applications, including advanced metering infrastructure (AMI), power outage detection, distribution automation, towers and poles monitoring, line fault diagnostics, power fraud detection, and underground cable system monitoring [8]. EVs can be charged smartly at home, work place, and public charging stations based on the smart grid technologies with ubiquitous communication described previously.
Most current research and applications on charging management are based on direct centralized and hierarchical centralized methods. Swarm intelligence realizes the overall intelligence by the simple interaction between the agents and is very suitable for the distributed complex adaptive system (CAS). The power distribution system integrated with large scale of EVs is a CAS in fact. So the decentralized swarm intelligence technique is an ideal management/coordination solution for EV charging which is more flexible and adaptive than the top-down centralized or hierarchical control. The proposed charging coordination method in this paper is a decentralized swarm algorithm.
The remainder of this paper is organized as follows. Section 2 reviews some literatures about EV charging management. Section 3 analyzes the influence factors of the EV charging management. Section 4 formulates the details of EV charging model and develops a decentralized swarm algorithm for charging coordination. Section 5 tests the proposed algorithm by a case study of coordinative charging 500 EVs under a 12.47 KV transformer. Section 6 concludes this paper.
2. Related Works
Recently, many research efforts and studies about the EV charging dispatch have been reported in some literatures [9–16]. In general, the content of the related literatures mainly includes three parts, the charging model, charging management structure, and charging strategy.
In [9], the battery charging and discharging model is built in MATLAB, and the influence to the distribution power system of the EV at the different charging strategy according to the load curve of spring and winter is evaluated. Then some demand response management methods, such as stagger charge and custom load control, are proposed to solve the peak load problem caused by the EV to make the distribution power system more safe and efficient.
In [10], a comparative study is made by simulating four EV charging scenarios, that is, uncontrolled domestic charging, uncontrolled off-peak domestic charging, smart domestic charging, and uncontrolled public charging; all of them take into account the expected future changes to the electricity tariffs in the electricity market and appropriate regulation of EVs battery charging loads.
In [11], the impacts of large-scale EVs deployment on the particular networks are simulated, and the results show that it will lead to a variety of undesired effects such as asset overloading and excessively low voltages. Then a distributed, hierarchical demand management scheme is integrated into each distribution network and proves to mitigate the undesired effects.
In [12], an intelligent method is presented to minimize the charging cost considering the acceptable charging power of EV battery and the state of charge (SOC) in response to time-of-use (TOU) price in a regulated market. The optimized charging model proposed explores the local optimal EV charging strategy successfully but fails to consider the network impacts.
In [13], a decentralized multiagent system (MAS) is proposed, and a hybrid algorithm combined with an evolutionary algorithm and a linear programming was developed to manage a power distribution system with EVs.
In [14], an intelligent, decentralized multi-agent EV charging control method based on TOU price scheme considering network losses further is proposed. The simulation results show that the proposed approach can realize the effective valley filling and provides results of similar quality compared to the centralized approach with limited computer resources and communication resources.
In the related literature, there are also several studies on swarm intelligence of ants, which simulate insect behavior of ants. It is suitable for the distributed circumstances and has been widely applied to the solution of TSP, production scheduling, WSN routing, and other complex optimization problems [15, 16]. But seldom literatures have been found that using the swarm intelligence of ants to manage the EVs charging, which is what we will do in this paper.
3. EV Charging Influence Factor and Management Structure
3.1. EV Charging Influence Factor
The basis of the research of EV charging algorithm is to build appropriate EV load model. First we need to analyze the key influence factor of the EV charging to get better forecast and control of the EV load, which mainly include the physical characteristics of EV charging and EV using habit.
3.1.1. Physical Characteristics
The physical characteristics mainly include the EV type, battery capacity, and charging power.
( 1) EV Type. In this paper EV type means the purpose of the car, mainly including private car and public service car such as bus and taxi. Different types of EV have different battery capacity and charging power.
The public service cars' daily travel miles are longer than private cars, and charging one time per day cannot satisfy their actual need. So they need the method of fast charging or battery replacement.
The private cars are flexible to use, and they are in stop status in 90 percent time of one day, which is very convenient for the charging. In the future, the private cars will be the main part of the EVs. And there are some official survey data about the national household travel of the United States, which is about the private cars and can be used as the basis of the simulation. So in this paper, we mainly consider the charging of private cars.
(2) Battery Capacity. Generally the main battery capacity of the private cars is more than 16 Kwh. For example, the Chevrolet VOLT is 16 Kwh, the Japan LEAF is 24 Kwh, the Honda Fit is 20 Kwh, and the Ford Focus is 23 Kwh. The battery capacity decides the limited mileage of the EV.
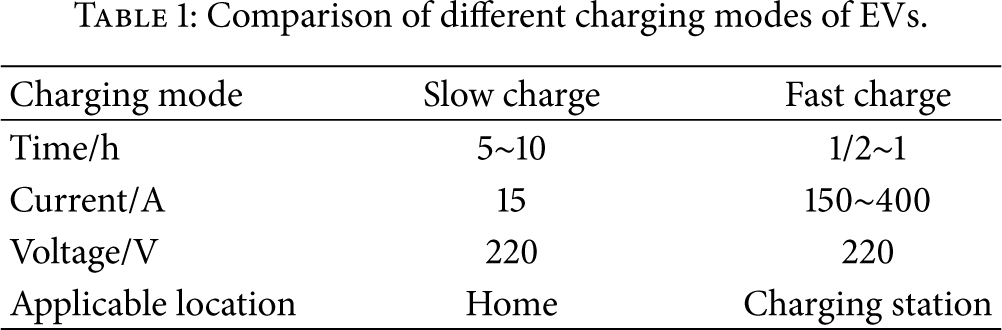
( 3 ) Charging Power. In the ordinary charge mode, the charging power per hour is 0.2 C, and the charging time is 5 hours. In the fast charge mode, the charging power per hour is 1 C or 2 C, and the charging time is 1 hour or half an hour.
Table 1 listed the main parameters of the slow charge and fast charge.
Comparison of different charging modes of EVs.
3.1.2. Using Habits
The using habits mainly include the travel time, travel miles, charging place, and charging time. The user's drive and travel habits are also important to the EV charging. Most of the researches neglect the statistic of daily travel miles and only assume the basic information of SOC, start charging time, and so forth, which is differ from the reality.
The Federal Highway Administration of the Department of Transportation of the United States made a survey about the national household travel survey in 2009 and released the result [17]. According to the maximum likelihood estimation method the end time and the start time of the trip can be expressed as the normal distribution approximately (Figure 1) [18]. And the daily travel miles can be expressed as the lognormal distribution approximately (Figure 2) [10].
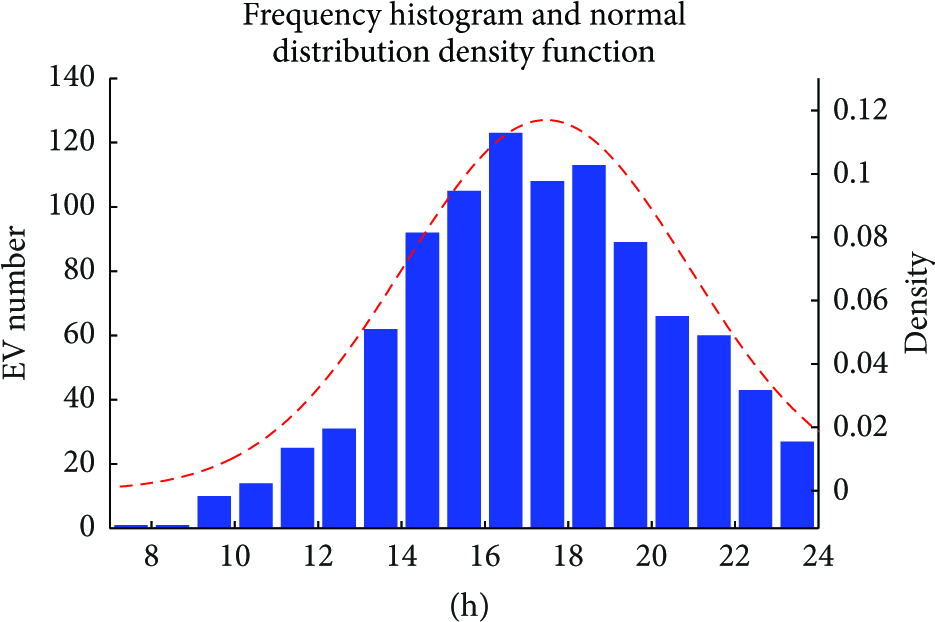
Frequency histogram and normal distribution density function of the start charge time of EVs.

Frequency histogram and lognormal distribution density function of the daily travel miles of EVs.
(
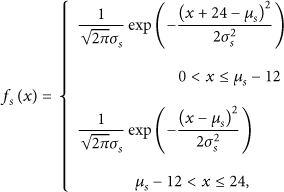
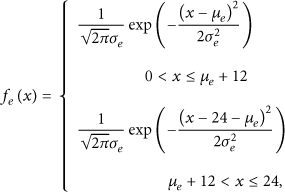
1
) Start and End Charge Time Probability Model. Their probability density function is listed as follows:
(
2
) Daily Travel Miles Probability Model. One has

3.2. EV Charging Management Structure
There are several management structures of efficient EV charging in recent literatures, and the representative structures include the centralized control, hierarchical control, and decentralized control.
3.2.1. Centralized Control
A lot of literatures use the vertical dispatch scheme, which is very common in the power system control, to realize the management of the EVs charging.
Although the centralized dispatch scheme is conducive to get the global optimal solution in theory, it is very hard to implement in the power system with large-scale EVs using the technologies of today. For example, EVs will add too many variables to the central optimization problem which will lead to the high dimensionality, and centralized management needs high computation and communication resources to deal with large amount of information.
3.2.2. Hierarchical Control
Some literatures use the hierarchical scheme to resolve the problem of the pure centralized control. The core idea is to divide the power system into two layers or three layers according to the voltage level and divide the distribution system into many zones. The EVs dispatching problem is divided into the transmission system and several distribution system dispatching problems in this scheme. This scheme can alleviate the pressure of the dispatch center of the transmission to a certain extent.
3.2.3. Decentralized Control
In this scheme, EVs are characterized as agents with a certain level of autonomy taking decisions based on their local and global environment. Local environment includes EV owner's preferences and charging infrastructure parameters, while the global environment includes the transmission/distribution network conditions and energy market conditions.
4. Swarm Intelligence and Ant-Based Charging Coordination Algorithm
4.1. Swarm Intelligence
Swarm intelligence stemmed from the mimic of the living colony such as ant, bird, and fish in nature, which shows unparalleled excellence in swarm than in single in food seeking or nest building. Drawing inspiration from this, researches design many algorithms simulating colony living, such as ant colony algorithm, particle swarm optimization algorithm, artificial bee colony algorithm, and artificial fish colony algorithm, which shows excellent performance in dealing with complex optimization problems [19].
Swarm intelligence has the ability to manage complex systems of interacting individuals through minimal communication with only local neighbors to produce a global behavior, which typically do not follow commands from a centralized leader [20]. These special features make swarm intelligence play important roles in many engineering applications such as multirobot system control, massive distributed sensing using wireless sensor networks, vehicles dispatch, and power system optimization.
4.2. Ant-Based Charging Coordination Algorithm
Because of the high dimensionality and communication demand of the centralized control, new methods such as the artificial swarm intelligence are worthy of exploring for the solution of charging coordination of large-scale EVs. Next we will use the ASA to realize the valley filling at the transformer level.
4.2.1. Single EV Charging Model
( 1 ) Variables and Parameters. Table 2 listed the main EV charging variables and parameters considered in this paper.
Notation description.

For the ith EV, the charging time can be calculated as follows:


( 2 ) Charging Constraints. The charging constraints of a single EV mainly include the SOC constraint, the charging time constraint, and the transformer capacity constraint.
The SOC constraint is defined by

The charging time constraint is defined by

Considering the upper limit of the transformer capacity, the total load with the ith EV at the time h should not exceed the maximum load power of the transformer. The capacity constraint is defined by

4.2.2. Ant-Based EV Charging Swarm Structure
After careful investigation and analysis, the idea of multirobot cooperation based on ant colony algorithm can be applied into the EV swarm intelligent charging control [21, 22]. Each EV is an ant of the whole charging system, and it can communicate with others to exchange the key information to realize the cooperated control of the charging.
The cooperation methods of multirobot system include the centralized control, distributed control, and the hybrid control, which integrate the first two methods effectively and are used extensively now. Based on this and integrating the centralized control, hierarchical control, and decentralized control methods of EV charging illustrated in many literatures, a hybrid control structure is proposed as shown in Figure 3.
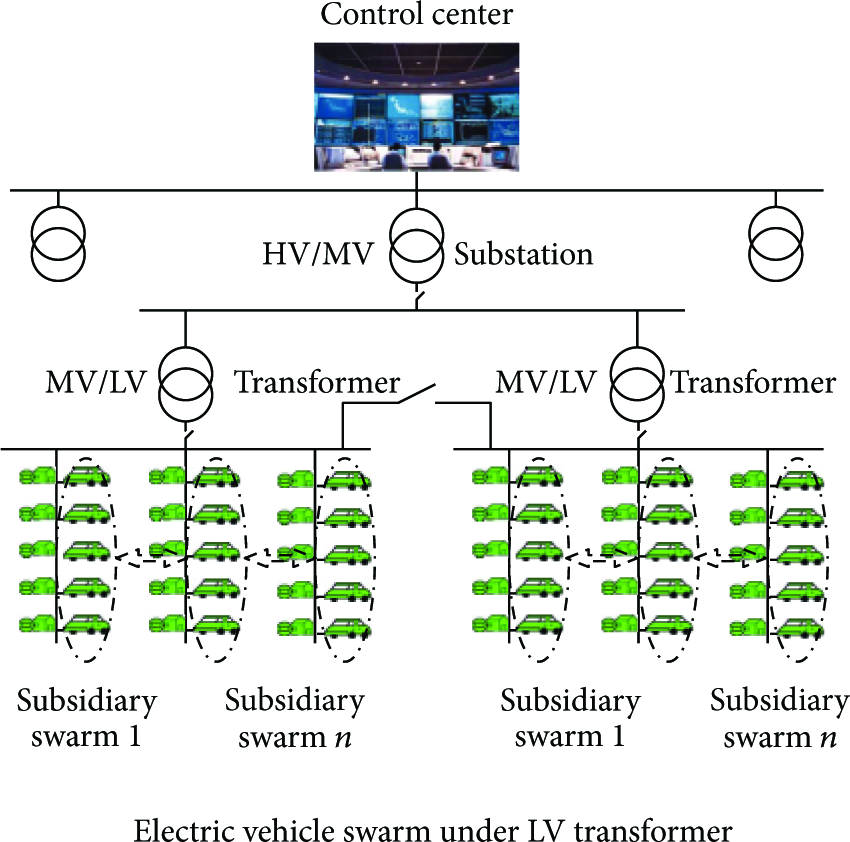
EVs swarm coordinated charging structure.
It includes four layers typically (maybe more according to the system scale), which is the control center, substation, transformer, and EVs in turn. The first three layers are using the traditional centralized control structure from top to down which is widely used in the power grid now. The third layer only controls the fourth layer partly, and the fourth layer uses the distributed control structure. The EVs can exchange information with others to make a decision independently which can get not only the flexibility but also the adaptability. Generally, the EVs in one line can form a dynamic union, which can be called a subsidiary swarm, to realize the coordinated charging with others.
The communication is the basis of the information share and task cooperate between EVs and mainly includes the point-to-point communication, broadcast, and group communication. Wireless communication such as WSNs is suitable for the communication of ant-based swarm charging system because of its distributed characteristic.
4.2.3. Ant-Based EV Charging Algorithm
( 1 ) Ant Colony Algorithm Used in Multirobot Collaboration. Ant colony algorithm (ACA) is a simulation of ant's swarm intelligent behavior in food seeking, where ants transmit messages to each other by releasing pheromone and can always find a shortest routing path form their nest to food source by swarm cooperation. ACA was first presented combining with TSP problem by Dorigo et al. in 1996 [23]. Then it was successfully applied in TSP, assignment problem, job shop scheduling, network route design, multirobot collaboration, and so forth, which shows its advantages in complex optimization problem especially the discrete ones.
The multirobot system is a distributed system, and the advantage of it is that a robot can either work alone or cooperate with others. The relationships among the robots are equality. The robot can exchange information with others through communication and can make a decision independently. Different tasks were given different quantity of pheromone in the ACA used in multirobot system, which was used to attract the robots to choose which task should be accomplished with priority. The more difficult tasks will possess higher pheromone amount than the easier ones, so that the robots will choose to participate in the difficult tasks with priority.
( 2 ) The Suggested Charging Planning Algorithm. In this paper an improved algorithm based on the ACA used in multirobot collaboration is implemented to solve the EVs charging schedule problem according to the day-ahead load forecast data of the transformer. In this algorithm the load valley filling of different valley time segments is the tasks of the ants.
The ant-based charging plan algorithm (Figure 4) mainly includes these steps as follows.

Ant-based charging planning algorithm flow.
Step 1.
Setting up the EVs' parameters. Including the EV number (ant population), the use habit of EV such as the plug-in and plug-off grid time (can help to get the usable charging time, assume that the car plug-in the grid when comes home and plug-off the grid when leaves home), the daily travel miles and the energy need when traveling 100 KM (can help to compute the SOC of the battery), the charging efficiency, the rated charging power, and so forth.
Step 2.
Initializing the pheromone. Compute the pheromone according to the day-ahead load forecast data of the transformer and other parameters using (9).
Step 3.
Setting up the maximum iterations
Step 4.
Loop for iterating in turn of the plug-in time of the EVs. Each ant decides the suitable charging time segment according to its parameters, and the pheromone of other ants is released.
Step 5.
Compare the total load
Step 6.
Update the pheromone at the charging time segment for other EVs to use.
Step 7.
Generate the charging scheduling of all EVs.
The charging planning pheromone of the ith EV at time segment h can be calculated as follows:

where
( 3 ) The Feasibility Analysis of Proposed Algorithm. Each EV is a relative independent individual in this algorithm, which is an ant in fact. The global optimization objects are the sum of all individuals' optimization value. So the proof of the algorithm feasibility is to prove that each EV can reach the optimal value when it plug in the grid.
Assume that 

For each EV as an individual agent, its charging instant will be arranged in the moment at which the pheromone is low. Suppose that
Using the quick sort algorithm to list S from large to small according to the
Choose the first m time segments to charge and satisfy the following condition:
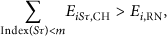
where
There are J time segments in all. The time complexity of this can be calculated as follows

Because
And there are N EVs in all. The time complexity of the sum is
( 4 ) The Suggested Charging Adjustment Algorithm (Figure 5). One character of the power system load is randomness, which is difficult to control. Another character is the periodic change of different stages which can be expressed in month, day, hour, and so forth. So the load can be forecasted according to the history data but still has some difference with the real load. The EVs can be a good method to dissolve the load fluctuation in a certain extent so as to reduce the power backup. Next the charging adjustment algorithm to response the load fluctuation is proposed. The main steps are as follows.

Ant-based charging adjustment algorithm flow for the load fluctuation.
Step 1.
Get the corresponding parameters of the EVs plug in power grid that mainly include the EV number, the charging status of each EV, and other parameters of EV itself.
Step 2.
Get the real load of the current time segment. The algorithm can get the latest load in process of the simulation time.
Step 3.
Compute the pheromone needs to compensate according to the real load, the forecast load, and the load fluctuation sum using (14).
Step 4.
Choose the different charging control method according to the load fluctuation. If the real load is larger than the forecast load, let the EVs charging at the current time segment stop charge, and choose another suitable time segment to charge considering the constraints of its own. If the real load is less than the forecast load, let the EVs charging at the later time segment move to the current time segment to charge.
Step 5.
Loop for iterating in turn of the plug-in time of the EVs.
Step 6.
Compare the total load
Step 7.
Update the pheromone of the load fluctuation for other plug-in EVs.
Step 8.
Quit the iteration when the fluctuation compensation object is finished.
Step 9.
Update the charging scheduling of all EVs as the time process.
The charging adjustment pheromone of the ith EV at time segment h can be calculated as follows:

5. Simulation Results
Based on the charging load model described in Section 3, next we begin to simulate the ant-based coordination charging algorithm proposed in Section 4 and make a comparative analysis of the performance between free charge mode and coordination charge mode with different influence parameters. Furthermore the performance of ASA and PSO is also compared.
5.1. Simulation Environment
Our simulation environment is set to a 12.47 KV distribution transformer in a residential area, and the initial data of the original forecast load are simulated according to the actual loads of weather zones report published by the Electric Reliability Council of Texas (ERCOT). The rated capacity of the transformer 
So the maximum load power of the transformer in this paper is 1615 KW. The 24 hours load data of one day is the basis of the simulation.
(
1
) Load Fluctuation. There are many uncertainty factors influence the load and will cause fluctuation in operation, which can be simply described by the standard normal distribution [24]. The load of time t can be defined as follows:
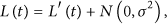
Considering the private cars that are mainly charged in the night, the dispatching period is set from today's 12 o'clock to next day's 12 o'clock and the dispatch time segment is one hour. The curves of the original load and real load with fluctuation are shown in Figure 6.

Original forecast load and real load curve of 12.47 KV transformer.
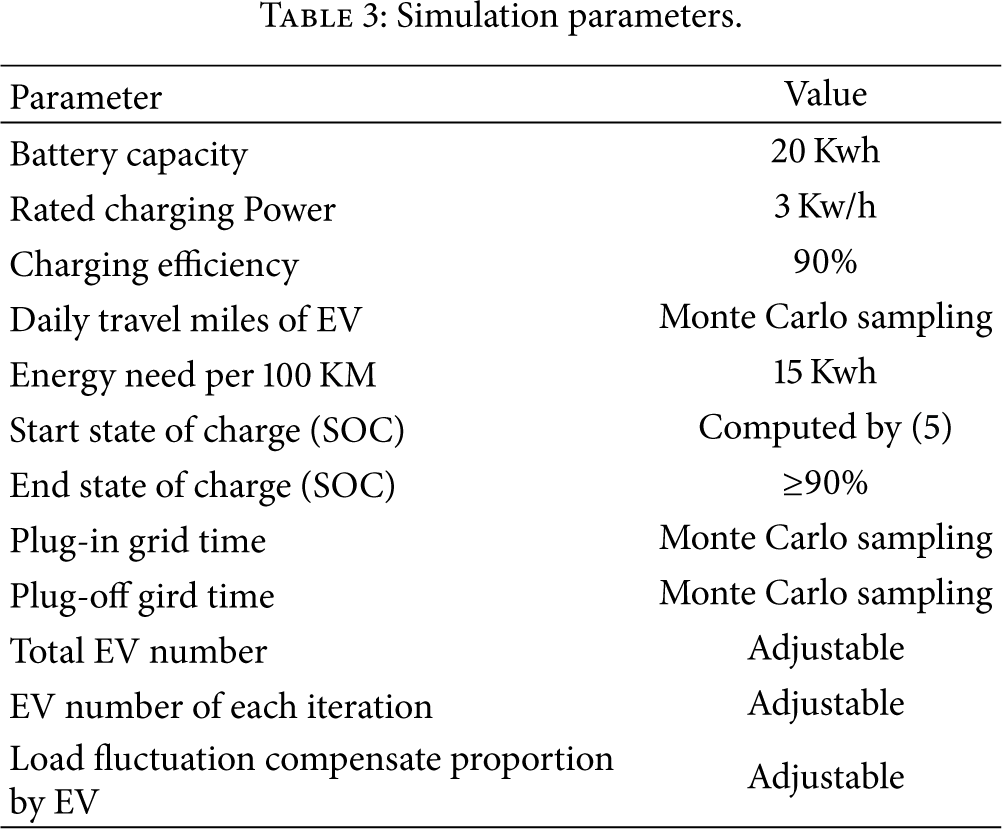
( 2 ) Simulation Parameters. Table 3 shows the simulation parameters of the EV charging. Some rated parameters such as the capacity, efficiency, end SOC, and EV number are defined as a fixed value. Some parameters about the using habits are sampled in Monte Carlo method according to the distribution function. Some parameters are adjustable to verify the different performance.
Simulation parameters.
Our simulation includes four parts: (1) getting the load curve with EVs of the free charge mode using the previous parameters; (2) getting the load curve with EVs of the cooperated charge mode using an ant-based algorithm to realize the self-organized charging in load valley; (3) getting the load curves with EVs using ASA and PSO to make a comparison; (4) getting the load curve with EVs using charging adjustment algorithm to realize the load fluctuation compensate.
5.2. Free Charge
In the free charge mode, the EVs charge in rated power immediately when plug in the power grid and left when the battery is full. The whole charging process is out of control and regulation. The simulation results based on the parameters in Table 3 are shown in Figure 7.
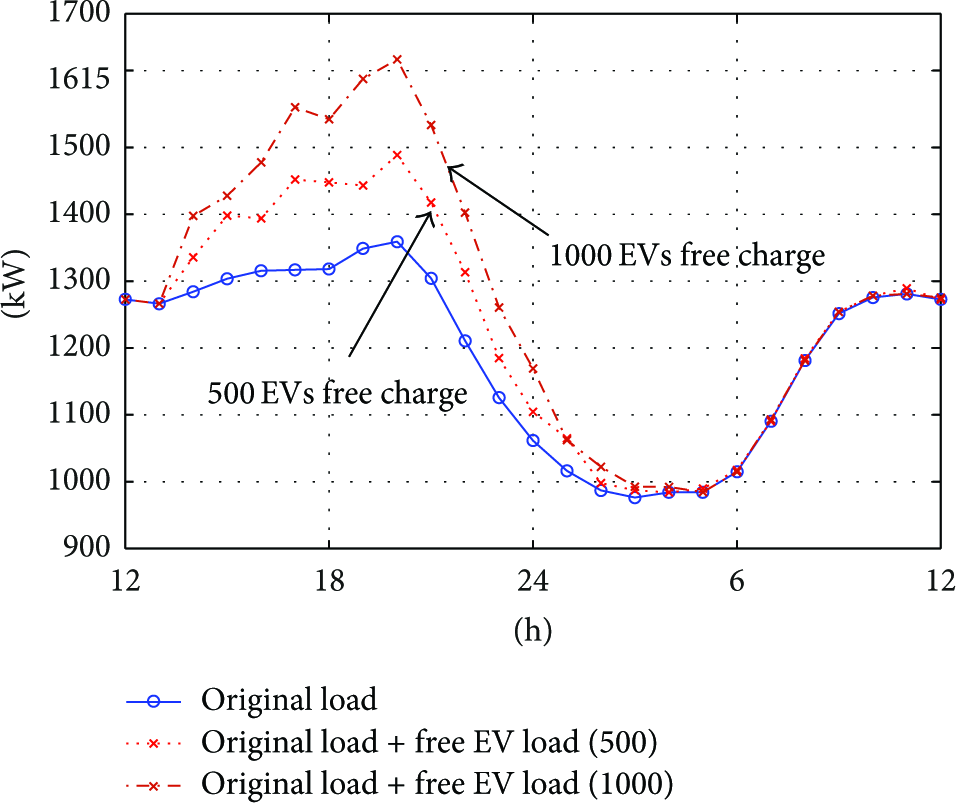
Load curve of 500 and 1000 EVs free charge.
As displayed in Figure 7, the charging load peak time segment of the EVs are similar to the power load peak, so it will burden the power load and enlarge the peak valley difference. As the proportion of EV load increases, the EV free charging will greatly influence the security of power grid.
5.3. Ant-Based Charging Planning Algorithm for Load Valley Filling
In the coordination charge mode, the simulation of EVs to realize the planned charging at the valley time segment is just as follows.
From Figure 8 it can be seen that the EVs can find the lowest load time segment in its useable time segment when it plug in the grid. The curve is get on the condition of iterating one car each time, which can get more smooth curves. So the ant-based charging algorithm can realize the load valley filling effectively through the pheromone information exchange.

Load curve of 500 EVs coordinated charge by iterating one car each time at different hours.
In fact, there are more than one car plug-in grid at the same time. So it is necessary to deal with a group of cars at each communication in order to get better compute speed and lower communication cost. From Figure 9 it can be seen that the iterated cars number of each time will influence the load curve, which should be selected according to the total number of EVs. When the iterated car number is 10 or 20, the load curve fluctuation is small, which is better than 50.

Load curve of 500 EVs coordinated charging by iterating different numbers of cars each time.
From Table 4 it can be seen that the ant-based coordination algorithm can reduce the peak valley difference of the power system, which can reduce the start and stop times of the generators and improve the safety and economy of the system operation.
Comparisons between the free charge and coordinated charge.

5.4. Performance Comparisons with Particle Swarm Algorithm (PSO)
Particle swarm optimization (PSO) algorithm was developed by Kennedy and Eberhart in 1995 [25], which is a kind of heuristic global optimization technology and belongs to the category of swarm intelligence methods. PSO works by “flying” a population of potential solutions called particles through a problem's D-dimensional solution space. The particles in PSO consist of a D-dimensional position vector and velocity vector and also have a fitness function which is required to evaluate its performance. The particles keep track of the individual extreme values and the global extreme value in the solution space until it reaches the iteration number or meet the specified error standard.
PSO has the characters of high efficiency and simplicity and has been successfully applied in many areas. But it also maybe falls into the local minimum in dealing with the discretization problems.
Next we used two methods of PSO to optimize the EVs' charging schedule problem. The basic parameters of EVs are same to the parameters used in the ASA, and the optimization objects are the load valley and the minimum fluctuation in the valley time segment.
( 1 ) First Method. In this method we take the usable charging time segments of each EV as the solution space. If there are 500 EVs the dimension of the particle is 500. And each EV has different usable charging time segments, maybe 5–11 hours in the valley time segments.
( 2 ) Second Method. Each EV has different parameters such as the plug-in grid time, plug-off grid time, and the real charge time. We can make a subtotal of these data to reduce the dimension of the optimal solution.
According to the real charge time, which is calculated by the charging energy and rated charging power, the EVs can be divided into 7 types. According to the EV numbers can get the object valley filling time segments, which are the 22 o'clock of first day to 10 o'clock of the second day if there are 500 EVs. Then we take the one type of EV start charging in one valley filling time segment as one dimension of the solution, which can reduce the solution dimensions to 84.
The optimal solution search space of the second method is smaller than the first one and has better convergence rate. Next we will use the second method to make a comparison with the ASA.
From Figure 10 it can be seen that the ASA can get similar optimization load curve with the PSO. And the curve with PSO iterated 1500 times is better than 500 times, which says that the PSO need more iterated times to get better performance.

Load curve of 500 EVs coordinated charge in ASA and PSO.
From Table 5 it can be seen that the ASA has less simulation time than the PSO if they all reach the similar load fluctuation difference in valley.
Performance comparisons between the ASA and PSO algorithms with 500 EVs charging.

Based on the simulation results, we can see that the ASA is suitable for the EVs charging optimization.
5.5. Ant-Based EV Charging Adjustment Algorithm for the Load Fluctuation Response
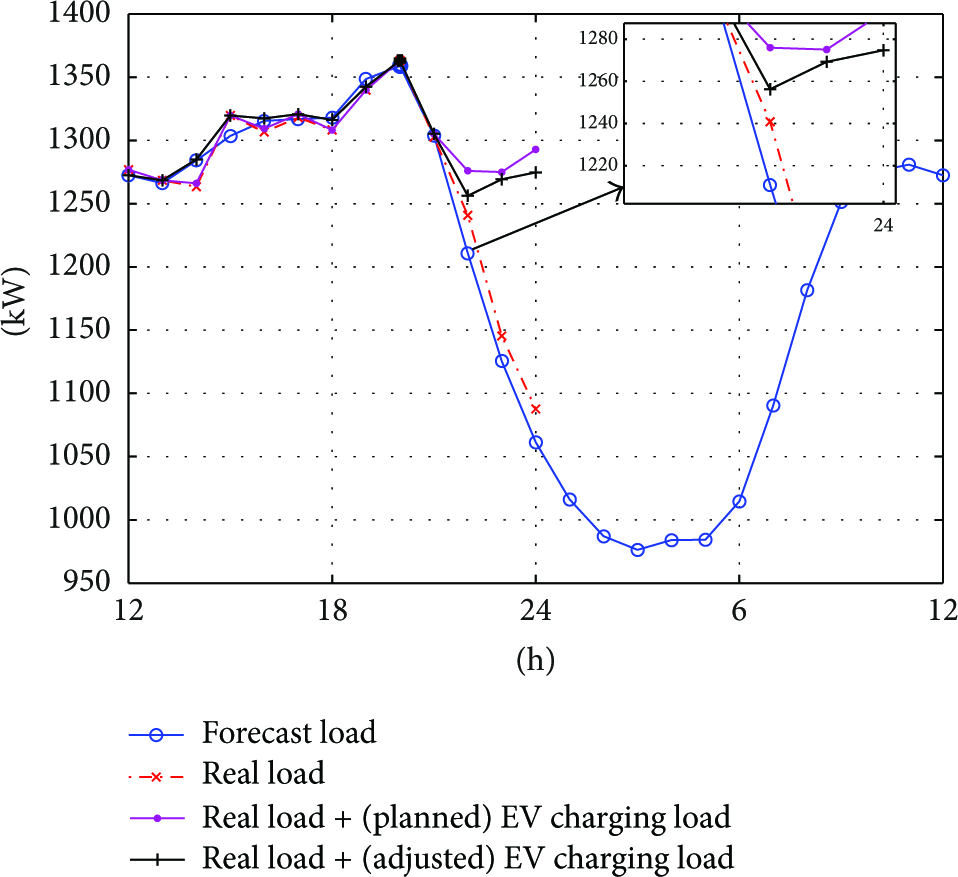
In this section we evaluated the performance of the ant-based EV charging adjustment algorithm for the load fluctuation response we proposed in this paper. The real load with fluctuation can be computed from (16) and the load fluctuation compensation proportion by EV can be computed from (14). Other simulation parameters are same to above mentioned. The different types of load curve of 500 EVs charging adjustment for load fluctuation response at different time are shown in Figures 11, 12, 13, and 14, respectively.

Different types of load curve of 500 EVs charging adjustment for response fluctuation at 18 o'clock.
Different types of load curve of 500 EVs charging adjustment for response fluctuation at 24 o'clock.

Different types of load curve of 500 EVs charging adjustment for response fluctuation at 6 o'clock of the next day.

Different types of load curve of 500 EVs charging adjustment for response fluctuation at 12 o'clock of the next day.
From Figure 11 it can be seen that at 14 o'clock the real load is lower than the forecast load, but the real load with the adjusted EV charging load is close to the planning load. That is to say that the EVs, whose planned charging time is later, participate in the regulation for the load fluctuation.
From Figure 12 it can be seen that at 22 o'clock the real load rises significantly above the forecast load, but the real load with EV charging is smooth relatively. It shows that some EVs charging at this time segment change to later segments so as to reduce the load increase of this time segment.
From Figures 13 and 14 it can be seen that the real EV load charging curve changes with the load's fluctuation. The curve of the final real load with EV load response fluctuation is smooth relatively, which shows that our swarm algorithm can effectively deal with the load fluctuation.
6. Conclusions and Future Work
In this paper, a swarm algorithm for charging coordination of EVs at the transformer level is presented. The advantages of the proposed algorithm can be summarized as follows. (i) It does not need the centralized decision of the upper level. (ii) It can respond effectively to the transformer constraint and the load fluctuation. (iii) Its computation burden is relatively low, thus suitable for large-scale application. This paper is our first step in the swarm coordination algorithm in the EVs charging. In the future, we will extend the swarm algorithm to realize some more complicated applications such as the coordinated dispatch of EVs charging and wind power.
Footnotes
Acknowledgments
This work was supported by the National High-tech R&D (863) Program of China (Grant no. 2012AA050803), National Natural Science Foundation of China (Grant no. 51007058), Research Fund for the Doctoral Program (for Ph.D. Supervisor) of Higher Education of China (Grant no. 20120073110020), and SMC Excellent Young Faculty Program of Shanghai Jiao Tong University.