
Abstract
Touching corn kernels are usually oversegmented by the traditional watershed algorithm. This paper proposes a modified watershed segmentation algorithm based on the extended-maxima transform. Firstly, a distance-transformed image is processed by the extended-maxima transform in the range of the optimized threshold value. Secondly, the binary image obtained by the preceding process is run through the watershed segmentation algorithm, and watershed ridge lines are superimposed on the original image, so that touching corn kernels are separated into segments. Fifty images which all contain 400 corn kernels were tested. Experimental results showed that the effect of segmentation is satisfactory by the improved algorithm, and the accuracy of segmentation is as high as 99.87%.
1. Introduction
1,000-kernel weight is an important indicator of seed vitality. This parameter used to be measured by hand, but the process is inefficient, and the result is inaccurate. Using digital image processing to automatically measure 1,000-kernel weight is a fast and effective method being developed for future use with corn seed [1]. As the kernels being imaged are usually touching each other, the counting accuracy by digital image processing is not as high as required, hence the need to develop an improved algorithm for the segmentation of the touching corn kernels.
Most of the literature about digital image segmentation of large quantities of seed focuses on round-shaped grains, such as rice and wheat [2–4]. For corn kernels, which have various sizes and irregular shapes, it is more difficult to segment the image, and there are few segmentation algorithms for corn kernels. Yaqiu et al. [1] proposed a watershed transform with gradually changing threshold for the segmentation of corn seed in digital images. That method is based on the area and the average width of the corn kernels, its main shortcoming is the large amount of calculation required. Xun et al. [5] presented an approach based on intersection areas and contours of touching kernels to search for segmentation points. This algorithm is most effective for two touching kernels. However, when the images show a large number of seeds with complicated connections, the authors report that the effect of segmentation is unsatisfactory.
Present cereal image segmentation methods include mathematical morphology [2], the concave point detection algorithm [6, 7], elliptic curve fitting [8, 9], the distance transform and watershed segmentation algorithm [10], the kernels' contour curvature [11], and the active contour algorithm [12]. As the watershed transform method has a good response to weak edges and smooth segmentation curves, it has widespread applications.
The watershed transform is a segmentation algorithm which is based on the topological structure of an image and can divide the image into a plurality of regions. The algorithm originated in the field of geodesy, specifically the study of watershed areas. The watershed area is digitally imaged and rendered into grayscale, with darker colors indicating lower altitudes. A water basin is thus constituted by a group of pixels surrounding a local grayscale minimum, including the minimum itself. With increasing water level, the region surrounding each local grayscale minimum gradually expands outwards, eventually forming a junction between neighboring water basins, called a watershed boundary [13, 14]. Corn kernels also have indentations due to their irregular shape, which function analogously to the water basins in the algorithm, allowing the “watershed boundaries” in the image, each surrounding a single kernel, to be computed.
Because of the irregular shape of corn kernels, the traditional watershed transform method always leads to oversegmentation. In this paper, by isolating the reason for the oversegmentation, we propose an improved watershed segmentation algorithm based on the extended-maxima transform that solves the problem of oversegmentation of touching corn kernels.
2. Segmentation Algorithm
2.1. Watershed Segmentation Transform
In this paper, all transformations are based on binary images. Before applying the watershed transform, we need to first carry out the distance transform. The distance transform (DT) labels each pixel of the image with the distance to the nearest boundary pixel in a binary image [15]. This transform correctly segregates round and simple touching objects, but for kernels with irregular shapes, the images usually show several maxima after the distance transform, which leads to oversegmentation.
Image segmentation processing is shown in Figure 1, where image (a) represents the original image in grayscale. The image is converted to binary image (b) by morphologically opening [16] to smooth the edges. The image is subjected to a distance transform as shown in image (c). The grayscale image is equivalent to a topological map, with the maxima as peaks and the minima as valleys. The watershed algorithm obtains the watershed ridge lines shown in image (d). For ease of comparison, image (e) combines image (b) and (d). Finally, image (f) is obtained by overlaying images (b) with the complement of image (d). The black lines running through some of the kernels are watershed lines that cross an individual kernel.

Watershed segmentation transform steps: (a) original grayscale image, (b) binary image, (c) distance-transformed image, (d) watershed ridge lines, (e) original binary image overlaid with watershed ridge lines, and (f) complementary image of watershed ridge lines superimposed on the binary image.
Inspection of Figures 1(e) and 1(f) shows that many corn grains appear oversegmented, due to the fact that many corn kernels have more than one local maximum. Figure 2(a) shows the corn seed contours along with the local maxima obtained from the distance-transformed image in Figure 1(c). Figure 2(b) is an enlarged section of the same image clearly showing multiple local maxima on several seeds.

(a) Local maxima superimposed onto a contour image. (b) Local enlarged image.
Comparison of Figures 2 and 1(e) clearly shows that there is no unique local maximum for some corn kernels based only on the distance transform, leading directly to the oversegmentation.
2.2. Extended-Maxima Transform
The H-maxima transform in mathematical morphology [17], used to suppress pixels above a certain intensity, can extract local maxima related to target objects from the gray image. The extended-maxima transform can calculate the regional maximum, and constitute a binary image. The H-maxima transformation suppresses all maxima whose depth is below or equal to a given threshold h. This is achieved by performing the reconstruction by dilation of f from f – h, as shown in the following:

where f is the grayscale of original grayscale image, and h is the threshold value. The extended-maxima EMAX are defined as the regional minima of the corresponding H-maxima transformation, as shown in the following:

The previous transformations can be described by Figure 3. The images are the regions with coordinates from (115,86) to (126,95) based on Figure 1(a), and the threshold value here is set to h = 170.
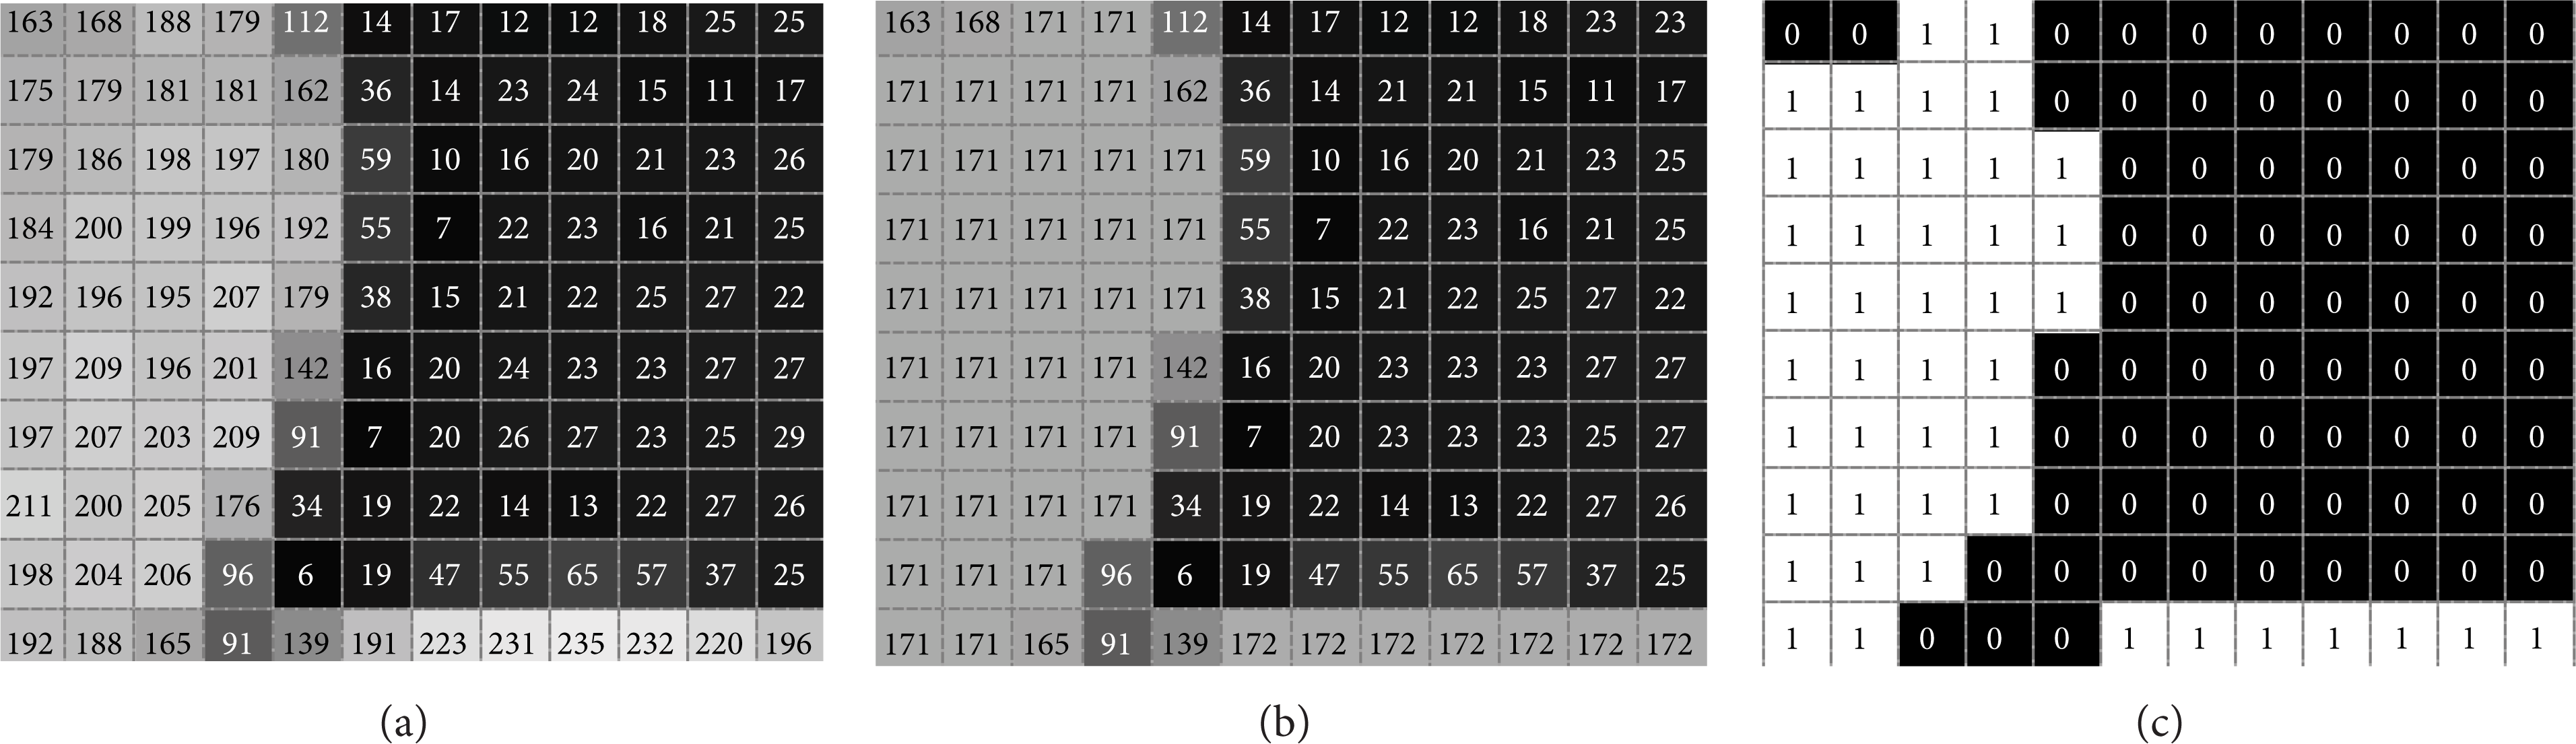
(a) Original matrix, (b) H-maxima transform, and (c) extended-maxima transform.
2.3. Watershed Segmentation Algorithm Based on the Extended-Maxima Transform
In this paper, the extended-maxima transform is used to eliminate oversegmentation. The algorithm is as follows: first, we perform a distance transformation on the original grayscale image. Next, we need to look for an appropriate value for the threshold parameter h; then, the H-maxima transformation and extended-maxima transformation are applied sequentially to the distance-transformed grayscale image. After these transformations, we obtain a binary image. Watershed transform on this binary image yields watershed ridge lines. These ridge lines are then superimposed on the original binary image. Experimental data show that touching corn kernels can be segmented well by these watershed ridge lines, provided that h is selected properly.
The key point of the algorithm is how to select the optimal threshold value h, which can segment the original binary image correctly. In order to improve the calculation precision, firstly, the transformed image is normalized. That means that the grayscale will be in the range of [0, 1] after the distance transformation. We then repeat the entire algorithm after increasing h by an increment Δh until we obtain the optimum value for h. If h is greater than the optimum value range, it will not eliminate the oversegmentation. However, if h is less than this range, “segmentation debris” (spurious bright or dark pixels that were not cleared out by the processing) will appear after segmentation, making subsequent image analysis processing unnecessarily difficult.
This paper uses the connected component labeling method [18] to count the region number of kernel images and determine the optimal range of the threshold value h. Firstly, the number of kernels in the binary image created by the extended-maxima transform is calculated, and the results are recorded as N1. The watershed segmentation ridge lines based on the extended-maxima transform are superimposed to the original binary image; the segments results are recorded and counted as N2. When an allowable range of the threshold parameter h is decreased, kernels in the binary image from the extended-maxima transform can be separated because the kernel edges are brighter than the main kernel. Unlike erosion operations, the extended-maxima transform can avoid discarding small objects as spurious, so it will not lose small particles through improper selection of structural elements in the erosion operations. Experimental data show that it can accurately predict the number of kernels when a small enough threshold h is selected. Taking the collection of corn kernels in Figure 1 as an example, setting different values of h gives different values of both N1 and N2 as shown in Figure 4. The data represent a stepwise change to N1 with the increase of the threshold h. When threshold h is small, N1 is constant and equal to the actual numbers of kernels in the image. We choose as the selection criterion the first value of h where N1 is equal to N2.

N1-N2 statistical data curve.
In conclusion, the steps of extended-maxima transform/watershed separation algorithm are as follows.
Convert the original grayscale image to binary and distance transform it. Then, normalize the obtained grayscale image. We call the resulting image I bw .
Guess an initial threshold value h = 0.1, and perform an extended-maxima transform on I bw . We call the new binary image Ibw1.
Count the number of kernels in I bw , which is based on connected components labeling; statistical number N1 is obtained.
From a watershed segmentation transform on Ibw1, we obtain watershed ridge lines and superimpose them onto the original binary image, obtaining a segmented image with each segment corresponding to a single kernel.
Count the number of kernels in segmented image, which is based on connected components labeling; statistical number N2 is obtained.
If N1 ≠ N2, h = h + Δh (here take Δh = 0.01), repeat steps (2), (4), (5), and (6), until N1 = N2.
3. Experiment and Analysis
3.1. Oversegmentation and “Segmentation Debris”
An extended-maxima transform and watershed segment transform are performed on the original image (Figure 1(a)) using different threshold values h = 0.4 and h = 0.2. For ease of comparison, the binary image based on the extended-maxima transform is subtracted from the original binary image, and the centroid of the connected regions (kernels) are marked with “*.” When h = 0.4, oversegmentation occurs with the result N1 = 37, N2 = 40, as shown in Figure 5. On the other hand, when h = 0.2, there is some “segmentation debris” (the small particles cutting from the kernel region by watershed segmented ridge lines), and the result N1 = 38, N2 = 40 is shown in Figure 6.

Oversegmentation (a) extended-maxima transform, (b) subtraction, and (c) labeled segments.

Segmentation debris (a) extended-maxima transform, (b) subtraction, and (c) labeled segments.
By analyzing Figures 5 and 6, we conclude that the value of the threshold parameter h has great influence on the segmentation effect. When h is too large, as shown in Figure 5, touching kernels cannot be effectively segmented. Figure 5(b) shows the result of subtracting the transformed image from the original binary image. The extended-maxima transform result as shown in Figure 5(a) is similar to the original image, but with less white space per kernel. It is this “similar scaling” that enables the extended-maxima transform watershed segmentation algorithm to correctly segment touching seeds. Due to the irregularity of the size and shape of corn kernels, the higher the similarity between extended-maxima transformed image and original binary image is, the more likely some kernels have been lost. Figure 5(c) is an example of oversegmentation. However, when h is relatively small, Figure 6(b) shows that although every single kernel on the extended-maxima transformed binary image has shrunk the small kernels do not reflect the outlines of the original binary image very well. After the watershed segmentation, the segmented image shows “segmentation debris” at the border of touching kernels, shown in Figure 6(c). The number of kernels obtained by this process is often greater than the real number, but “segmentation debris” is often difficult to observe, so the miscount can easily go unnoticed.
3.2. Correct Segmentation
Observation and analysis of Figure 4: within the range of h before N1 has undergone its first step change, the points on N2 curve intersect the N1 curve giving the optimized segmentation threshold value h. The optimal range of the threshold parameter h can be obtained from Figure 4; in this case, there are two ranges, namely (0.21, 0.22) and (0.26, 0.36). Correct segmentation results are obtained in these threshold ranges. For example, taking h = 0.3 gives the extended-maxima transform image, subtraction image, and segmented labeled image shown in Figure 7.

Correct segregation (a) extended-maxima transform, (b) subtraction, and (c) labeled segments.
3.3. Experiment Results
We calculate the accuracy of the algorithm by segmenting 50 images, each of which contained 400 corn kernels. The results are shown in Table 1. The average number of segments is 399.46, the standard deviation is 1.05 segments, and the average segmentation accuracy rate is as high as 99.87%.
The segmentation results of touching corn kernels.

To observe the smoothness of the segmentation curve, we get boundaries of segmented regions which are labeling separately by different color, as is shown in Figure 8. By observing and analyzing the boundaries of the labeling region below, what can be concluded is that the majority of split curve is smooth between the adhesion of the particles. As for the closer and complicated adhesion phenomenon for some kernels, it can be seen from the segmented figure that few split curves show distortion phenomenon.

Boundaries of segmented region.
4. Conclusion
From the previous theoretical analysis and experimental results, we have shown that irregularly shaped corn kernels usually are oversegmented by the traditional watershed segmentation algorithm, which is harmful to subsequent image processing. This paper proposes an improved watershed algorithm based on the extended-maxima transform in which the threshold value parameter h is gradually increased. By comparing the statistical number of connected regions between an image transformed with the extended-maxima transform and that transformed with the watershed segment algorithm, the optimal range of threshold value can be obtained. Experimental data shows that, within the optimal range of the threshold value, touching kernels can be effectively segmented by the proposed algorithm, and the correct number of kernels can be obtained. The accuracy of segmentation is as high as 99.87%.
Footnotes
Acknowledgments
The authors gratefully acknowledge assistance from Professor Mike Hey from the University of Nottingham, Dr. John S. Hyatt from the Georgia Institute of Technology, and also give thanks to the China National Science and Technology Support Program (Grant no. 2012BAK08B04) and the Natural Science Foundation of Shandong Province (Grant no. ZR2012FL22).