
Abstract
Vibration characteristics of gravity-type caisson breakwater structures which have water-level variations are experimentally examined by using wave load excitations. To achieve the objective, the following approaches are implemented. Firstly, vibration analysis methods are selected to examine the dynamic characteristics of the lab-scale caisson. Secondly, vibration test on a lab-scale caisson which is installed in a two-dimensional wave flume is performed under several excitation sources and water levels. Thirdly, the compatibility of the wave-induced vibration responses is evaluated by comparison with the impact vibration responses, and the appropriate vibration analysis method is selected. Finally, the water-level effects on the caisson breakwater are examined based on the modal parameters which are experimentally measured for the 2D wave flume tests.
1. Introduction
Genesis frequency of large-scale typhoon has been increased and it results in huge losses of both life and property. In particular, coastal structures are directly faced with extreme wave loading condition. Due to these severe environmental phenomena and extreme events like typhoon or ship collision, structural integrity of harbor structure becomes a more important issue.
Most breakwater structures are constructed as gravity-type. Moreover, large gravity-type caissons become popular for constructing breakwaters. Despite the advance in the modern construction technology, damage in the harbor caisson breakwater is inevitable due to local failure or global instability problems which are mostly attributed to foundation-structure interface [1]. Goda [2] and Takahashi et al. [3] also reported that the sliding at the foundation-structure interface is the primary damage of caissons. Also, the cavity in foundation mound or the backfill makes harbor caissons weaker against extreme loads such as storm waves, mainly occurring from typhoon.
Figure 1 illustrates the local and global failures of the vertical breakwater. Oumeraci [4] has classified damage of vertical breakwater to overall failures and local failures. The overall failures such as sliding, overturning, and settlement, affect the stability of the entire structure. The local failures do not affect the structural stability as it is. The local failure, however, contributes to make unexpected water flow and it causes reduction of breaking performance of breakwater. Progress of the local failures can lead to the overall failures. It is noted that all damages of vertical breakwaters are related to integrity of the foundation mound. Therefore, the integrity monitoring of existing caisson structures is absolutely demanded.

Damage types of monolithic vertical breakwaters [4].
Since the early 1980s, many researchers have studied SHM techniques in the field of civil engineering [5–9] by mainly performing vibration-based damage monitoring of civil structures. Also, many researchers have worked on developing damage detection methods such as the modal sensitivity method, modal flexibility method, genetic algorithm, and neural network [10–15]. Research studies have focused mostly on inland structures, but only few research efforts have been made to harbor structures, including vibration response analyses of soil-structure or fluid-soil-structure interactions in harbor caisson structures [16, 17]. Also, Gao et al. [18] have studied dynamic response of caisson-type breakwater under various water levels to estimate added mass coefficient of water. On harbor caisson structures, there exist research needs to monitor their vibration responses and dynamic characteristics via the limited accessibility and to identify sensitive vibration responses of a row of caisson units which is damage in foundation or damage in interlocking members.
In this paper, vibration characteristics of gravity-type caisson breakwater structures which have water-level variations are experimentally examined by using wave load excitations. To achieve the objective, the following approaches are implemented. Firstly, vibration analysis methods are selected to examine the dynamic characteristics of the lab-scale caisson. Secondly, vibration test on a lab-scale caisson which is installed in a two-dimensional wave flume is performed under several excitation sources and water levels. Thirdly, the compatibility of the wave-induced vibration responses is evaluated by comparison with the impact vibration responses and the appropriate vibration analysis method is selected. Finally, the water-level effects on the caisson breakwater are examined based on the modal parameters which are experimentally measured for the 2-D wave flume tests.
2. Vibration Characteristics of Harbor Caisson Structure
2.1. Simplified Model-Based Vibration Monitoring
In this study, the vibration characteristics of the harbor caisson structure are examined by identifying the equivalent vibration responses of simplified 2D models. Due to the complexity and limitations in the field monitoring of real 3D caisson breakwaters, the vibration analysis via the 2D model can be an alternative choice. Figure 2 illustrates a simplified 2D planar model and a spring-dashpot model which represent a harbor caisson structure. On assuming that the 2D model is the physical representation of the real structure, therefore, the vibration response of the 2D model provides the analysis of the structural characteristics (e.g., mass, stiffness, and damping) of the real structure.

2-D simplified model of harbor caisson breakwater.
In the vibration analysis of the caisson breakwater, the main interests are in how to excite the massive gravity-type structure and how to measure the vibration response. As shown in Figure 3, there are two alternatives for the excitation: ship collision impact load and ambient wave load. Yi et al. [14, 15] reported that the ship collision can be a very accurate shaking mechanism to measure vibration responses of caisson breakwaters. However, the ship collision test is not easy to apply in practice due to its dependability on weather conditions and potential dangers in operation. So a wave-induced loading can be an alternative choice, but there are many unanswered features related to the wave-induced vibration monitoring. Among many others, the variation of water levels and the change in incident wave characteristics are two key parameters that should be examined to prove feasibility of wave-induced vibration monitoring.
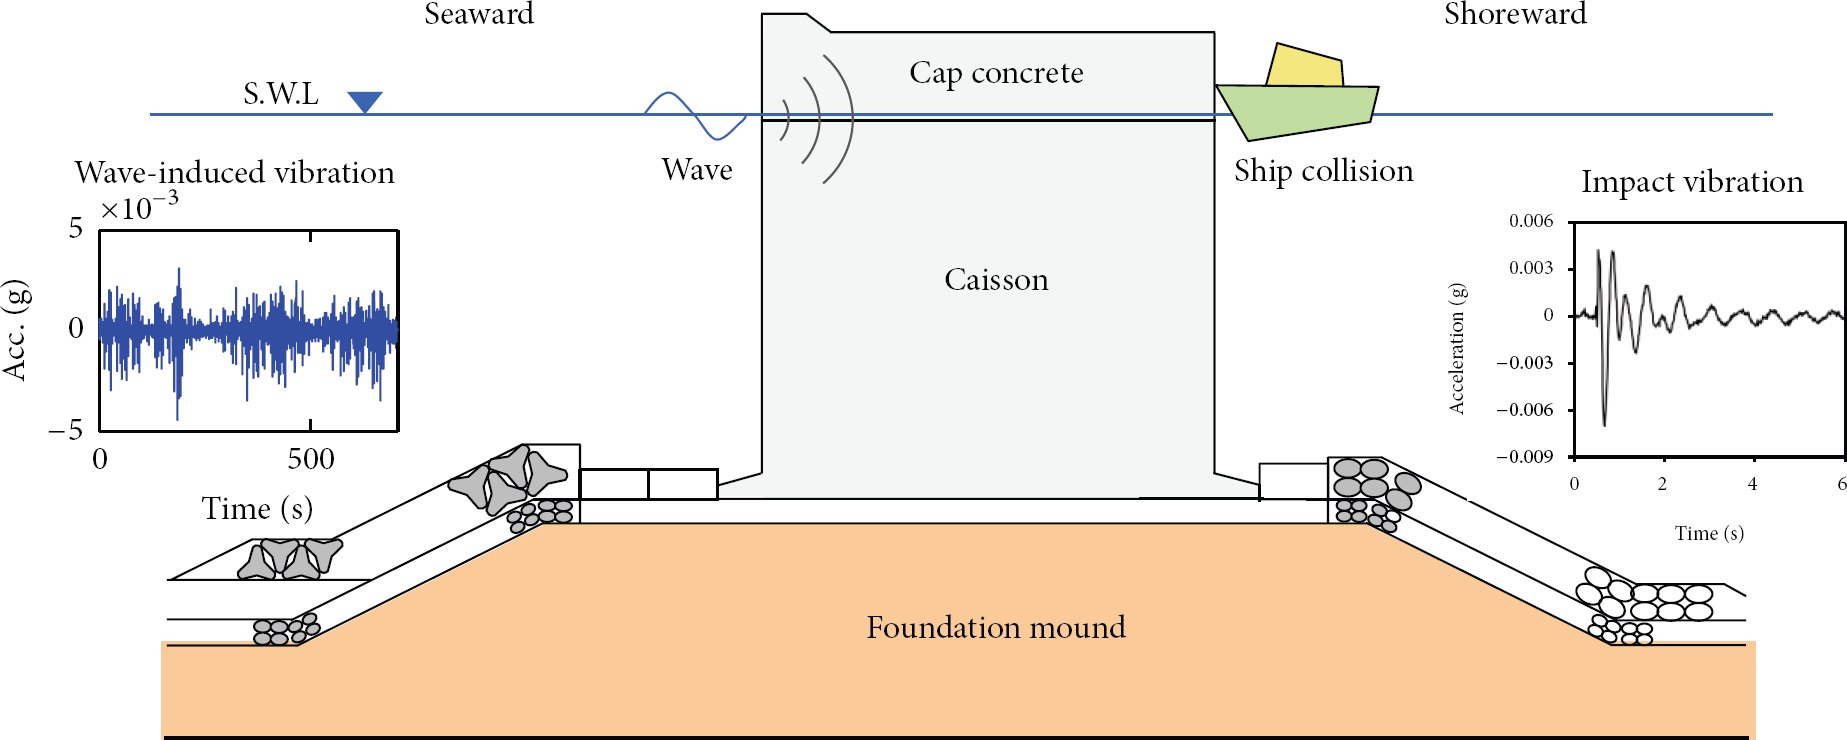
Schematic of dynamic tests on harbor caisson breakwater.
2.2. Vibration Response Analysis Method
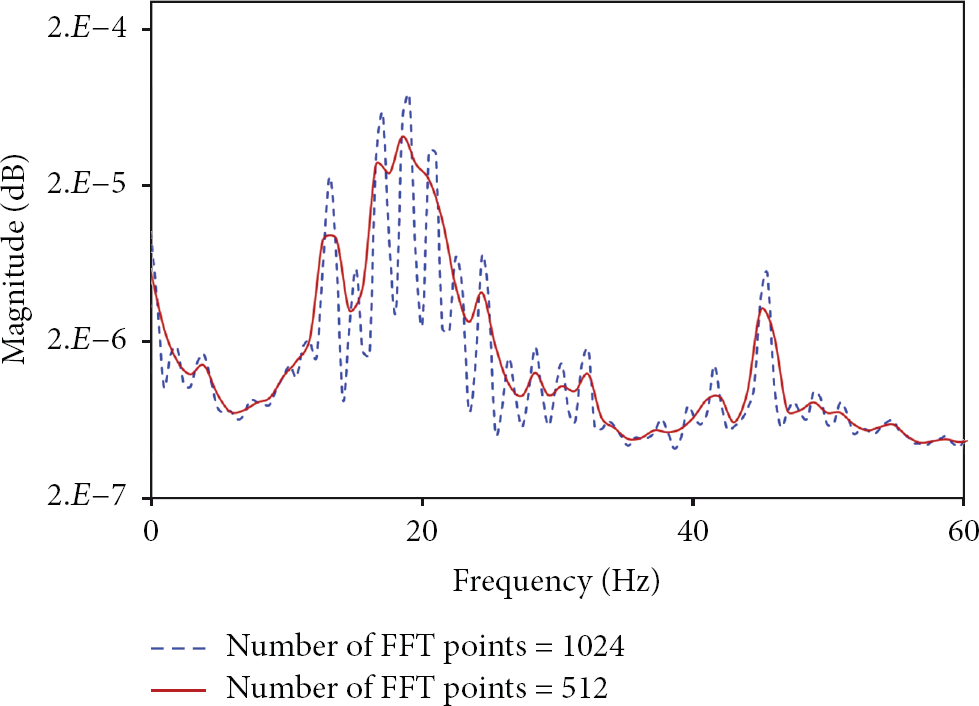
2.2.1. Power Spectral Density
The relationship between input loads

2.2.2. Frequency Domain Decomposition Method
Frequency domain decomposition (FDD) method is used to extract modal parameters such as natural frequency and mode shape [20]. Singular values of the PSD function matrix

The decay of the amplitude of motion may be conveniently expressed by the logarithmic decrement which is defined as the natural logarithm of the ratio of any two successive peak amplitudes

2.2.3. Stochastic Subspace Identification Method
The stochastic subspace identification (SSI) method utilizes the singular value decomposition (SVD) of a block Hankel matrix with cross-correlation matrix of responses as follows:


3. Experiments on Lab-Scale Caisson in 2-D Wave Flume
3.1. Experimental Setup
To examine the vibration response of a submerged caisson, dynamic tests on the caisson structure are implemented. The experiments were carried out in a wave flume at the Institute of Ocean Hydraulics of Pukyong National University, Republic of Korea. The flume is 35 m long, 1 m wide, and 1 m deep with glass walls. The wave flume has a longitudinal middle wall from the half point of the flume length to the end of the flume (i.e., absorber side). Therefore, only 48.5 cm of the width is used for the experiment. The wave generator is a piston-type paddle which is capable of generating regular and irregular waves and equipped with the active absorption of reflected waves. A wave absorber is located at the end of the flume.
A real caisson breakwater located at Oh-Ryuk-do breakwater in Republic of Korea is selected as the target structure. The caisson model was designed for 2-D wave flume and all components of the test were prepared as 1/58 scale-down size. Four components of the structure include caisson body, cap concrete, and two adjacent blocks. The inner wall of the real caisson is ignored for the lab-scale caisson. All four components have shear keys to reflect interlocking effects between adjacent caissons. According to the limitation of the width of the 2-D wave flume, two concrete blocks were adopted by replacing adjacent caissons. Figure 4(a) illustrates the dimension of all components of test structure. The caisson has 34 cm of height and 34 cm of width; it also includes the empty inner space with vertical wall of 5 cm thickness. Height of the cap concrete is maximum 10 cm. Bottom dimension of the concrete is the same as that of the caisson. To make the caisson fit to the side wall of the wave flume, two adjacent blocks have 6 cm thickness except for the part of shear keys. Figure 4(b) shows the installed test structure in the 2-D wave flume. The caisson and the cap concrete were installed on the foundation mound with the adjacent block. Detailed cross-section view of the test setup is illustrated in Figure 5.

Experimental setup of lab-scale caisson model.

Cross section of test setup in the 2D wave flume.
To simulate the installed condition of the real breakwater, the test structure and the foundation were set up on the 2-D wave flume. The foundation mound consists of sand layer, gravel layer, and tetra pod (TTP) layer. The sand layer and the gravel layer represent a gravel mound and an armor gravel of the real caisson breakwater, respectively. The sand layer is approximately of maximum 10 cm thick and 1 m long. The gravel layer is mainly 2 cm thick and it covers the entire sand layer. For the wave generator side (i.e., seaward in the real), the TTP layer was set for wave energy dissipation.
Vibration responses were measured by an acceleration acquisition system which consists of accelerometers, a signal conditioner, terminal blocks, a DAQ card, and a laptop. Accelerometers used for the test are PCB 393B04 model which has ±5 g of measureable range and 1 V/g of sensitivity. The accelerometers were installed on the cap concrete to measure the vibration response of the caisson as shown in Figure 6. Lee et al. [21] show that the rigid body motion is sensitive to the variation of foundation integrity. In this study, the rigid body motion is selected as the target motion. Also, the limited accessibility at the on-site field area was considered for the installation of the sensors for the lab tests. To extract the rigid body motion, sensors were installed in y- and z-axes for four points.

Sensor orientations and excitation points.
3.2. Test Scenarios
To examine the water-level effects on the caisson model by using the wave-induced vibration responses, the water level in 2-D wave flume was controlled as follows. Three water levels in 2-D wave flume were designed to give different water level conditions on the caisson. Tidal condition at the field area is reflected on the designed water levels. Three water levels are indicated in Figure 5. Water depth, h, of the highest water level (i.e., WL1) is 460 mm and that of the lowest water level (i.e., WL3) is 416 mm. The gap of each water level is 22 mm and it is 6.5% of the caisson height.
To excite the caisson, two excitation sources were employed: (1) wave load and (2) hammer impact. For the wave load excitation, the extreme waves which have 12.5 cm wave height and 1.97 seconds wave period were generated by the wave maker and applied to the model caisson. For the hammer impact, the rubber hammer was used to manually apply the impact force by a test implementer. For the wave load excitation, acceleration responses were measured during 120 seconds. It is noted that the wave generator was operated in the first half of the period and turned off in the second half. Acceleration responses were measured during 20 seconds for the hammer impact.
4. Effect of Water-Level Effect on Vibration Characteristics of Caisson Breakwater
4.1. Vibration Responses Analysis of Lab-Scale Caisson
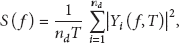
To examine the compatibility of the wave-induced vibration responses for analyzing the vibration characteristics of the caisson, the vibration tests were performed by using the two excitation sources (i.e., the wave load and the hammer impact). Acceleration signals of the caisson structure are shown in Figure 7. As the wave load was applied to the caisson model, the maximum acceleration was 0.005 g. Even the extreme waves (which have 12.5 cm wave height and 1.97 seconds wave period) were applied to the caisson structure; relative small responses were measured as compared to that of the impact hammer excitation. Acceleration responses were rapidly decreased after turning off the wave generator. As the hammer impact was applied to the caisson model, the impact period was 1.6 seconds on average and the maximum acceleration was 0.31 g. The impact excitations were applied manually, so that all impact responses were different in magnitudes.
Vibration signals of lab-scale model.
4.1.1. Power Spectral Density of Vibration Responses
The PSDs of the acceleration signals were calculated by using (2). In this study, the excitation was applied to the y-direction, along which vibration responses were analyzed on frequency domain. For the highest water-level (WL1), the PSDs were extracted from the y-directional response of point 1, as shown in Figure 8. The number of FFT points is 1024 for calculation of the PSD and its resolution is 0.4883 Hz.

Power spectral densities of vibration signals for the highest water level.
For the wave load excitation, many peaks are observed in the frequency range of 0 to 60 Hz. For the hammer impact, only two peaks are observed in the frequency of 0 to 60 Hz. In Figure 8(b), the two peaks are the resonance peaks corresponding to the first and the second natural frequencies (i.e., 17.15 Hz and 42.50 Hz).
Next, we examined the source of many peaks of the wave load excitation in Figure 8(a). Figure 9 shows three PSDs with different measuring time sets: (1) 0–120 seconds for the entire period, (2) 0–60 seconds for the period during the operation of the wave generator, and (3) 60–120 seconds for the period after turning off the wave generator. For the PSDs corresponding to the measuring time 0–120 seconds and the measuring time 0–60 seconds, most of the peaks have relative differences in magnitudes. On the other hand, the PSD of the measuring time 60–120 seconds when the wave generator is turned off has relatively small magnitude in the frequency range higher than 10 Hz. As the incident waves repeatedly hit the caisson wall, extra random waves are generated due to the reflection, breaking, and modulation of waves. According to the wave transformation or modulation, many peaks related to the waves and structural behaviors are observed in the PSD results. The peaks corresponding to the resonance peaks of the hammer impact responses cannot be determined based on only the PSD results.

Power spectral densities for wave-induced vibration signals of different time sets.
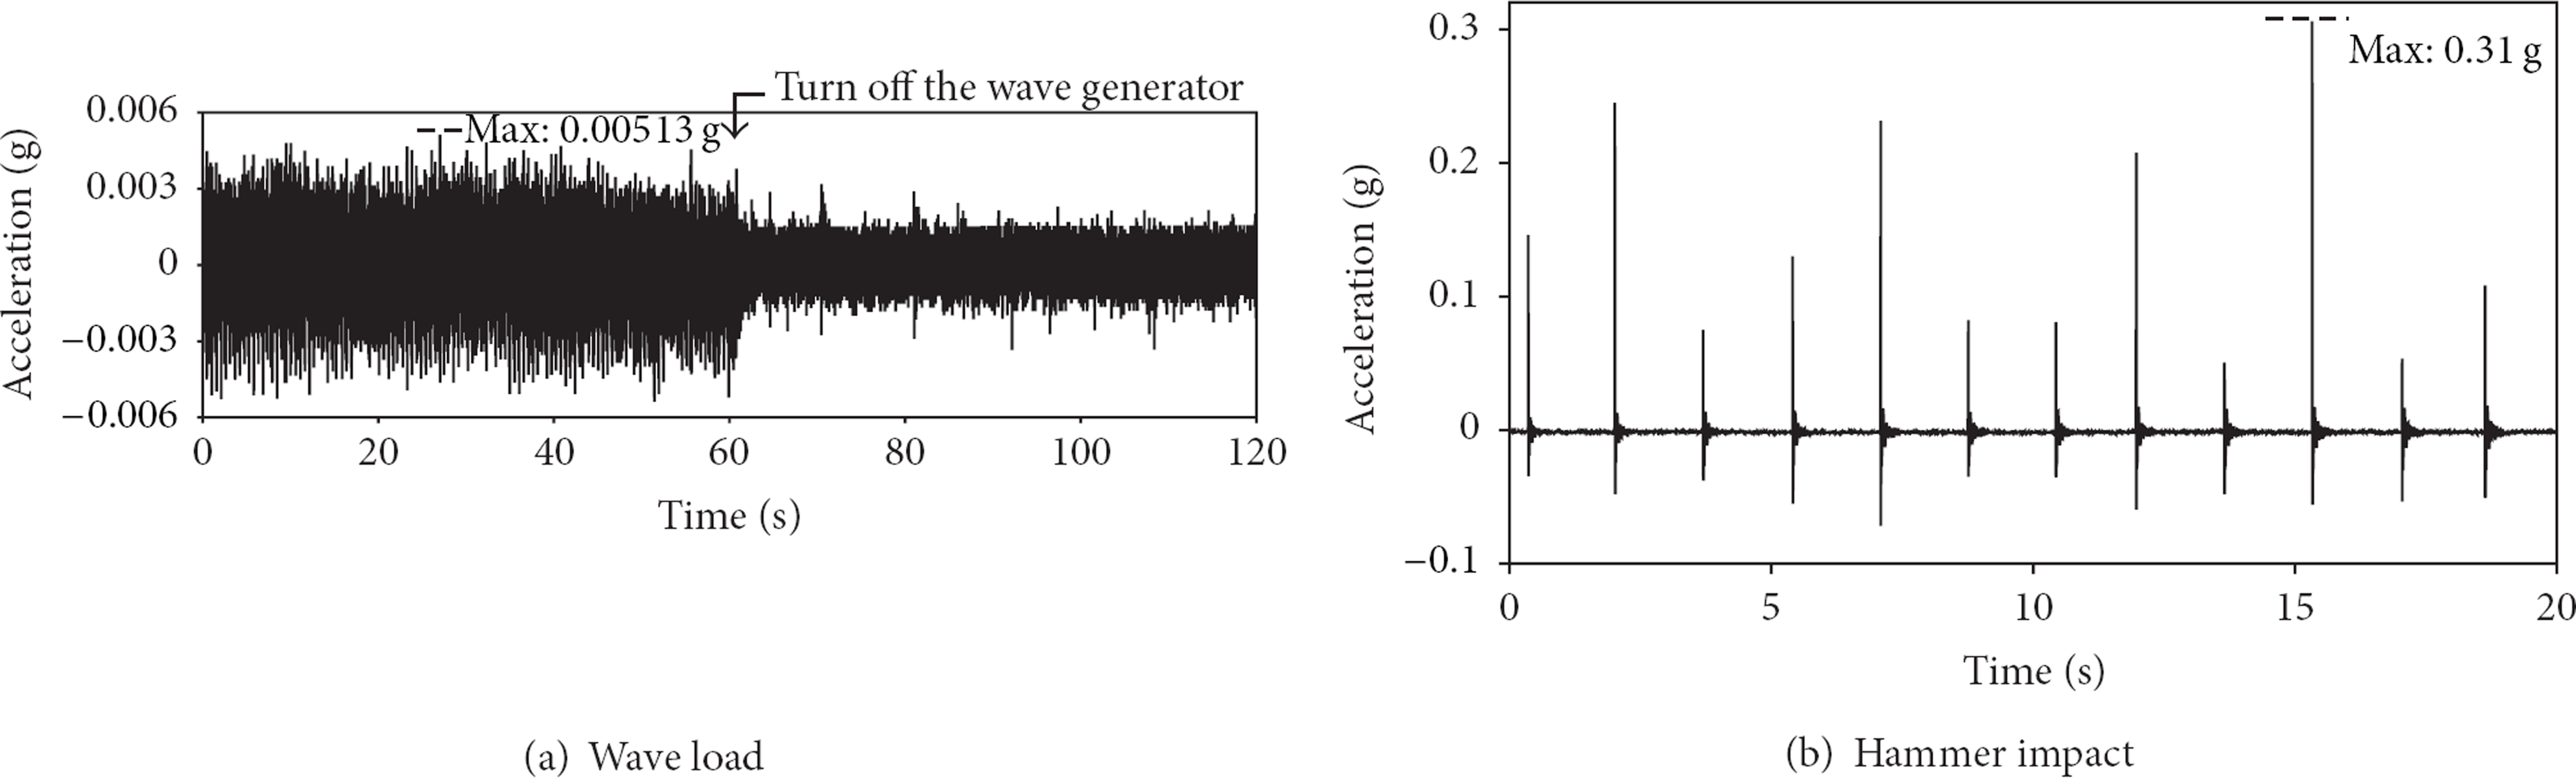
To eliminate the peaks which do not represent structural modes, the PSD analysis was performed by using the lower number of FFT points, 512, and it gives the resolution of 0.9766 Hz. Figure 10 shows the PSDs of the acceleration signals with two different resolutions. The peaks become weaker but they still exist except very small peaks. Additional future study is demanded to identify structural modes of the wave-induced vibration responses by the use of the PSD-based method.
Power spectral densities for wave-induced vibration signals of two different FFT resolutions.
4.1.2. Extraction of Modal Parameters
For the extraction of modal parameters such as natural frequency, damping coefficient, and mode shape, frequency domain decomposition (FDD) method and stochastic subspace identification (SSI) method are selected. As previously reported by Yi and Yun [20], both methods are accurate for the extraction of modal parameters. However, their performances on gravity-type harbor structures are not reported yet. Therefore, vibration responses under the highest water level (WL1) were utilized to compare their performances on the extraction of modal parameters of harbor caisson model.
For the FDD method, the singular value matrix was extracted by using (3). Figure 11 illustrates the first columns of the singular value matrices for the highest water level, WL1. In the figure, the solid lines indicate the singular values. Also, the extracted modal parameters by the FDD method were summarized in Table 1. Two modes are observed at about 17 Hz and 42 Hz. The results of two excitation sources are shown well matched in natural frequency but different in damping ratios. The damping ratios are observed as 1.28% for mode 1 and 0.58% for mode 2 for the wave load excitation and observed as 8.34% for mode 1 and 3.45% for mode 2 for the hammer impact. The 2-D planar mode shapes are extracted as shown in Figure 12. The mode shapes are extracted from the vibration responses of the sensors installed on the top of the caisson as shown in Figure 6. Both mode shapes of mode 1 and mode 2 are the y-directional sway motions.
Natural frequencies and damping ratios for the highest water level.

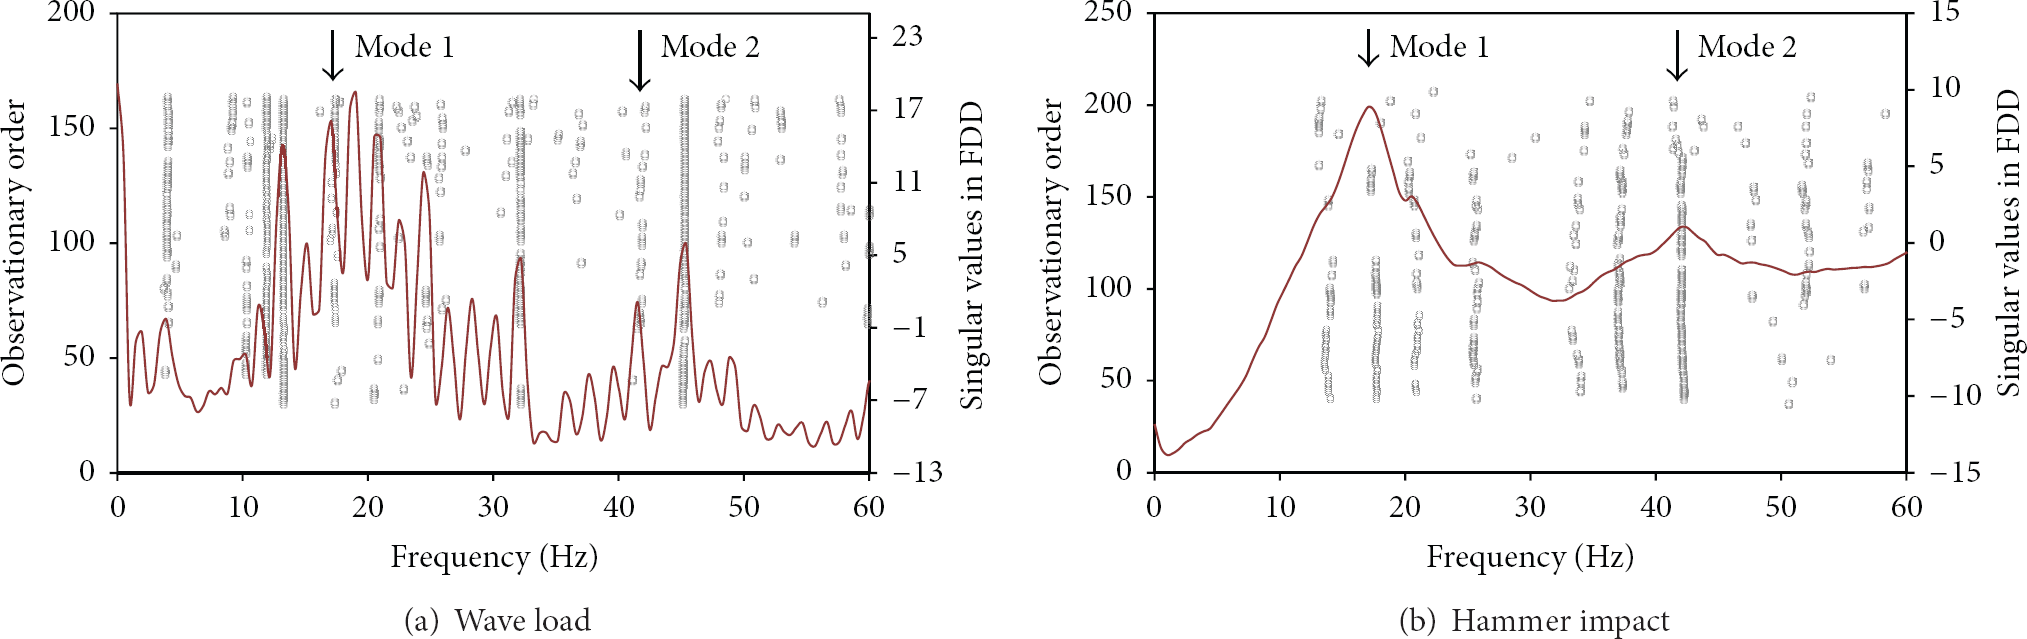
Stabilization charts of SSI method and singular values of FDD method (WL1).
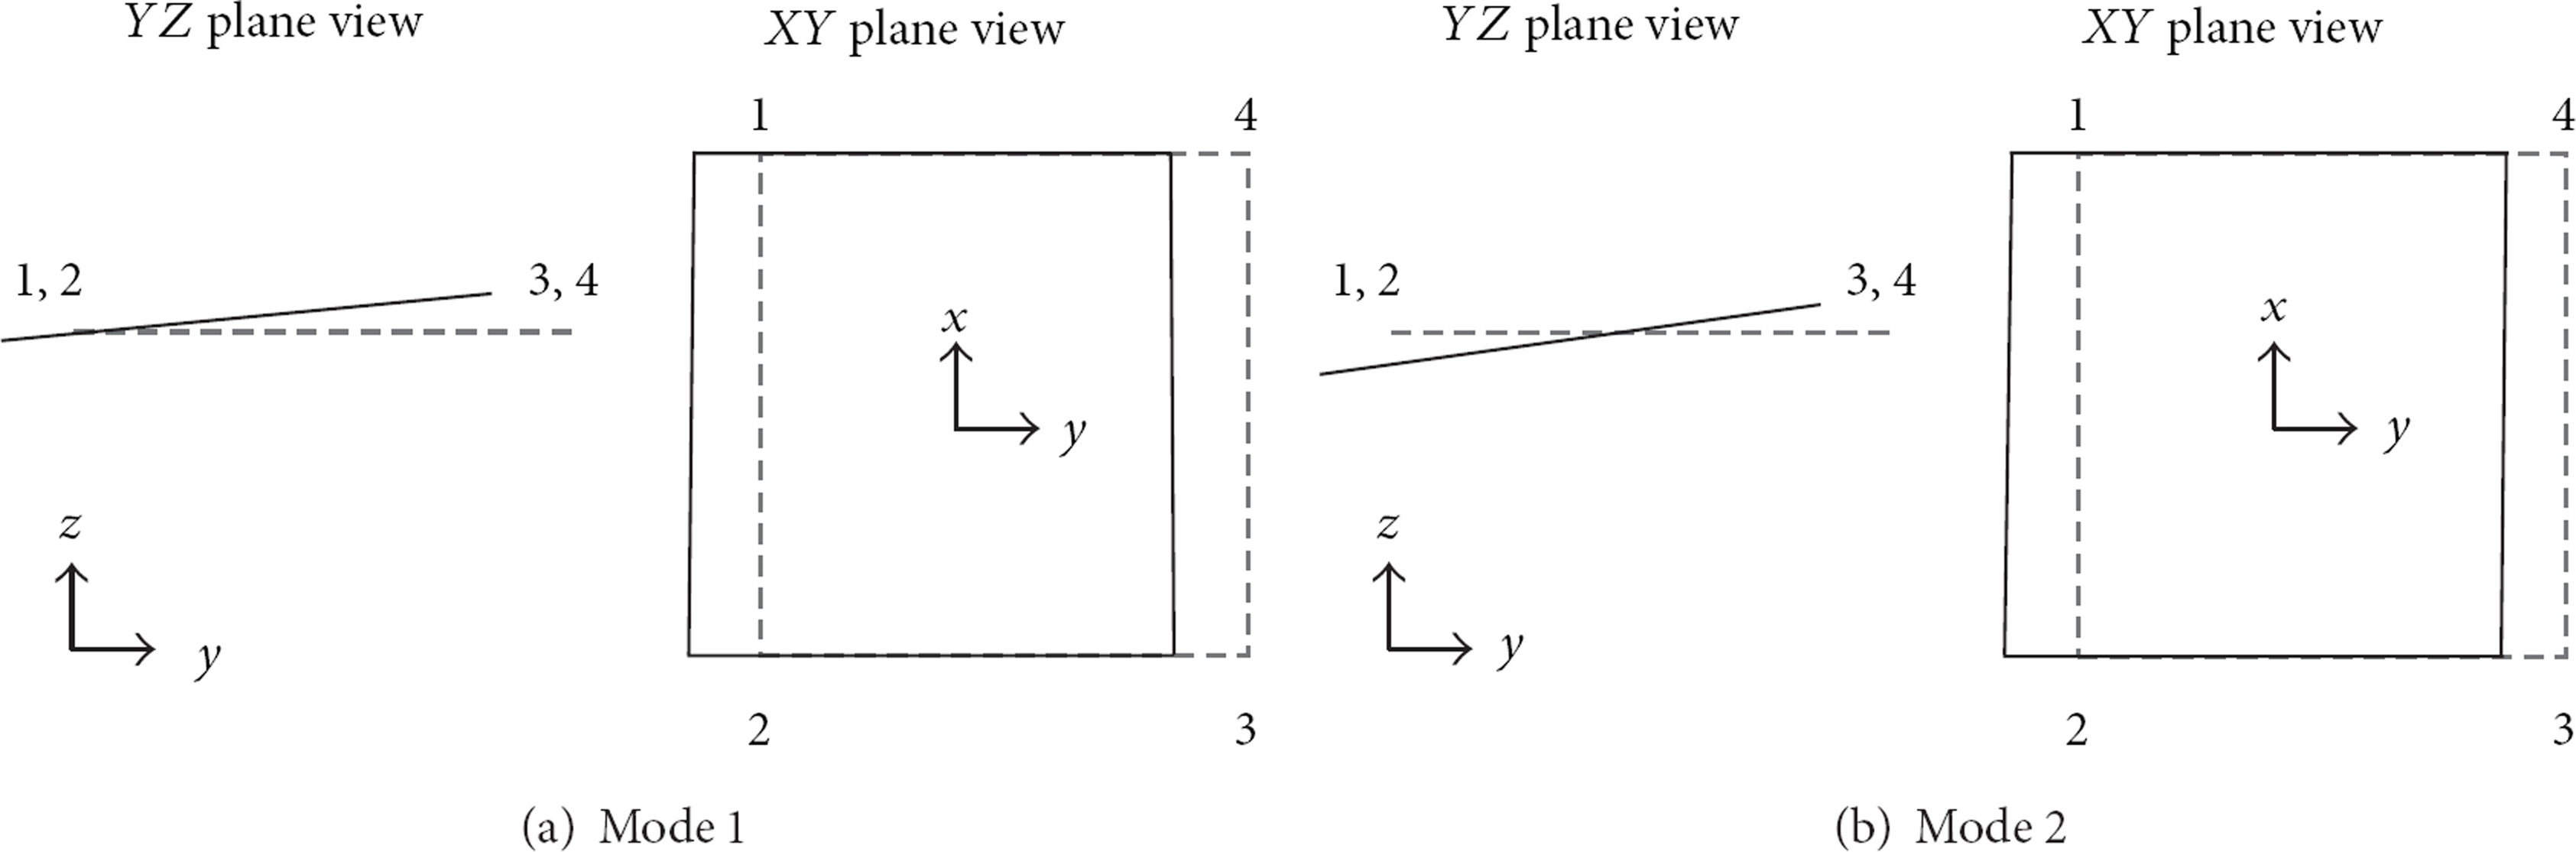
First two mode shapes of caisson structure by SSI method.
In the SSI method, the Hankel matrix was calculated by using (5) and the stable modes were identified by stabilization chart analysis. The stabilization charts are illustrated in Figure 11 and the extracted modal parameters are summarized in Table 1. In the figure, the grey circles indicate the stable mode. Two modes are observed at about 17 Hz and 42 Hz. Damping ratios of each mode are calculated by (6). The results of two excitation sources are shown to be well matched in natural frequency but different in damping ratios. The damping ratios are observed as 2.14% for mode 1 and 0.05% for mode 2 for the wave load excitation and observed as 8.26% for mode 1 and 3.88% for mode 2 for the hammer impact. The mode shapes are also extracted and both mode shapes of mode 1 and mode 2 are the y-directional sway motions similar to the results of the FDD method.
In case of the wave excitation, many modes are observed in the frequency range of 0 to 60 Hz. Regular waves were generated as the excitation load and it is observed not only the structural responses but also characteristics of the incident waves and its transformed waves. Therefore, it is difficult to distinguish structural modes from detected modes. As a result of hammer impact, only two structural modes are observed. It was used as the reference information of modal characteristics of caisson system. For mode 1, there are closer peaks around the peak of mode 1 in the singular values of FDD method (see Figure 11(a)). So, we cannot make sure which one is the mode 1 from the result of the FDD method. However, mode 1 can be distinguished among the closer peaks by the use of the results from both the FDD and the SSI methods together. Note that the SSI method shows consistent results in the extraction of natural frequency and mode shape.
4.2. Effect of Water-Level Variation on Vibration Responses
To examine the effect of water-level variation on the caisson modal parameters, the natural frequency and the damping ratio are extracted by the SSI method, which produces more consistent results as described previously. The modal parameters were extracted for three different water levels. The natural frequencies and the damping ratios are summarized in Table 2.
Variation of modal parameters due to water-level changes.

As illustrated in the stabilization chart shown in Figure 13, natural frequencies of the wave-induced vibration responses are analyzed with respect to the water level changes. For the wave load excitation, the natural frequencies increase gradually as the water level decreases. In mode 1, 8.32% of natural frequency is increased when the water level decreases of 6.5% of the caisson height. Also, 22.05% of natural frequency is increased when the water level decreases of 12.9% of the caisson height. In mode 2, the changes in the natural frequencies are up and down as the water levels decrease, which maybe partially due to measurement uncertainty. The damping ratios show the decrease tendency in mode 1 as the water levels decrease but rather in irregular pattern in mode 2.

Stabilization chart of SSI method: change in natural frequency versus change in water level.
For the hammer impact excitation, the natural frequencies of mode 1 also increase gradually as the water level decreases. In mode 1, 1.30% of natural frequency is increased when the water level decreases of 6.5% of the caisson height. Also, 10.51% of natural frequency is increased when the water-level decreases of 12.9% of the caisson height. In mode 2, the changes in the natural frequencies are up and down as the water levels decrease, which maybe partially due to measurement uncertainty. The damping ratios show the decrease tendency in mode 1 as the water levels decrease but rather in irregular pattern in mode 2.
5. Conclusion
In this paper, vibration characteristics of gravity-type caisson breakwater structures which have water level variations were experimentally examined by using wave load excitations. To achieve the objective, the following approaches were implemented. Firstly, vibration analysis methods were selected to examine the dynamic characteristics of the lab-scale caisson. Secondly, vibration test on a lab-scale caisson which is installed in a two-dimensional wave flume was performed under two excitation sources and three water levels. Thirdly, the compatibility of the wave-induced vibration responses was evaluated by comparison with the impact vibration responses, and the appropriate vibration analysis method is selected. Finally, the water-level effects on the caisson breakwater are examined based on the modal parameters which are experimentally measured for the 2-D wave flume tests.
The following observations and conclusions have been made. The vibration responses of the caisson reflect not only the caisson structural behavior but also the characteristics of the incident waves and the transformed (or modulated) waves. So, it is rather difficult to identify vibration features from the wave-induced vibration responses. However, in case of that, the information of structural modes is known and the reliable modal features can be extracted from the combined use of both SSI method and FDD method. Also, it is observed that the effect of water-level on the caisson's modal parameters can be estimated from the wave-induced vibration responses via SSI method. The effect of water level is more sensitive to the lower mode of the caisson. As the water level decreases, the natural frequency increases gradually and damping ratio decreases.
Footnotes
Acknowledgments
This work was supported by the Pukyong National University Research Abroad Fund in 2012 (C-D-2012-0915). The authors would like also to acknowledge the financial support of the Project “Development of inspection equipment technology for harbor facilities” funded by Korea Ministry of Land, Transportation, and Maritime Affairs.