
Abstract
In large-scale machine-to-machine sensor networks, the applications such as urban air pollution monitoring require information management over widely distributed sensors under restricted power, processing, storage, and communication resources. The continual increases in size, data generating rates, and connectivity of sensor networks present significant scale and complexity challenges. Traditional schemes of information management are no longer applicable in such a scenario. Hence, an elastic resource allocation strategy is introduced which is a novel management technique based on elastic computing. With the discussion of the challenges of implementing real-time and high-performance information management in an elastic manner, an air pollution monitoring system, called EIMAP, was designed with a four-layer hierarchical structure. The core technique of EIMAP is the elastic resource provision scheduler, which models the constraint satisfaction problem by minimizing the use of resources for collecting information for a defined quality threshold. Simulation results show that the EIMAP system has high performance in resource provision and scalability. The experiment of pollution cloud dispersion tracking presents a case study of the system implementation.
1. Introduction
Recently, an increasing amount of research interest has been drawn towards data management in large-scale machine-to-machine (M2M) sensor networks [1–3], where a large number of high-throughput autonomous sensor nodes communicate directly with each other without human intervention and can be distributed over wide areas. M2M sensor networks have found their applications ranging from home monitoring to industrial sensing, including environment and habitat monitoring, traffic control, and health care. Such networks are usually characterised by a large number of sensors, wide coverage areas, a huge amount of data, complicated connectivity, and increasingly stringent response-time requirements. Their applications normally require data management over widely distributed sensors under restricted power, processing, storage, and communication resources. The continual increases in size, data rates, and connectivity of sensor networks present significant scale and complexity challenges. This is especially true when the computational resources available are limited. Thus, efficient support from sensor data management for data acquisition, transmission, storage, and retrieval becomes critical [4].
1.1. Motivation
Current research on information management for sensor networks has increasingly focused on real-time sensor data collection and sharing of computational and storage resources for sensor data processing and management. Technologies that support the building of large-scale infrastructures, integrating heterogeneous sensors, data, and computational resources deployed over a wide area accelerate the integration of sensor networks with distributed computing, grid computing, and even the state-of-the-art cloud computing. Recent researches on large-scale M2M sensor networks bring about some instructive designs of information management frameworks. For example, our former work in [5] designed a grid-based sensor information management platform. It obtains a high resolution of pollution characteristics in urban environment by high-density distributed sensors. Research in [6] investigates a feedback-based model-driven push approach to support user queries. It presents a two-tier sensor architecture which develops sensor proxies at higher tier that each proxy controls tens of sensors at lower layer. In order to support energy-efficient query processing, sensors only transmit deviations to proxies compared with model-predicted values, which makes the system depend highly on the model calculated from past observations. Methods of parallel processing of data in sensor networks are discussed in [3], where the authors investigated how much degree existing distributed database solutions and programming models (e.g., MapReduce) are suitable for large-scale sensor network data processing. Based on the analysis, a general architecture for different data processing applications is developed. A similar data processing approach is proposed in [7]. The idea is to use distributed databases to store sensory data and MapReduce programming model for large-scale sensory data parallel processing. An interesting and useful implementation in this approach is that it employs cloud-based storage and computing infrastructure, which is remarkable for the research and design in this paper.
However, as the amount of information monitored by an M2M sensor network increases, two key issues arise in this context that cannot be addressed by existing approaches.
1.1.1. Effectively Avoiding Information Overload
This is done by organizing information collection and processing to focus on analysing only information relevant to the user needs. This includes deciding what information each of the sensor units should be collecting, at what rates, how and where it is processed, summarized, and stored, what information should be exchanged between the sensors, and how all such information should flow within the network. Tradeoffs between whether only local information collected from one sensor or global information collected from all sensors arise when addressing these decisions. This kind of on-demand processing has to eliminate overprovisioning when used with utility pricing. It is also expected to be able to remove the need to overprovision in order to meet the demands of millions of users.
1.1.2. Efficiently Maximizing the Value of Collected Information under Resource and Real-Time Constraints
A finite number of sensor units exist, and each has finite processing capacity, memory, and storage size, communication bandwidth, and battery power available to it. Tradeoffs occur since allocating a group of sensors to explore a particular geographic region would mean fewer resources available for exploring other areas. Similarly, within one region, assigning more processing or memory capacity to explore the features of a particular event in detail would mean less capacity available to explore other events. However, for real-time applications, the underlying algorithms require that the services quality improvement be monotonic to the consumption of the resource needed. In this case, how to identify the critical information needed and intelligently allocate resources to get it are a key point that deserves further research.
Based on the consideration of these issues, a vehicle/person-mounted air pollution monitoring system EIMAP (the acronym for “Elastic Information Management for Air Pollution”) is proposed in this paper. This system has a four-layer architecture which can contain thousands of sensors distributed over an entire urban area to monitor airborne pollutants including SO2, NO, NO2, benzene, and ozone. The data volume that needs to be processed varies from several bytes (individual readings per sensor per minute that are used to identify irregularities and anomalies in real time) to 8 GB (whole readings per sensor per day that are used to capture high-resolution urban air pollution distribution resulting from transportation down to the single building level). In order to provide flexible resource for such large volume-variant data flows, an elastic resource allocation mechanism was introduced to EIMAP system. The key difference between our system and existing approaches is that EIMAP is endowed with data-aware QoS-driven capability for sensor management. Whether a sensor is active or not does not only depend on the energy-efficient consideration, but also, and more importantly, rely on the environment that the sensor resides, and in how much degree it is required to provide resource to the task.
1.2. Research Contributions
Our design of EIMAP has led to the following main contributions.
(1) Introducing Elasticity to Large-Scale M2M Sensor Information Management. Elasticity captures a fundamental aspect of cloud computing: when limited resources are offered for potentially unlimited use, providers must manage them elastically by scaling up and down as needed [8]. Elastic information management (EIM) is a technique that is based on elastic computing (EC), which is a feature of cloud computing. In [9], EC is defined as the use of computer resources which vary dynamically to meet a variable workload. The mathematical definition of elasticity in economics is

(2) Developing a Scheduling Algorithm for Real-Time Resource Allocation. This algorithm overcomes the disadvantage of fixed resource provision strategy, which is not adaptive in changing environments. It also takes into account both of the resource provision and environmental feature detection by modeling it as a constraint satisfaction problem of minimizing the use of resources in a sensor network for collecting monitoring information at a defined quality threshold. The experimental results show that this algorithm performs well in elastic resource allocation.
1.3. Paper Layout
The remainder of this paper is organized as follows. In Section 2, we discuss the related work in the areas of information management in M2M sensor networks and resource allocation strategies for information management. Section 3 addresses the challenges by introducing EIMAP which comprises a four-layer hierarchical information management architecture. In Section 4, the design of the scheduler for elastic management is presented with the pseudocode for each part of the scheduling algorithm. Section 5 analyses the performance of the scheduling algorithm and simulates the EIMAP system in the WikiSensing sensor data management platform to evaluate the capability of the concurrent streaming management. Section 6 presents a case study of air pollution monitoring in East London. Section 7 concludes the paper with a summary of the research and a discussion of future work.
2. Related Work
2.1. Information Management in M2M Sensor Networks
Information management for sensor networks has been drawn much research attention for decade [11–13]. In a large-scale sensor network for air pollution monitoring, although one would often be more interested in highly polluted areas in environmental monitoring, a quick response to a pollution event related to other areas or time snapshots would usually be highly desirable. Information management for such an application will focus more on defining the events, or the feature of interests, which involves the techniques of data representation, summarization, and organization. To do so, techniques of improving the performance of query under resource constraints have been developed in recent years. For example, several approaches have focused on adaptive sampling techniques which aim to restrict, in an intelligent way, the amount of information gathered within the network. A popular approach is based on using Kalman filters [14] which enable a group of sensors to respond to and track fast moving signals in a slowly changing background. For the QoS management, the Aurora system [11] developed by Brown University and the TinyDB [15, 16] system developed by MIT all provide QoS managing strategies to support reliable services.
Other systems have focused on efficient data summarisation to facilitate query propagation/processing and to improve distributed data storage within the networks. For instance, the BBQ system [17] maintains a correlation-aware probabilistic model in a base station to provide a robust interpretation of sensor readings. Data acquisition from sensors happens only when the model is not able to offer approximate answers to certain queries with acceptable confidences. StonesDB [18] applies a multiresolution scheme, generating two summary streams (wavelet-based summary and subsampled summary streams) from input data streams. In [19], the authors addressed the problem of the information-driven management criteria for sensor networks. They proposed a novel measurement for usefulness of information: uncertainty reduction rather than information gain is used to justify the performance of the information-driven performance. Other techniques, such as synopses-based approximate answers [20], histogram analysis [21], and wavelet-based data summaries [22, 23], can all be used to investigate how to guarantee high accuracy and speed of data summarisation.
2.2. Resource Allocation for Information Management
Resource allocation is a key technique for information management. Many attentions have been paid to this area in recent years. The research generally has two categories: one is to develop novel system infrastructures to meet different resource allocation demands; another is to design high performance algorithms to support fast resource allocation computation.
For the first category, [24] investigated the challenges of resource allocation for reconfigurable multisensor networks. The authors discussed the problems of resource allocation under environmental and technical constraints. A hierarchical model was proposed in this paper but not concrete resource allocation strategy was presented. For efficient resource allocation, hierarchical or layered system architectures can be studied in many papers. For example, in [25], the researchers designed a layered distributed system and extended the existing disjoint coalition formation protocol to solve the multi-sensor task allocation problem which aims to automatically decide the best sensors to specified task; in [26], a market-based 4-layer architecture was presented for adaptive task allocation which formulises the pricing mechanism to achieve a fair energy balance among sensor nodes while minimizing delay; [27] designed a two-tiered on-demand resource allocation strategy which is specially designed for VM-based computing environments.
For the second category, most of the algorithms treat the resource allocation problem as an optimisation. They usually handle tradeoffs between system performance and resource constraints. [28] discussed two tradeoffs in health monitoring sensor system. The authors addressed two optimisation problems in this paper, one of which is to obtain sustainable power supply, while another one is to achieve high quality of service. The solutions to two optimisation formulas were given as well. Groot et al. analysed an adaptive optimisation for the tradeoff between resource allocation and the reconfigurable resources within the multi-sensor network in [29]. The resource allocation algorithm aims to maximize the system utility by finding the optimal set of services. [30] considers sensor assignment problems in both static and dynamic sensing environments. Heuristic algorithms were studied to address the NP-hard optimisation problems. Other schemes for the category can also be seen, such as agent-based algorithm [31] and posterior-based decision making scheme [32].
3. Elastic Sensor Network Architecture
The key feature of the EIMAP architecture is using autonomous sensors, whether fixed or mobile, to provide coverage of a specific geographical area to collect real-time pollution data on key aspects such as traffic conditions, vehicle emissions, ambient pollutant concentration, and human exposure. The focus of constructing an EIMAP system is related to the data management, computation management, information management, and knowledge discovery management associated with the sensors and the data they generate, and how they can be addressed in real-time within an open computing environment. To do so, in this section, we first analyse the challenges in implementing such a system, and then we propose a four-layer architecture to address these challenges.
3.1. Challenges in Implementing EIMAP System
Considering the resource characteristics of large-scale M2M sensor networks, the main issues and challenges related to constructing an elastic system are as follows.
3.1.1. Dynamic Interactivity via M2M Architecture
Within a mobile sensor network, the sensors themselves naturally form an M2M network and communicate with each other through it. In order to satisfy the real-time analysis requirements, the sensors themselves will have to store part of the information and communicate with each other within the M2M network. The measurements from the sensors, both mobile and static, will be filtered and processed using a set of specialized algorithmic processes, before being warehoused in a repository. The design and implementation of a suitable M2M sensor architecture will need to satisfy the real-time analysis requirements as well as decide the data storage/communication tradeoffs. The sensors in such a system will need to be equipped with sufficient computational capabilities to participate in the elastic environment and to feed data to the warehouse as well as perform analysis tasks and communicate with their peers.
3.1.2. Elastic Resource Allocation under Resource Constraints
In such a scenario, strategies of allocating or scheduling finite sensing resources for exploring surveillance regions in more detail have to be proposed. One also has to take into consideration the dynamic changes that occur in the sensed environments. We model this scheduling problem as a constraint satisfaction problem for selecting a particular resource allocation strategy for maximizing the value of information collected at any time step. Such resource allocation needs to take into account constraints on the resources, the decision-making time (e.g., the value of information may diminish if its transmission is delayed), and other problem-dependent constraints (e.g., a need to keep full coverage of a particular area or particular events using a minimum number of sensors). Hence, the strategies of allocating or scheduling have to be able to (a) define the resource and application constraints together with the associated solvers and (b) estimate the increased information (information gain) every time step for the different strategies through the selection of the appropriate measures in terms for its completeness, quality, and reliability.
3.2. EIMAP Hierarchical Architecture
Considering the challenges analysed above, we introduce the elastic computing capability of EIMAP, which aims to provide a reliable, scalable infrastructure for elastic management of streams of environmental data produced by a range of heterogeneous mobile sensors. Therefore, a four-layer architecture was designed as shown in Figure 1. This architecture is also well suited to the dynamic, on-demand, pay-per-use nature of the emerging utility computing platforms.
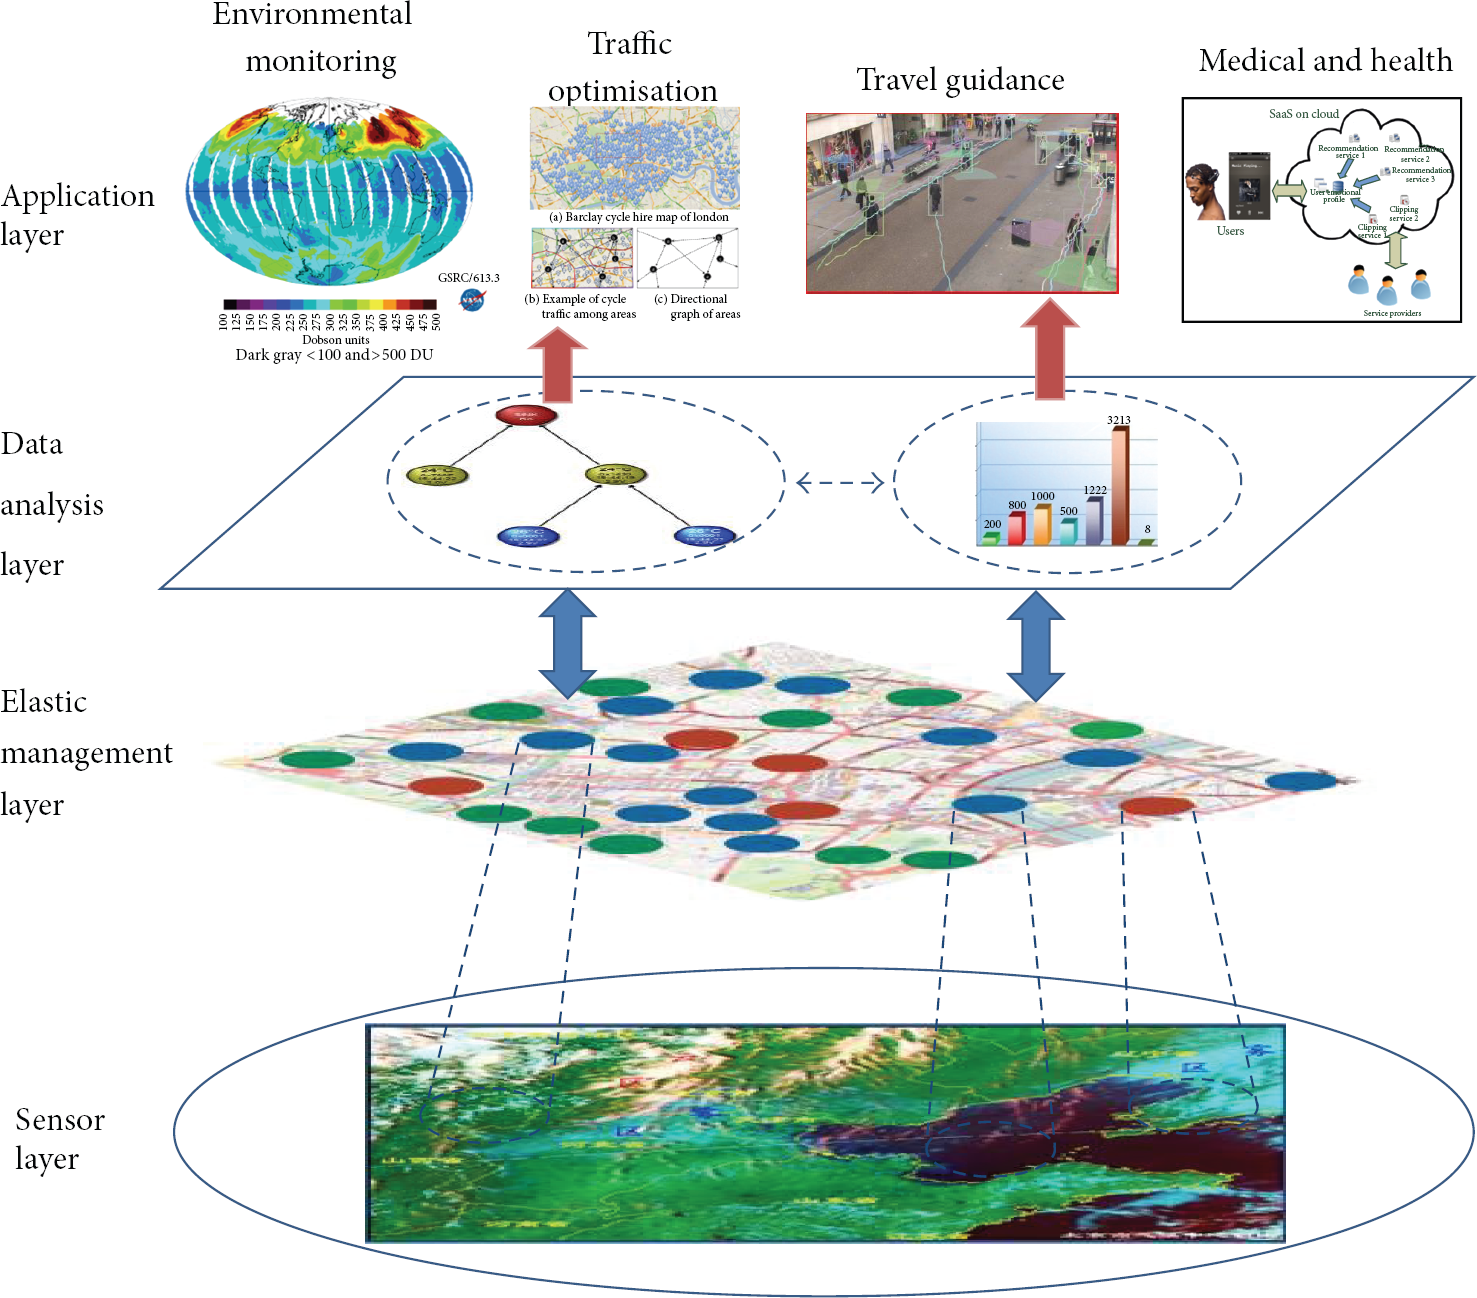
EIMAP hierarchical architecture.
3.2.1. Sensor Layer
This layer manages all the raw hardware level resources in the system, such as the environmental characteristics, different types of sensors, network connection, storage, sensing activities, and distributed raw data. Sensors within the environment are heterogeneous and may be mobile or static. Hence, the wireless connectivity can provide different access protocols to the IP backbone including WiFi (802.11.g), ZigBee (802.15.4), and WiMAX (802.16). The sensors have the capability to sample one or more pollutants or other environmental properties such as noise or temperature. This data will then be transported to the data store in the upper layer (which will be introduced in the following paragraphs). Since potentially the volume of sensory data is significant whereas, the processing resource is limited, the key of the sensing activity is efficiency—salient regions should be paid more attention to and, consequently, consume more processing resource. In this case, an attention-based sensing mechanism [33–36] is preferred, which can extract irregularities and anomalies from massive background noise. To do so, an intelligent control strategy supported by the elastic management from higher layer is necessary.
3.2.2. Elastic Management Layer
This is the core layer of the EIMAP architecture. The purpose of this layer is to provide an elastic resource provision infrastructure for the whole system. It contains resources that have been abstracted/encapsulated so that they can be exposed to the upper layer and the end users as integrated resources, for instance, repositories, resource catalogue services, resource scheduler, and specialized services such as sensor registry/activity management. The resource supply and its supply infrastructure can scale up and down dynamically based on application resource need, which is able to deliver software application environments with a resource usage-based computing model. The resource scheduling service, which is critical for the system performance, is the core service of this layer as well as the whole EIMAP architecture. It enables virtual organization management, resource management, and load balancing in order to guarantee an easy access to sensor data in heterogeneous physical sensors. We will discuss it in next section in detail.
3.2.3. Data Analysis Layer
This layer (whether centralized or distributed) is concerned with information comprehension, including how to summarize the data and how to develop and use models representing the data to control the operation of the sensing activities, such as adjusting sampling rates of specific sensors or making decision of allocating more sensing resources to a particular geographic area to gain further information about it. Centralized and decentralized data mining algorithms are developed in this layer to meet the needs of different data analysis tasks. The analysis results are delivered to the application layer according to different user requirements.
3.2.4. Application Layer
This layer retrieves information from the data analysis layer and uses this information as the input to different applications, not only for the air pollution monitoring. Because the lower layers are designed to be application-independent, the framework is universal for different applications, such as traffic optimisation, security surveillance, mental training, and city planning. Besides, a user-defined service module makes the system extensible so that the users can take advantage of new services that become available.
4. Scheduler for Elastic Sensing
Resource allocation is a key issue in EIMAP which affects not only the sensing activities regarding specific events but also the performance of the whole system including speed and accuracy of response, fairness of queries, and experience for users. Suppose such an application scenario: using sensors to track moving objects such as the pollution cloud (due to dispersion, the pollution cloud always moves and changes its shapes/size). A fixed resource provision strategy is not preferred especially in a resource-restricted environment. Hence, elastic resource provision is a better choice to improve the system performance. In a sensor network, the available underlying resources are sensors, including the sensing behaviours, distributed computational capabilities, and communication links (connectivity, bandwidth, radio power, etc.) that sensors or sensor peers can provide. In consideration of the resource constraints in sensor networks, a resource awareness mechanism is essential to provide a strategy of allocating or scheduling finite sensing resources in exploring potential regions of interest and to take into consideration the dynamic changes that occur in the sensed environment.
A scheduler in the elastic management layer is designed for such an elastic sensing requirement, which aims to model a constraint satisfaction problem of selecting a particular resource allocation strategy for maximizing the value of information collected at any time step, or, minimizing the use of resources in a sensor network for collecting monitoring information at a defined quality threshold.
In order to model this constrained optimisation problem, we feature the surveillance area as follows.
The entire geographical area is divided into grid units and each grid has a predefined size to cover a reasonable region of the area according to the specific requirements of air monitoring. There is a sensor in the centre of each grid which collects and maintains a series of sensor readings for historical or real-time query.
And according to the physical property of the resource provider, the resource constraints can be classified into two categories:
hardware resource constraints, including
size of monitored area/number of grids, storage capability, surplus energy, communication distance, available bandwidth; software resource constrains, including
measuring accuracy requirement, pollutant diffusion model, sensory data attributes.
Suppose now we have identified the feature of interest in an area as an m -dimensional vector
Scheduling algorithm description.

4.1. Generate a Candidate Set of Nodes
The following GC algorithm shown in Algorithm 1 is used to find the candidate nodes for resource provision where the feature of interest A is likely to be detected. The algorithm returns a list of candidates by matching every reading in every node with a given feature.
(1) Given A; NS = NUM_SAMPLES; (2) for ( (3) for ( (4) (5) if ( (6) (7) } (8) return C;
The algorithm starts with a given number of iterations and a null set of candidate nodes C (line 1). For a given number of sampling times, the Euclidean distance between the mean value of the readings in each node and the given feature is calculated (lines 3 to 5) (the Euclidean distance between two readings P and Q can be calculated as Euclidean
4.2. Define the Objective Function
In order to describe whether a candidate node is chosen to be a resource provider or not, we define a decision variable 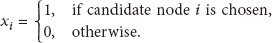
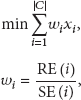
The scheduler tries to find an optimal set of nodes from the candidate nodes given the resource constraints. In a sensor system, a vital resource constraint is the node energy. An energy-aware system will have better performance in system life time [37–39]. Hence, in our system, we select the surplus energy as the optimisation objective and the aim of the optimisation is to minimize the rate of the energy consumption, which can be formulated as
4.3. Identify Constraints
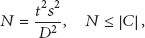
In air pollution monitoring, considering the pollutant diffusion model, we cannot let a sensor monitor an arbitrary size of area in order to guarantee the measurement accuracy. Furthermore, a single sensor is less possible to provide enough storage and computation capacity for the whole task. Therefore, the scheduler has to find a set of nodes with reasonable number of nodes for resource provision. To simplify the analysis, suppose all sensors have the same storage space to cache data; all the links have the same bandwidth; the communication distance is adequate for data transmitting from one grid to a neighbour grid. And we suppose that all the pollution data analysed in this paper are generated and diffused under the same model. Hence, the hardware/software resource constraints that need to be taken into account are reduced to the number of grids, surplus energy, measuring accuracy, and data attributes. According to the guidance of environmental data collection [40], the minimum number of nodes N in a sampling unit has to satisfy

Therefore, the constraint optimisation can be formulated as a 0-1 integer linear programming (ILP) problem as shown in the following.
0-1 ILP for Resource Allocation
OPT1:


In OPT1, the number of grids constraint is explicitly represented by inequality (7), the surplus energy constraint is formulized by
Finding the optimal solution for ILP is NP-hard and may be solved in linear time as an LP-type problem with a constant number of variables [41, 42]. Approaches, such as enumeration, cutting plane, and branch and bound, are unacceptable for real-time scheduling in the scenario of air pollution monitoring because the time complexity of them exponentially increases with the number of variables. Hence, approximate solutions are compromised for such problems.
4.4. Find Out the Solution of Scheduling
Here we give a proximate algorithm for scheduling (PAS) to find the resource provider set P. In this algorithm, a parameter
Algorithm 2 shows the pseudocode of the parallel procedure of PAS in each candidate. In the procedure, δ is a threshold where
Input RE, Output A resource provider set P (1) (2) for each i: (2.1) (2.2) calculate (2.3) if ( } /* end for */ (3) for each i: (3.1) (3.2) if } /* end for */ (4) for each i: (4.1) if ( (4.2) (5)
5. Performance Analysis
5.1. Scheduling Algorithm Performance Analysis
5.1.1. Complexity Analysis
The time complexity of FC algorithm is
For the message complexity, suppose the maximum degree of the sensor network topology is Δ. The algorithm only requires the message exchange in PAS step 4. Hence, the message complexity is
5.1.2. Size of Provider Set
In this experiment, we calculate the average size of the provider set P and the calculation time of PAS. We compare both of the values with the results calculated by ILP.
We use a topology generator to generate random topologies in an area with radius = 100. In consideration of the purpose of this experiment, we simply assume that all the nodes are candidates and the maximum distance L is given different values instead of calculated by formula (4) (the selection of candidates and the calculation of L will not affect the results in this experiment). For different topology parameter values, the random graph is generated and simulated until a predefined confidence interval for the population mean is reached and, then, simulation results are measured by simply taking the average of all cases. Here, we achieve a precision of 1% with the 90% confidence interval of the provider set. In the experiment,

Size of provider set with different distance limitation.
In the figure, we can see that the size of provider set P generated by PAS approximately increases linearly with the total number of nodes. Larger L corresponds to smaller P because a single node can cover a larger geographical area. The size of P generated by PAS is about 1 to 2 times of that generated by ILP. As OPT1 matches the classic minimum independent set problem, according to [30], the size of any independent set in a unit-disk graph is at most 4opt + 1 our algorithm gives a reasonable result.
5.1.3. Running Time
This experiment compares the calculation times of PAS and ILP with
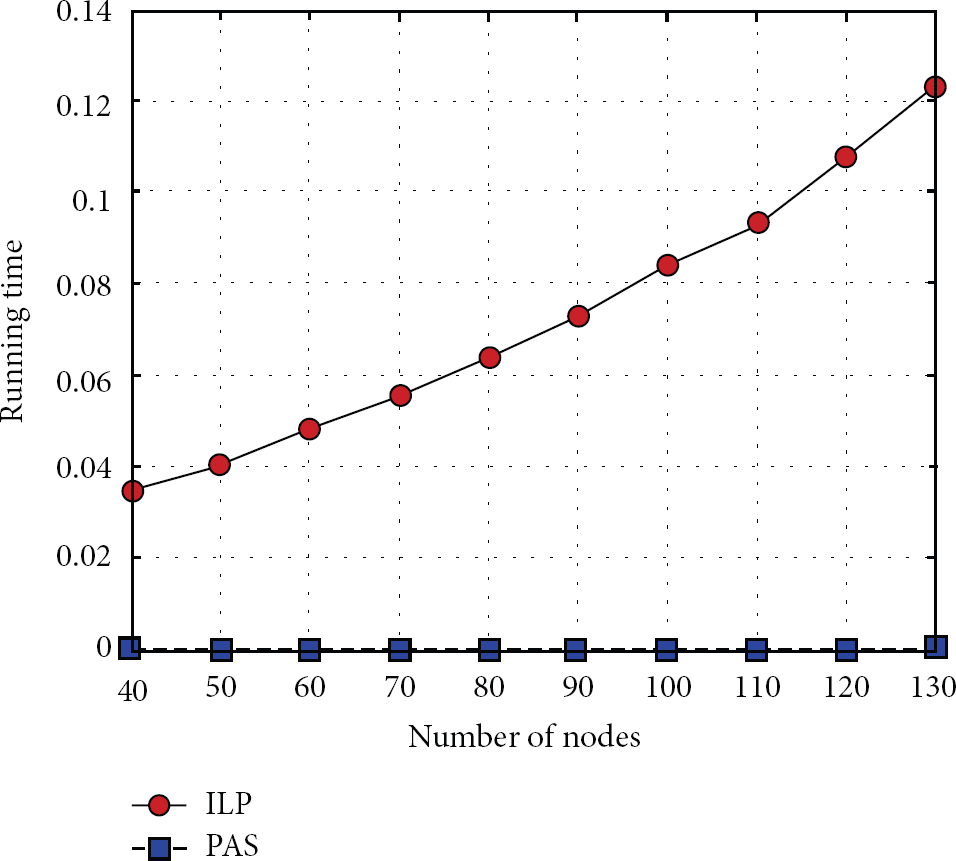
Comparison of running time
5.1.4. Average Surplus Energy
This experiment calculates the average surplus energy (SE) of each node in provider set. PAS algorithm is an optimisation solution aiming to minimize the ratio of the energy consumption, in other word, maximize the surplus energy of the provider set with a given required energy for a task. Therefore, we expect that the provider set generated by PAS has higher average SE in comparison with that of the whole network.
The result is shown in Figure 4. For the whole network, as the SE of each node is randomly assigned from 0 to 100, the average SE is about 50. For the providers, the curve in the figure presents two features. First, the average SE is much larger than 50 as we expected. Second, SE approximately linearly increases with the number of nodes. To explain this, let us check the providers generated by PAS. In PAS, a node has two chances to become a provider: in step
Comparison of number of providers generated by PAS Steps 3.2 and 4.2.


Comparison of surplus energy.
5.2. EIMAP System Performance Measurement
In this experiment, we use WikiSensing [43] and Siege benchmarking utility [44] to simulate our EIMAP system. WikiSensing is an online collaborative platform for sensor data management. It can simulate as many sensors as the system being tested requires, including sensor registration, data sampling, user query response and database management. We use WikiSensing to simulate the lower 2 layers of EIMAP: the sensor layer is simulated by generating 140 nodes records with specified location IDs. Each sensor has a sequence of readings stored in the database. The database is maintained on the IC cloud computing infrastructure [45]. Each node has the capability of receiving quires and sending response. The elastic management layer is realized by integrating our scheduling algorithm into the optimization module of WikiSensing. As the data analysis functions are not essential for this experiment, we can treat the data analysis layer as a layer that executes nothing but transmits the user queries from the interface between 3rd/4th layer to the interface between 2nd/3rd layer directly. And the application layer is simulated by the Siege benchmarking. It can simulate the users' behavior of accessing a web server with a configurable number of concurrent simulated users. The duration of the “siege” is measured in transactions, the sum of simulated users, and the number of times each simulated user repeats the process of accessing the server. With Siege benchmarking, it is possible for us to measure the performance of EIMAP to see how it will stand up to load on the internet. The simulation environment is illustrated as shown in Figure 5.

EIMAP system performance testing environment.
The experiment uses Siege to simulate concurrent users from 100 to 1000. The elapsed time of each test is 60 seconds. In WikiSensing we simulated 30 sensors and different aggregation ratio 
The data stored in IC Cloud is air pollution data which will be described in detail in the next section. The performance evaluation calculates the average response time of the queries, which is the round trip time of sending a request and receiving a response. The results are shown in Figure 6.
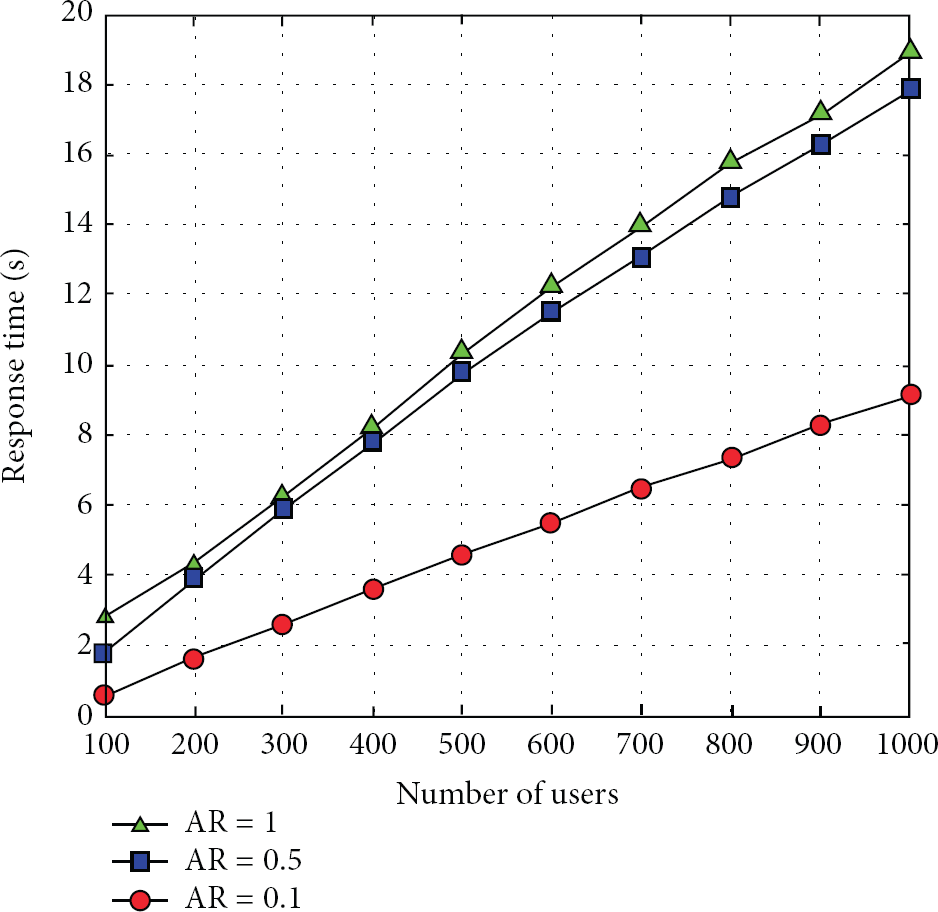
Average response time of EIMAP.
In Figure 6, the response time presents linear increase as the number of concurrent users increases.
6. Air Pollution Scenario
In this section, we introduce a case study for our algorithm by applying it to the air pollution scenario. The experiment, based on our former research [5], uses the air pollution data collected from 140 sensors (in a 100-metre rectangular grid) distributed in a 1 km × 1.4 km area represented as red dots in the map of Figure 7(a). The map shows an urban area around the Tower Hamlets and Bromley areas in East London. There are some of the typical urban landmarks such as the main road extending from A6 to L10, the hospitals around C5 and K4, the schools in B7, C8, D6, F10, G2, H8, K8, and L3, the train stations at D7 and L5, and Gas Works between D2 and E1. 140 sensors collect data from 8:00 to 17:59 at a 1-minute interval to monitor the pollution volumes of NO, NO2, SO2, and Ozone. Then there are 600 data items for each node and totally 84000 data items for the whole network. Each data item is identified by a time stamp, a location, and a four-pollutant volume reading. The time-plot profiles of four pollutants over 10 hours are shown in Figure 7(b). Each profile is the overlap time plots of all the 140 sensors for one pollutant over 10 hours. For example, the upright figure shows the volume of NO from 08:00 to 17:59. At 8:30, 140 sensors generate three typical readings: over 200 ppm, between 60 ppm and 80 ppm, and less than 20 ppm. However, this figure cannot tell us which sensor generates what readings.

Sensor distribution and data profiles in an area of East London.
The case study will investigate the resource provision for tracking a given feature of interest. For this purpose, we specify the feature with high volume of NO + NO2 + SO2, which is defined as a vector A= (170, 180, 150). And we pick up 3 time stamps 08:30, 15:30 and 17:30 for data analysis (according to Figure 7(b), around these 3 time stamps there exist fairly high level pollution volumes of NO, NO2, and SO2 in some of the locations that are distinct compared to other locations). As feature A is the saliency of the pollutants concentration which stands out against their neighbours/surroundings, according to air pollution dispersion characteristics (the concentration of traffic emissions on highway decayed 50% at 150 m location and further 30% at 400 m location [46]), we define 
Table 3 summarises the results of executing the scheduling algorithm in this area. The values of L are different because the values of N are different according to formula (4). Figure 6 visualises the results of the feature tracking. Figure 8(a)(A)–(C) highlight the areas of interest monitored by all the candidates at different time stamps. For example, in the morning the feature is located at the main road and schools (A8, B7, H8, and K8). At 15:30, the feature is only found at two schools and at 17:30 the feature only covers the main road. This characteristic matches the traffic property during a weekday (people going to school and work in the morning rush hours by vehicles makes both the main road and school areas have high pollution, while people off school at about 15:30 and off work at about 17:30, respectively, make the pollution distribution different). These three figures show the resource provision without scheduling scheme, where all the nodes that match the feature are active. Figure 8(b)(A)–(C) illustrate the resource providers chosen by our scheduling algorithm. Each provider is represented by a black node and the yellow circle is the corresponding sensor coverage area with radius L. From the figures we can see that the areas of interest are all picked up and monitored by fewer sensors. Hence with our scheduling algorithm, the resource is elastically provided, whereas the feature tracking still performs well.
Air pollution monitoring scheduling results.

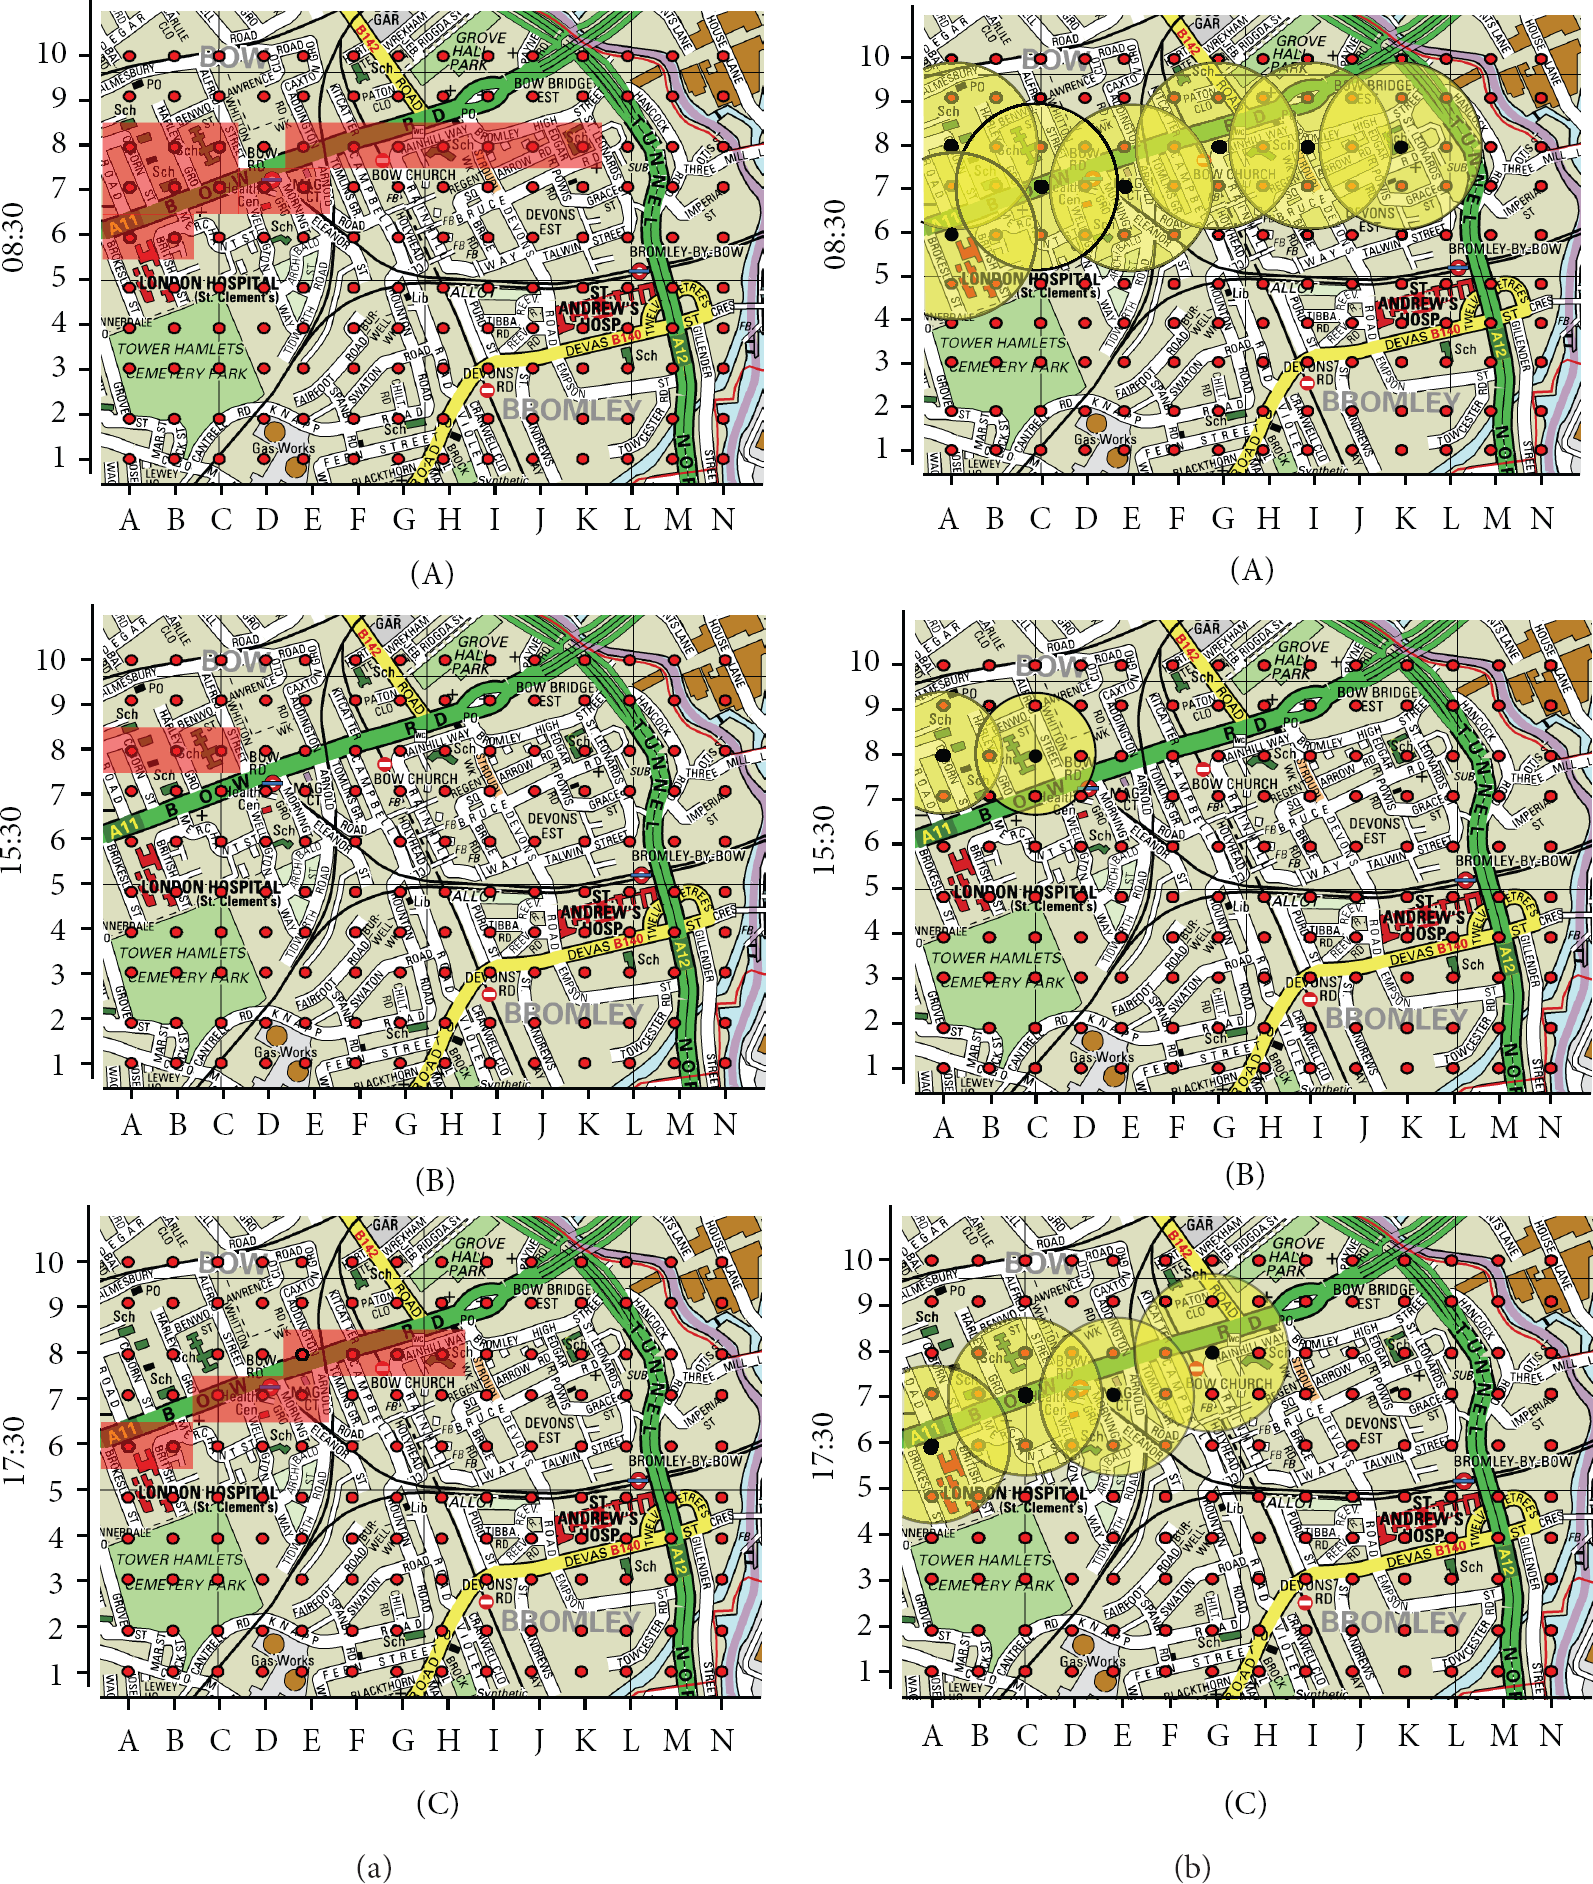
Visualisation of feature tracking.
7. Conclusion
In this paper, we discussed the main challenges in information management and real-time resource allocation when applying large-scale M2M sensor networks to air pollution monitoring. An elastic information management architecture was proposed to address those challenges by using pervasive roadside and vehicle/person-mounted sensors by combining and extending state-of-the-art elastic computing and data management techniques. The experiments results on the elastic resource allocation scheme, the entire system performance, and the air pollution monitoring case study show that our design provides higher performance in energy efficiency and system response speed, as well as an effective saliency detection and coverage in the scenario of pollutant distribution with less sensors.
Direct further work on the algorithm improvement includes continued research on other resource constraints not taken into account in this paper, such as the storage capability and available bandwidth. Our long-term work will focus on the development of the management platform to allow demonstration and further analysis of other applications. The integration with sensor hardware is also a key step which can provide the collection of the application data from the real world to support the real-time data analysis.
Footnotes
Acknowledgments
This work was jointly supported by National Science Foundation of China, Grant no. 61104215, and Engineering and Physical Science Research Council (EPSRC), Grant no. EP/H042512/1. This work is also partly supported by project “Digital City Exchange,” Grant no. EP/I038837/1, funded by Research Council UK.