
Abstract
Water quality refers to the physical, chemical, and biological characteristics of water, and it is a measure of the condition of water relative to any human need or purpose. A particular problem with measuring the condition of water quality at drinking water reservoirs is the requirement of collecting a large number of samples. To handle this problem, we focus on the practical use of two different portable and low-cost approaches for continuous monitoring of water quality: miniboats loaded with sondes with probes and wireless sensor network- (WSN-) based monitoring system. These approaches bring several advantages over traditional monitoring systems in terms of cost, portability, and applicability. Our simulation studies show that these systems can be used to monitor water quality at drinking water reservoirs such as dams and holding ponds. Field tests to prove the effectiveness of the proposed systems are in progress.
1. Introduction
Water quality is one of the main factors to control health and the state of diseases in people and animals. Both natural processes such as soil erosion and weathering, and anthropogenic inputs such as industrial and municipal wastewater discharge largely determine surface water quality in a region [1]. Lakes and rivers are the main sources of drinking water, fishery, irrigation, and energy production, which considerably depend on water quality. Therefore, water quality of lakes and rivers should be kept at a certain level. Strategies are being developed to deal with the eutrophication of lakes and rivers with excess nutrients and the pollution of surface water with toxic chemicals around the world [2].
Sustainable use of water resources requires surface water assessment monitoring programs in addition to decision making and management tools. The major reference to guide efforts to attain a sustainable aquatic environment in Europe is the Water Framework Directive (WFD) [3]. The WFD consists of guidelines defining the categories of quality and the required components and parameters. Dissolved oxygen (DO), pH, electrical conductivity (EC), temperature, turbidity, and nitrate are the main parameters to determine the water quality as stated by WFD [3], US EPA [4], and Turkish Regulations [5].
A particular problem in the case of surface water quality monitoring is the complexity associated with collecting a large number of samples. Monitoring of water quality can be performed using different approaches such as fixed continuous monitoring systems, sampling with portable devices, and postanalysis. Fixed monitoring systems require high initial start-up cost but they provide real-time data. On the other hand, sampling with portable devices does not provide real-time water quality data. In this paper, we propose two different approaches for autonomous monitoring of water quality. In the first system, the boats receive trajectories set by the operator before a mission and follow the trajectories to visit predefined sampling points as shown in Figure 1. During the mission, the sondes, water quality monitoring instruments, on the boats analyze water quality and log results. In the second system, a group of portable water quality probes mounted on buoys at fixed positions regularly analyze water quality and send the data to the control center as shown in Figure 2.
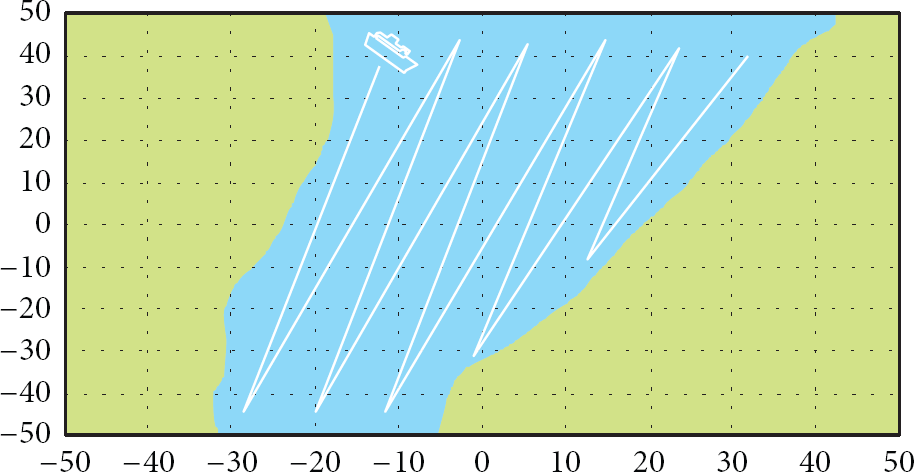
A simple figure to illustrate the first scenario. In the figure, white lines indicate the trajectory followed by the autonomous boat.

A simple figure to illustrate the second scenario. In this figure, red points represent buoys which carry portable water quality monitoring probes.
The proposed systems have three main advantages over fixed monitoring systems as the following.
The proposed systems do not require a high initial cost and maintenance costs. Both systems are portable and can be used at different sites. WSN-based water quality monitoring system provides online data to utility providers. On the other hand, monitoring of water quality by using an autonomous boat provides offline data for on-site analyses. This system can be converted to provide online data by adding a two-channel long range radio modem in order to transmit boat position and heading, and water quality data at the same time.
The remainder of this paper is organized as follows. Section 2 introduces different water quality monitoring systems in the literature. Section 3 introduces the use of autonomous miniboats for continuous monitoring of water quality. Section 4 introduces the details of a WSN-based water quality monitoring system. Performance evaluations of the proposed systems are reported in Section 5. A discussion on the proposed approaches is given in Section 6. Finally, the paper is concluded in Section 7.
2. Related Work
Since water quality monitoring with portable devices provides advantages like a low initial start-up cost and low periodical maintenance costs, they are being used widely. Multiprobe water quality sondes with sensors for EC, temperature, pH, and luminescent DO were used in a research at Nam Co Lake, China [6]. A case study in which water quality sondes were used to measure DO during the water quality analysis of Toenepi Stream, New Zealand is reported [7]. Lapen et al. conducted a survey with water quality sondes to examine nutrient quality and bacteria in tile drainage and shallow ground water [8]. In another study, the details of three automatic monitoring stations which record the responses of lakes and reservoirs to changes in the weather are explained [9].
A detailed review of advancements in water quality sensors, telemetry, and computing technologies in addition to real-time remote monitoring applications is stated in [10]. Water quality monitoring networks are essential to characterize and manage water quality accurately and are important in water basin decision making. An important issue for water quality monitoring networks, the design of sampling locations, is explained in [11]. In addition to remote monitoring, another emerging technique for monitoring applications is the use of autonomous unmanned vehicles. In [12], a prototype autonomous underwater vehicle for rapid environmental assessment is discussed. In [13], an unmanned boat for mapping the water quality of shallow mire pools where aquatic weeds flourish is proposed. Though this study is promising in some aspects, it was conducted during daylight hours since it required an operator to row the boat. During daylight hours, sunlight and temperature change. Hence, pH and DO levels change due to photosynthesis. Therefore, this operation should be conducted using a full autonomous boat at night.
Water quality plays an important role not only for humans but also for animals. Water quality monitoring and forecasting is crucial in modern intensive fish farming management. A wireless system for water quality monitoring in fish culture is explained in [14]. Proper management of animal waste treatment lagoons requires regular sludge surveys of the lagoons. In [15], a study in which sludge measurement was conducted by using a GPS enabled sonar equipped airboat is discussed.
In the recent years, many applications have been proposed for WSNs. One of these is precision agriculture, where WSNs are used in several processes including management of water resources for irrigation, understanding the changes in the crops, estimating fertilizer requirements, and predicting crop performance [16]. In [17], the development of a WSN for the inline monitoring of the content of nitrates in a real scenario, River Turia, Spain, is presented. In this real-world application, ion selective electrode transducers and solar panels for energy harvesting were used. In [18], a WSN-based distributed system for chemical analysis of water was proposed. In this study, nitrate, ammonium, and chloride were analyzed at 14 different locations.
In distributed water quality monitoring applications, in addition to communication infrastructures, the development of sensors plays an important role. In [19], in addition to the hardware designs of pH, redox and turbidity sensors, the software design of the proposed approach, the hardware design of a solar panel, and the hardware design of a wireless sensor node are explained. A detailed review of solid state sensors for online monitoring of water quality parameters including pH, DO, EC, turbidity, dissolved metal ions, and dissolved organic carbon on the high spatial resolution is presented in [20].
Different from the approaches in the literature, fully portable water quality monitoring systems are proposed in this study. Autonomous boat-aided water quality monitoring system works fully autonomously without the guidance of an operator. A single system owned by a utility provider can be used at several water reservoirs. WSN-based water quality monitoring system proposed in this study is a portable system and consists of portable monitoring nodes mounted on buoys. Using anchors, buoys are positioned at fixed locations at a water reservoir and form a WSN-based water quality monitoring system. This system can easily be moved to another reservoir if required.
3. The Use of Miniboats to Collect Water Samples and Real-Time Analysis
In this section, the details of the proposed system are explained. Firstly, the design and sailing algorithm of the autonomous boat are given. Then, the proposed navigation system used by the boat is explained. Finally, sensors used to analyze water quality are described as well as the details of logging and analyzing.
3.1. Design and Sailing Algorithm of the Autonomous Miniboat
For autonomous sailing of the boat, a top-down planning system which consists of three subsystems has been designed as follows.
Sensing subsystem: this subsystem is responsible for sensing the environment in order to build a concrete world model. Position, heading, and speed of the boat are measured by the sensors located on the boat. An Inertial Measurement Unit (IMU) provides information about velocity and acceleration. With the aid of a Global Positioning System (GPS) receiver, the IMU determines the position of the boat. An ultrasonic wind sensor provides information about wind speed and direction. Due to the nature of the implementation areas, the AIS system, a common system in commercial ships to ensure that collisions are avoided, has not been installed. Trajectory planning subsystem: this subsystem is responsible for generating a plan to reach the goal point. Executing subsystem: this subsystem executes required actions of the plan.
The down-down planning system uses an algorithm based on a well-known A* search in
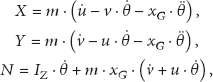
Mathematical model of the boat dynamics and disturbances are necessary to obtain a model for the steering of the boat [22, 23]. The boat in this study is modeled as a rigid body with six degrees of freedom (DOF) corresponding to translations along the three axes and its rotations about these axes as shown in Figure 3. By neglecting the couplings between the motion in the horizontal plane and the roll, pitch, and heave motions, the equations have been simplified. In order to obtain this model two reference frames have been defined as follows.
Inertial reference frame: this frame is fixed to the Earth. The Body reference frame: this frame is fixed to the hull.
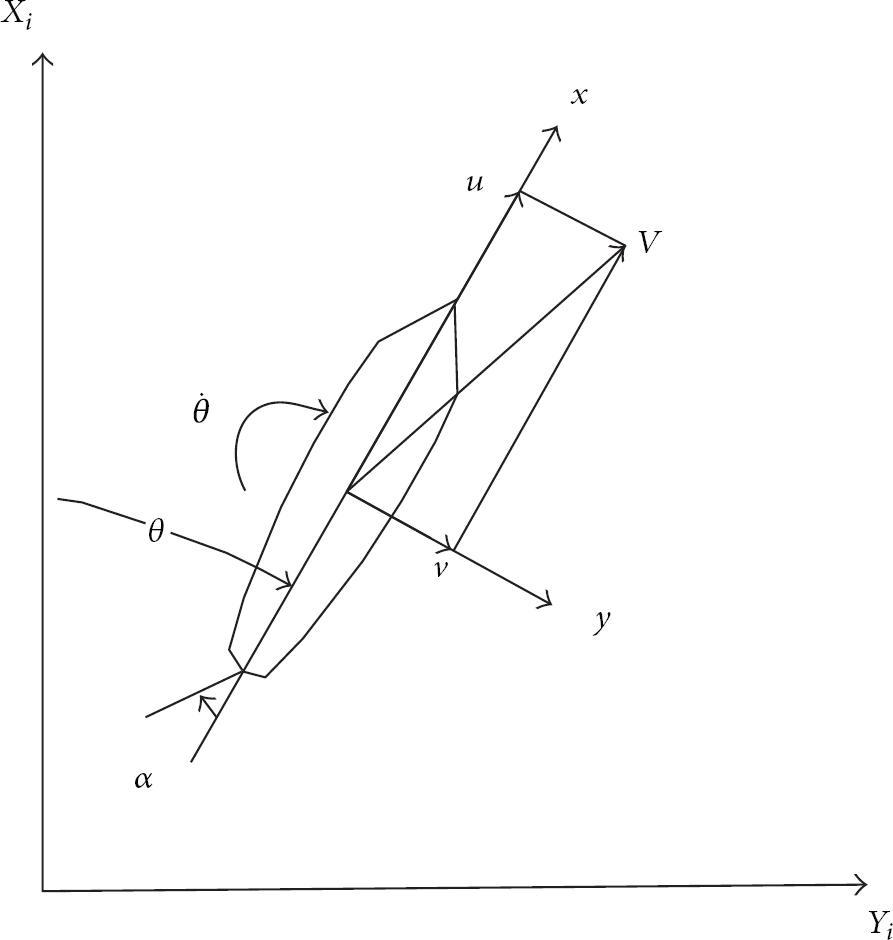
Boat motion description.
The position and heading of the boat can be described as

The projections of the speed V are called the surge velocity u and the sway velocity v. The heading angle and the turning angle are denoted θ and
To quantify the hydrodynamic forces, each part of the boat needs to be analyzed. Though the prototype boat is not a sail, wind effects, the results of the actual flow of air, should be investigated in order to analyze the forces generated by the boat. In addition to the wind effects, rudder forces should be taken into consideration. Due to the difference in the pressure of the water over the lower and upper surfaces of the lifting rudder foil, a lifting action occurs. Also, damping forces, based on the resistance of the keel and hull, exist. The motion models in this study do not consider disturbances. However, boats are influenced by waves, currents, and wind. These disturbances can be modeled by forces and moments. Since possible application areas of the prototype system are all types of drinking reservoirs such as holding ponds and dams, the effects of these forces are neglected to simplify the design of the prototype system and it is left as future work.
3.2. INS-Based GPS-Aided Navigation System
Since the distance of remote control systems is limited and autonomous operation is preferred to teleoperated mode, an INS-based GPS-aided navigation system shown in Figure 4 was designed to enable the boat follow a predetermined trajectory. While the reference trajectory is provided by the integrated IMU, the GPS receiver acts as the updating system. The reason behind this approach is that the frequency of INS measurements is higher than that of GPS measurements. In this study, the geodetic reference for GPS is the World Geodetic System 1984 (WGS84). The Cartesian coordinate frame of reference used in GPS is Earth-Centered Earth-Fixed (ECEF). Three-dimensional coordinates are used by ECEF to describe the location of a GPS user or satellite.

INS-based GPS-aided navigation system—tight integration approach.
There are two common strategies for the integration of INS data and GPS measurements. The loose integration strategy consists of a GPS filter and an INS filter and these filters operate separately. This strategy operates if one of the filters fail and the processing time required for this strategy is less than tight integration strategies [25, 26]. The tight integration strategy consists of a single filter as shown in Figure 4. Since there is a single filter in this strategy, the state vector increases in size, and this results in longer processing time [25]. On the other hand, this strategy has two main advantages over the loose integration strategy. First, information among states is shared statistically in this strategy. Second, the filtering of the GPS measurements is improved [26].
Both integration approaches can be implemented in two different ways: closed loop and open loop. In the closed loop implementation, all the error estimates plus misalignment error are used to correct the mechanization parameters which are used during determining the position and velocity provided by the INS. Therefore, small errors are propagated by the mechanization equations. On the other hand, in the open loop implementation, misalignment errors are sent back to the mechanization equations. Therefore, the errors tend to grow. This type of implementation is only suitable for high end INS.
The INS/GPS filter in Figure 4 is the combination of the INS and GPS filters of the loose integration strategy. Since the INS and GPS filters share the same position and velocity states, the INS/GPS filter is basically the INS filter augmented with the double difference ambiguities. In most systems, due to the difference between the locations of the GPS receiver and the INS, the position and velocity of the INS is different from the one of the GPS receiver. To solve this problem, a vector from the centre of the INS to the GPS antenna is needed. As a result of the time differences of the INS data and GPS measurements, a mechanism to make sure that the position and velocity provided by the INS coincide with the GPS measurements is needed. A common method to handle this problem is linear interpolation. Linear interpolation method is suitable for low dynamic vehicles such as cars, boats, and sails. In case of high dynamic vehicles, Lagrange interpolation is a common method.
The main steps of the tight integration strategy which was adopted from [25, 27] are as follows.
By using the mechanization equations, raw INS measurements are processed in order to determine the position and velocity provided by the INS. By using the position and velocity obtained in Step 1 and raw GPS ephemeris information, pseudoranges and Doppler measurements are predicted. The predicted pseudoranges and Doppler measurements obtained in Step 2 are fed into an INS/GPS Kalman filter. In order to determine the error estimates of the position and velocity in addition to misalignment error, the filter takes the difference between the raw GPS pseudorange and Doppler measurements and the pseudoranges and Doppler measurements from Step 2. Finally, the error estimates obtained in Step 3 are used to update the position and velocity obtained in Step 1 in order to get a full state vector.
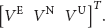
In the proposed system, the INS/GPS error states are defined by the following equation:


The error states are selected as

The velocity vector along ENU is given as


3.3. Probe Used for Water Analyzing and Logging
Different types of probes are used for water analyses. In this study, we prefer a Sonde with the following probes for water quality analyses. The Sonde logs the data for offline evaluations.
CTD. This probe measures conductivity, temperature, and depth. Maximum permissible limit for conductivity is 2.5 mS/cm according to WFD and maximum allowable temperature for inland water resources is 25°C according to Turkish Regulations, which are in the measurement range of the probe on the prototype Sonde. The ranges for the probe are between 0 to 100 mS/cm for conductivity, −5 to +50°C for temperature, and 0 to 200 m for depth. These values are automatically calculated from conductivity according to algorithms found in Standard Methods for the Examination of Water and Wastewater [30]. DO. Maximum permissible limit for DO is 5 mg/L according to WFD and is 8 mg/L according to Turkish Regulations, which are in the measurement range of the sensor planned to be used. The probe on the prototype Sonde uses the methods approved by both ASTM D888-12 Standard Test Methods for DO in Water [31] and the US EPA and can detect DO between 0 and 50 mg/L. The accuracy of the probe is 0 to 20 mg/L ± 2% of reading or 0.2 mg/L. pH. pH of the water according to both WFD and Turkish Regulations should be between 6.5 and 8.5 units. The probe on the prototype Sonde measures pH in units from 0 to 14 with an accuracy of ±0.2 unit. Nitrate. Recommended maximum permissible limit for Nitrate is 50 mg/L according to WFD, 10 mg/L according to US EPA, and 20 mg/L according to Turkish Regulations. The probe on the prototype Sonde measures between 0 and 200 mg/L-N with an accuracy of ±10% of reading. Turbidity. Turbidity has no actual limit according to US EPA and WFD regulations. Turbidity can be measured with the probe on the prototype Sonde between 0 and 1,000 NTU units with an accuracy of ±2% of reading.
All the probes on the prototype Sonde are certified by EPA Environmental Technology Verification Program [32].
4. WSN-Based Water Quality Monitoring
Wireless sensor nodes contain a microcontroller, a storage unit, A/D converters, a radio module, a battery, and one or more sensors for measuring different environmental parameters including temperature, light, acceleration, and angular velocity. Wireless sensor nodes convert data frames to radio messages and send these frames to the gateway. All radio units within a given range establish a wireless sensor network (WSN). In WSNs, nodes automatically establish and maintain connectivity by using mesh-networking protocols. The sensor gateway and its associated middleware connect the WSN with the enterprise computing environment.
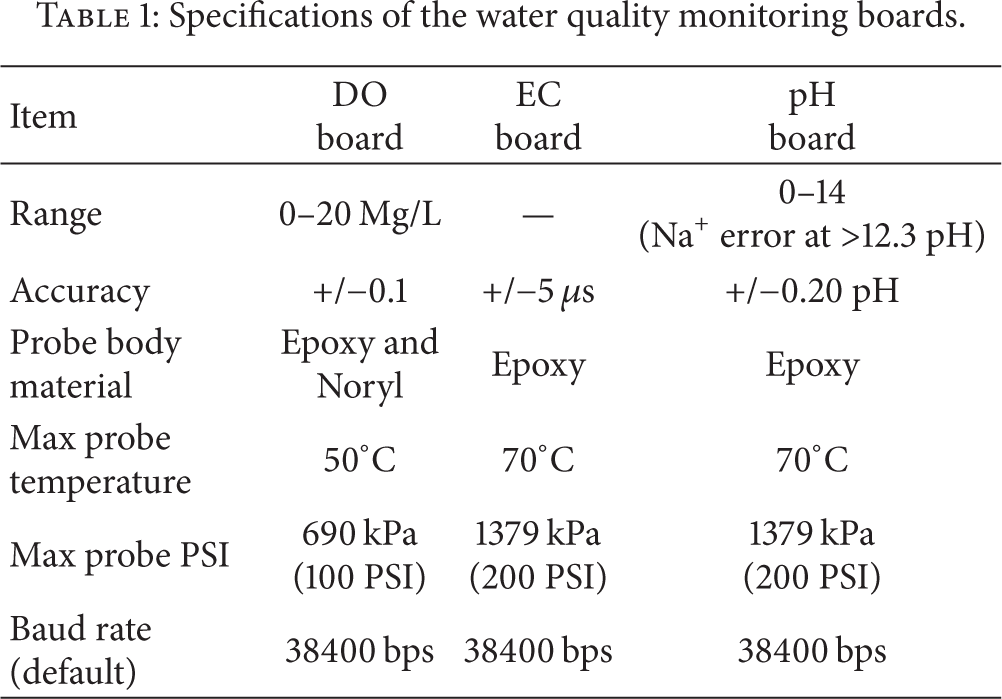
In this study, DO, EC, pH development kits of Atlas Scientific [33] have been preferred and integrated with waspmote sensor node development platforms [34]. Waspmote is an open source wireless sensor platform which offers low power consumption modes to allow the sensor nodes to be autonomous and battery-powered up to five years depending on the duty cycle and the radio used. At the moment, a battery-operated custom designed board with an 802.15.4-based wireless network interface has also being developed for water quality monitoring. Figure 5 illustrates the implementation of a WSN-based water quality monitoring system. In this system, portable water quality monitoring nodes monitor water quality and provide wireless connection. A gateway provides connection between the WSN and a central computer which is located at the control center of a utility provider. The central computer provides WSN data repository and is used for analyses. Table 1 lists the specifications of the water quality monitoring boards.
Specifications of the water quality monitoring boards.
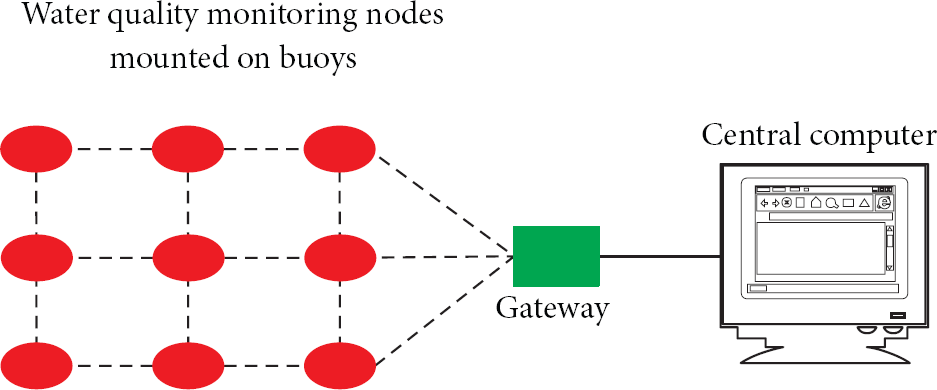
WSN-based water quality monitoring system.
5. Performance Evaluations
In this section, two sets of performance evaluations and our future research directions are reported. First set of performance evaluations was conducted to show the effectiveness of using an autonomous boat for water quality monitoring. Second set of performance evaluations was conducted to evaluate lifetime expectations of portable water quality monitoring nodes. Finally, planned future research directions are reported.
5.1. Simulation Studies on the Use of an Autonomous Boat for Water Quality Monitoring
In order to prove the effectiveness of the proposed INS-GPS integrated navigation system, a simulation environment was developed in MATLAB. INS and GPS data were integrated in after mission mode. It was assumed that the inputs to the simulator were supplied from a GPS receiver and an IMU. In this respect, the GPS receiver provides observation data as binary files and Receiver Independent Exchange Format (RINEX) version 2.10 files, navigation data as binary files and RINEX version 2.10 files, and IMU data as binary files and text files. While observation data consists of the raw code, phase and Doppler measurements, navigation data consists of ephemeris parameters. We imported previously collected RINEX version 2.10 files into MATLAB and edited them accordingly in order to simulate the scenario shown in Figure 1. Figure 6 shows the locations to be visited by the simulated boat for water quality analyses. We conducted twenty sets of simulations in which the boat followed random paths to visit previously defined sampling points, green circles, shown in Figure 6. Positional errors (x, y, and heading) of the boat in each simulation were logged in a CSV file and then the plot shown in Figure 7 was obtained. Figure 7 shows the average of the trajectory errors of the simulated boat from the East and the North. The results prove that the boat follows its predefined trajectory successfully. Considering the results of this simulation study and the accuracy of the Sonde, we can conclude that water quality maps of drinking water resources can be obtained by using the proposed system.
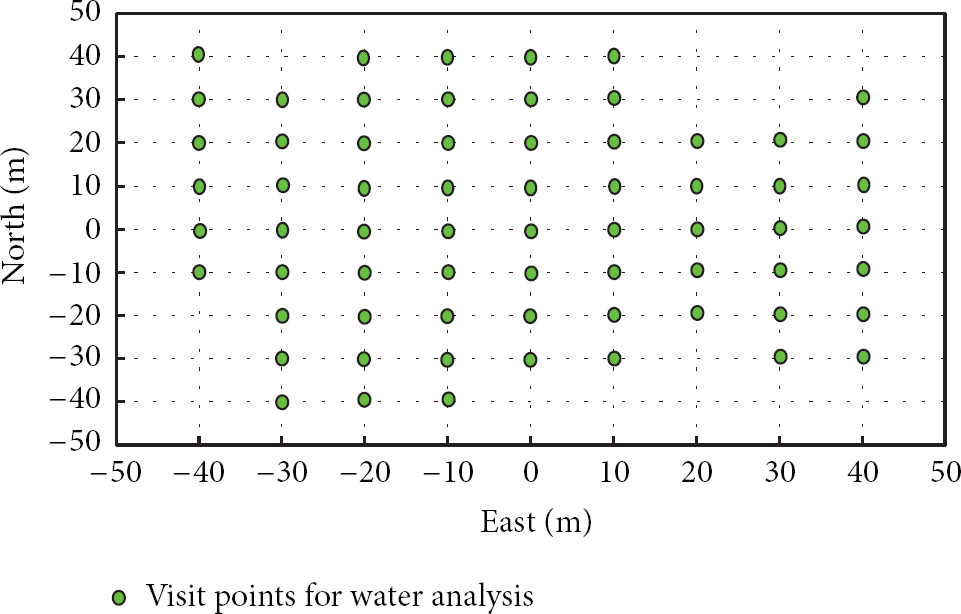
Visit points of the simulated boat for water analyses.

Trajectory errors of the simulated boat from the East and the North (in meters).
In order to show the use of autonomous boats for water quality monitoring applications, a set of Geographic Information System- (GIS-) based simulation studies was conducted by using a previously collected dataset consisting of sampling locations, EC, temperature, and nitrate values. In Table 2, IDs are used to identify sampling locations. This table lists a part of the dataset used in this simulation study. The results of these simulation studies are shown in Figures 8, 9, and 10.
Part of the dataset used in the simulation study.


Water temperature values of the sample dataset.
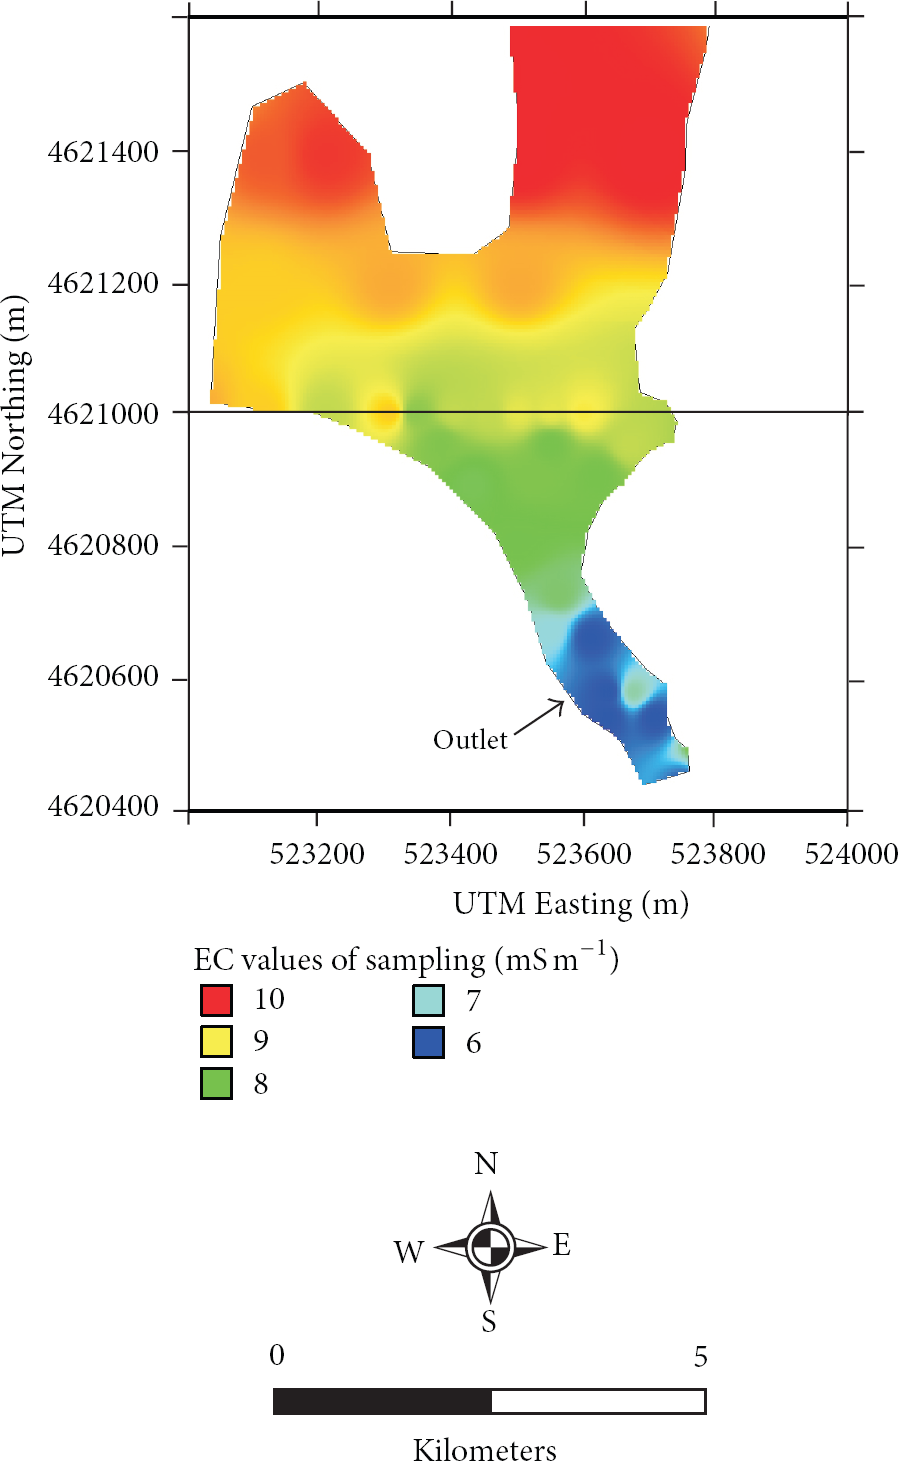
EC values of the sample dataset.
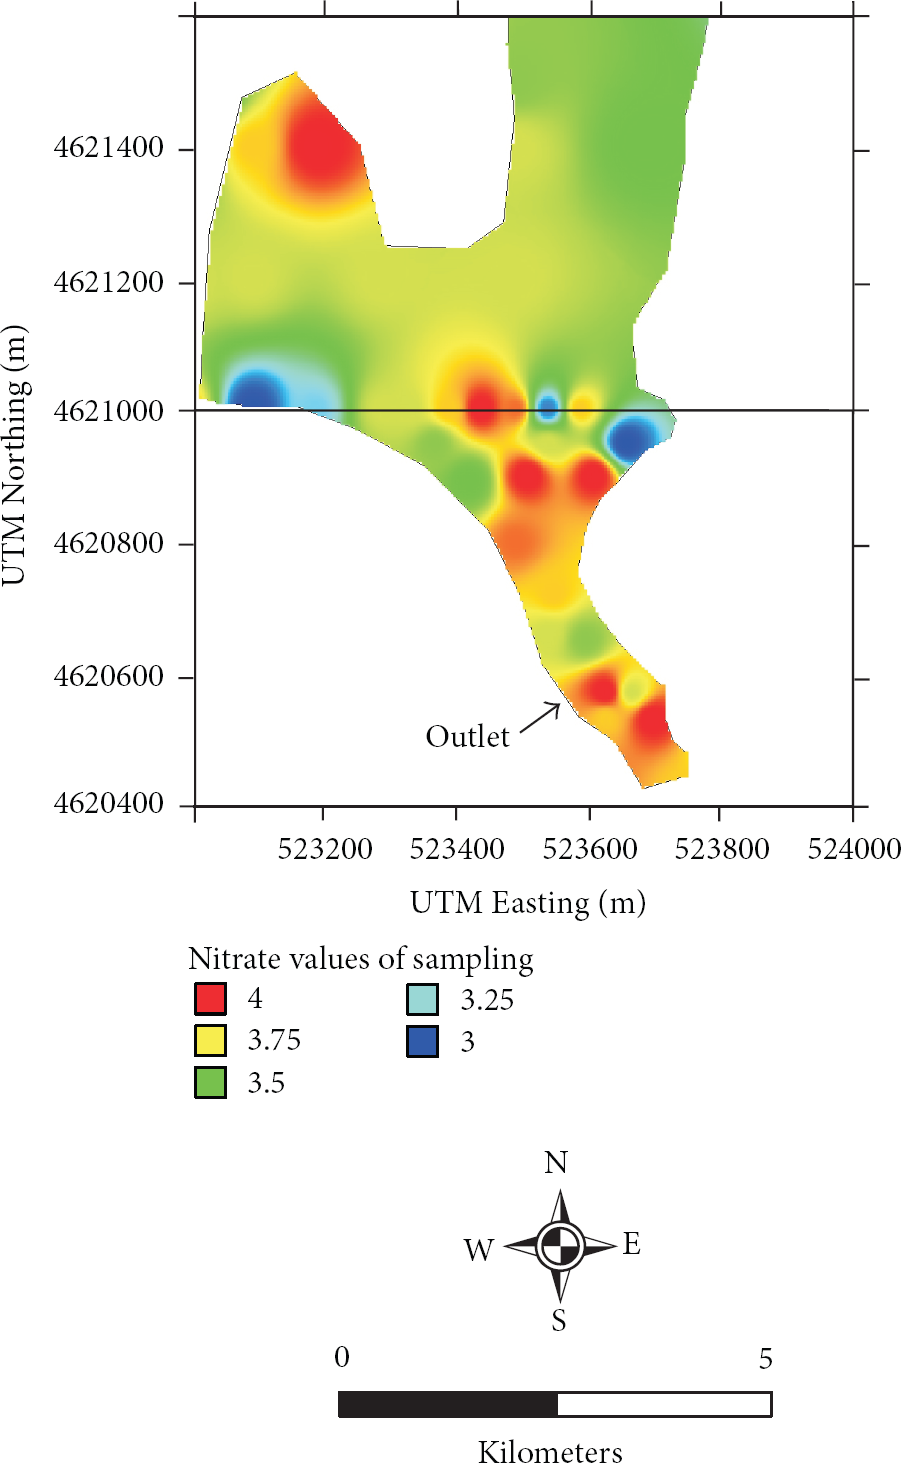
Nitrate values of the sample dataset.
5.2. Simulation Studies on the Lifetime Evaluations of Portable Water Quality Monitoring Nodes
As it is well known, lifetime expectations of a wireless node with internal or external batteries depend on several parameters and facts including battery capacity, transmission power, transmission frequency, duty period, node density, and several node-related parameters. Considering the specific requirements of the proposed approach, measurement rate and transmission power are the main parameters which affect the lifetime of a monitoring operation. To analyze these parameters, we developed a MATLAB-based simulation environment using the source codes of MATSNL [35] and analyzed the effects of measurement rate and transmission power on node lifetime.
In the first case study, we set the specifications of the simulated mote according to the specifications of telosB [36] motes. We set the transmission power of the motes to 0 dBm and −25 dBm and varied the measurement rate from one minute to one day. The resulting plot is shown in Figure 11. As in Figure 11, when sensor measurement rate is increased, node lifetime drops significantly.

The relation between node lifetime and measurement rate.
In the second case study, we again set the specifications of the simulated mote according to the specifications of telosB motes and computed the power breakdown of the average power consumed by a node for transmitting, receiving, sensing, preprocessing, and sleeping. We varied the duty cycle, the ratio between active period, and the full active/dormant period of a sensor node, between 0 and 0.8, and measurement rate ranged from one minute to one day. The node took 40 samples out of the variable ranges and communicated with other nodes after processing the measurements 60% of the times. The resulting plot is shown in Figure 12. As in Figure 12, when transmission power is reduced, less power is used for the transmission mode of a radio. On the other hand, reducing transmission power reduces the transmission range of a radio and affects overall packet reception rate (PRR). Therefore, adaptive transmission power approaches may be utilized to balance this trade-off.

The relation between transmission power and battery consumption.
5.3. Future Research Directions
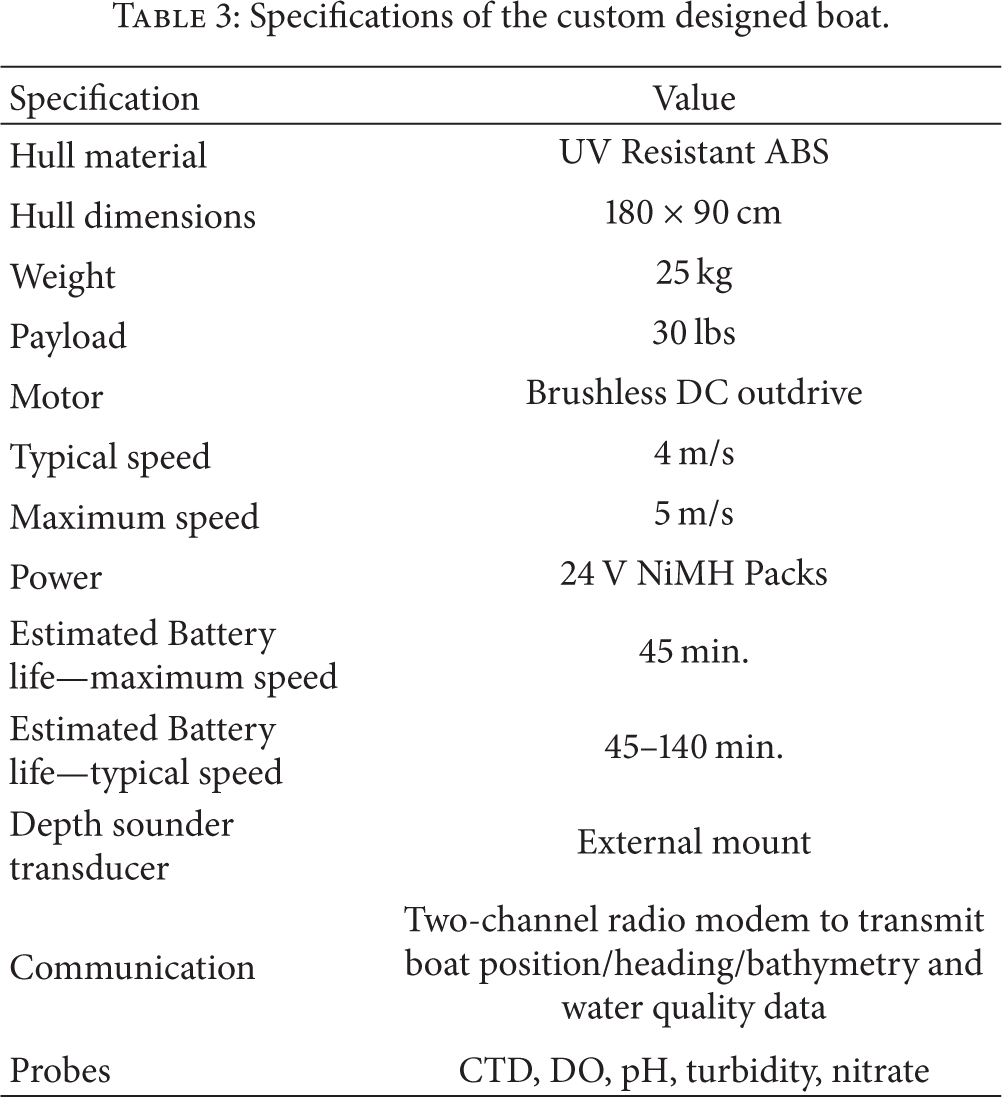
Two sets of field tests are going to be implemented at a drinking water reservoir—Kirklareli Dam, Kirklareli, Turkey. In the first set of field tests, a custom designed prototype boat will be programmed to use spiral paths. Because, although parallel paths are preferred in water quality mapping operations, spiral or other types of paths may be more appropriate to mitigate the temporal variations in the water quality parameters [13]. Table 3 lists the specifications of the boat [37]. We are planning to collect data regarding various water quality parameters including CTD, DO, pH, nitrate, and turbidity during the field tests using the autonomous boat. After processing and interpolating the collected data, pictures showing the levels of the water quality parameters of the Dam are going to be obtained.
Specifications of the custom designed boat.
In the second set of field tests, we are going to implement a WSN consisting of several nodes. These nodes are going to be buoys carrying sondes with multiple probes and have IEEE 802.15.4 wireless interfaces for communication. The buoys are going to be manually positioned at fixed locations at the Dam. They are going to analyze water quality at periodical intervals by using their probes and transmit their measurements to the central PC over the WSN. In this way, continuous online monitoring of water quality is going to be realized.
A future design goal to be implemented on the prototype boat is to integrate solar and wind panels to improve battery life. As proven in several studies such as [38, 39], energy harvesting methods can considerably increase node battery life. In this way, longer lifetime and continuous use of the boat may be achieved by charging batteries when there is more power than needed. This design can be efficient if completed with additional sensors for different types of measurements including temperature, turbidity, and salinity.
Comparing the performance of the tight integration approach with that of the loose integration approach in terms of navigation accuracy, processing overhead, and memory usage is our final future work in this study. This future work aims to prove the applicability of GPS-INS integration approaches in practical implementations.
6. A Discussion on the Proposed Approaches
In this study, two different water quality monitoring systems for different scenarios are proposed. In the first system, an autonomous boat or a group of boats receive trajectories set by utility operators and then follow the trajectories to visit predefined sampling points. During the mission, the sondes on the boat(s) analyze water quality and log results. In the second system, a group of portable water quality probes mounted on buoys regularly analyzes water quality and sends the data to the utility control center through wireless or wired links.
Although the proposed approaches do not complement each other since they are different approaches, they can substitute each other depending on requirements. A comparison of the proposed approaches is listed in Table 4.
WSN-based water quality monitoring versus water quality monitoring using an autonomous boat.

7. Conclusions
This paper presents the design of two portable and low-cost solutions for continuous monitoring of water quality. Firstly, we have explained the design of an autonomous miniboat-aided autonomous water quality monitoring system for drinking water reservoirs. Then, we have investigated the use of portable sondes with IEEE 802.15.4-based wireless interfaces for continuous monitoring of water quality. These systems eliminate the need for periodical time-consuming water analyses and improve the quality of supplied water through continuous monitoring. In addition, they bring cost advantages to utility providers by eliminating periodical laboratory expenses.
The first system we have proposed utilizes an autonomous battery-operated miniboat which is guided by a GPS-aided INS-based navigation algorithm. Hence, the system can be used for water quality monitoring at multiple sites. The results of our first set of simulation studies prove that the proposed system is successful in terms of navigation and water sampling performance. The second system we have proposed utilizes a group of portable sondes with solar panels for energy harvesting and IEEE 802.15.4-based wireless interfaces mounted on buoys. The sondes form a WSN to communicate over and send their measurements at regular intervals to a central PC over the WSN. Similar to other WSN-based applications, the results of our second set of simulation studies show that the applicability of this system depends on several parameters such as transmission frequency, transmission power, packet size, and node-related parameters.