
Abstract
The model to predict particle deposition velocity on rough walls in fully developed turbulent duct flows has been developed in previous studies. For particle deposition model boundary conditions, it is assumed that the concentration of the particle is zero on the surface and the resuspension velocity is constant. However, the resuspension velocity may not be constant with the increase in mass of the deposited dust. To analyze the behavior of resuspension in air flow, a set of experiments were designed and conducted. Results showed that there was a linear relationship between the mass of resuspension and deposited dust. Also, the particle deposition model was improved by adding a resuspension item to the equation, and the steady-state equation was developed into a time-varying equation. The analysis results are presented in this paper.
1. Introduction
For modeling particle deposition, it is widely assumed that air flow is homogeneously and isotropically turbulent. Further, particle concentration is assumed to be uniform except when the thin boundary layers are adjacent to the surfaces. Particles migrate through the boundary layers by turbulent and Brownian diffusion plus (for horizontal surfaces) gravitational settling. Different models for particle deposition have been published in previous research. Lai and Nazaroff [1] derived a three-layer model developed from Fick's law. Lai and Chen [2] derived a model based on the RNG k-∊ model by Chen [3], Posner et al. [4], and eddy interaction model by Graham and James [5]. Chiou et al. [6] derived a time-varying model based on the three-layer model. Zhao and Wu [7] improved the three-layer model by adding a turbophoretic effect to the deposition equation, and analytical solutions were derived.
Resuspension is an important secondary source of particles in the indoor environment. It is associated with convective airflow in ventilation ducts. Previous experimental researches have demonstrated the important parameters which can affect resuspension, including air velocity [8], particle size and composition [9], surface material and roughness [10], and relative humidity and residence time [11]. Particle resuspension may also be strongly dependent on whether the deposit is a monolayer or a multilayer. A monolayer deposit is one in which particles are sparsely deposited on a surface, with negligible particle-to-particle contact. A multilayer deposit is a porous structure of particles deposited on top of one another, forming multiple layers. Only a few modeling and experiment studies have explored multilayer resuspension, and now several unique characteristics associated with resuspension from multilayer deposits are identified, including layers [12], surfaces [13], and particle size [14]. Almost all researches is focus on details. From a “macroscopic view,” taking no account of the layers, surface differences, particle size and so forth, we find that resuspension velocity is connected with the mass of deposited dust in given condition. Deposited dust is from the deposition phenomenon, so resuspension is connected with deposition; two parts should be analyzed in one model.
2. Experiment
An experiment was designed and conducted to analyze the relationship of the resuspension mass with the deposited dust and also with the air velocity. Two different air volumes are studied to explore the impact of air velocity: 3,000 and 5,000 m3/h. In the first experiment (air volume is 3,000 m3/h), fresh air temperature is 16.4°C and relative humidity is 21.5%. Atmospheric pressure is 102.5 kpa. In the second experiment (air volume is 5,000 m3/h), fresh air temperature is 18.3°C and relative humidity is 25.3%. Atmospheric pressure is 102.1 kpa.
2.1. Introduction of the Experiment
The experiment process was designed as shown in Figure 1.

Experiment process.
As shown in Figure 1, the outdoor fresh air was used as the medium in this experiment. With the help of a high efficiency particulate air (HEPA) filter, aerosols in the fresh air were mostly filtered. The clean air then passed through the removable duct to the outdoors, depositing the dust on the several pieces of paper placed on the bottom of the duct. The deposited dust mass can be obtained by weighing the mass difference of the paper between before and after the dust deposits on it.
As shown in Figure 2, for ease of operation, the removable duct was divided into three parts, each 1.2 m in length. Two pieces of paper were placed on the bottom of each part in the duct. Four plastic battens were pressed on the edges of the paper. The cross-section of the duct is 500 mm × 500 mm. Each piece of the paper is 440 mm × 390 mm.

Detailed information on ducts and papers.
2.1.1. Main Experimental Components
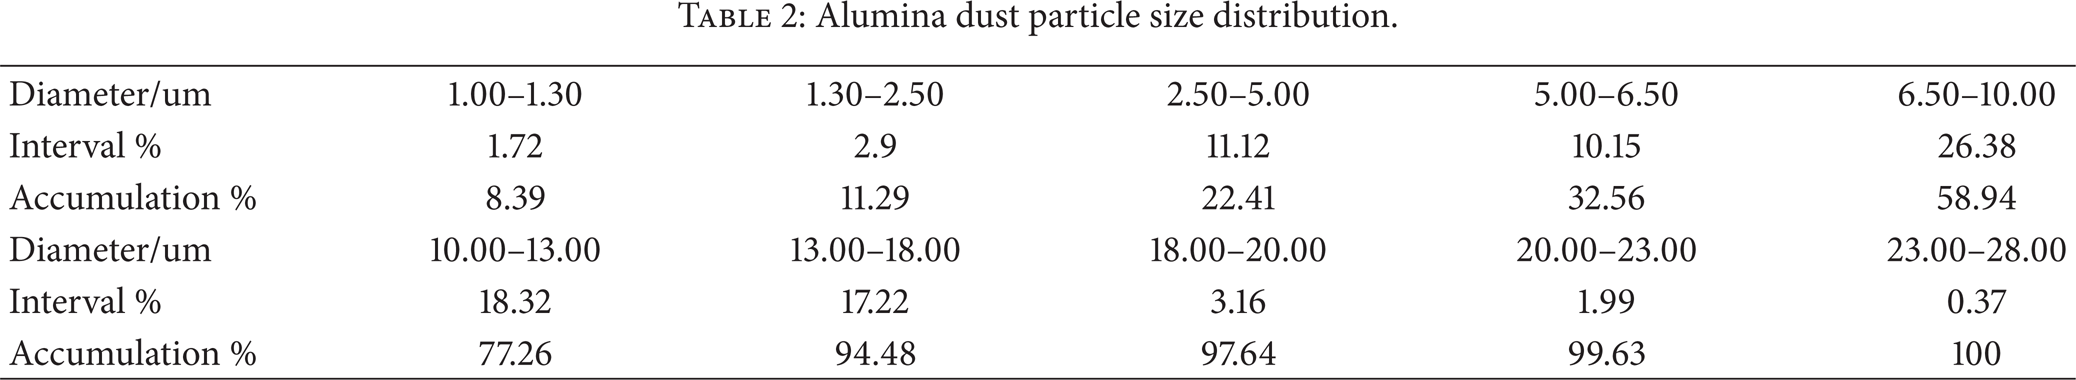
Inverter fan: the volume range of the fan is from 300 to 5,000 m3/h. The cross-section of the duct is 500 mm × 500 mm; thus the air velocity ranges from 0.33 to 5.5 m/s, which is suitable for the experiment. Analytical balance: the analytical balance ranges from 0 to 100 g (220 g), and the accuracy is 0.01 mg (0.1 mg). HEPA filter: V-type pleat filter. Dust: alumina dust. Alumina dust diameter distribution is relatively concentrated. And mean diameter of the alumina dust is near 10 um. The density of alumina is close to the dust we collected. So, it is suitable for the experiment. The detailed information of the alumina dust is presented in Tables 1 and 2. Alumina dust parameters. Alumina dust particle size distribution.

2.1.2. Experiment Processes
Six pieces of paper were prepared and weighed. Alumina dust was weighed and spread on the paper evenly. The loss of alumina dust during spreading was assumed to be less than 10 mg each time. The paper was attached to the bottom of the three parts of the duct, two pieces each. Three parts of duct were connected. The inverter fan would be opened firstly and closed after three hours. During the operation, 6 plastic films were prepared and weighted. Each piece of the film is 1000 mm × 500 mm. After the operation, the paper was taken out of the duct for weighting. To minimize the dust loss when being taken out, the paper was wrapped up by the plastic films we prepared before. The pieces of paper wrapped by the plastic films were then removed from the ducts and weighed.
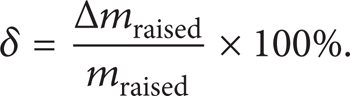
Thus, the mass of resuspension during the three operation hours was calculated by

where mraised is the mass of resuspension during one hour, mdust the mass of the alumina dust spread on the paper, mpaper the mass of the paper, mfilm the mass of the plastic films used to cover the paper after the operation, and mp&f the total mass of the paper covered by the plastic film and the remaining dust.
2.2. Experiment Results
Two groups of experiments were conducted using two different air volumes of 3,000 m3/h and 5,000 m3/h, respectively, with each group having six experiments. Due to limitations, there are just two groups of experiments, more experiments and researches are needed in the future. The results of the experiments are listed in Tables 3 and 4.
Result when air volume was 3,000 m3/h.

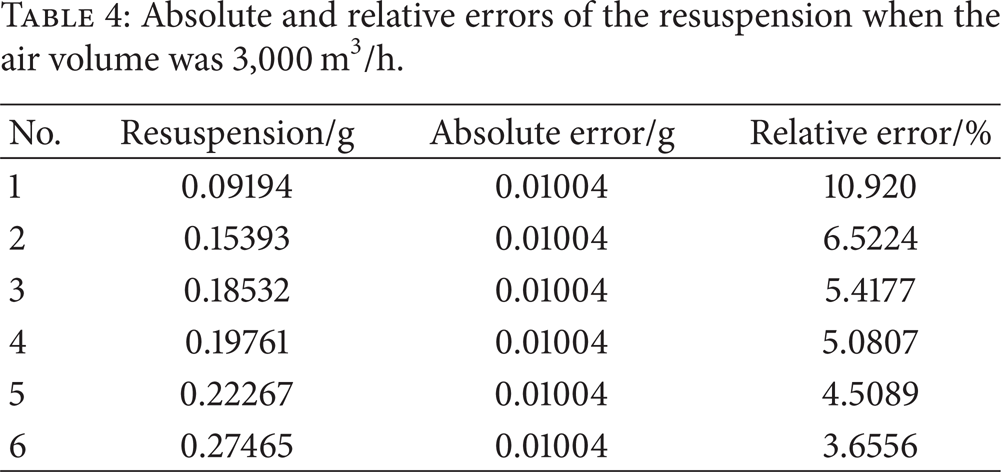
Absolute and relative errors of the resuspension when the air volume was 3,000 m3/h.
(a) Air Volume 3,000 m3/h. See Table 3.
According to (1), the error of the resuspension can be calculated by

In the equation, the errors of measured values are dependent on the accuracy of the analytical balance, so

Assume that the loss of the dust during spreading was less than 10 mg, so

The relative error of the resuspension can be calculated by
The results are listed in Tables 4 and 5.
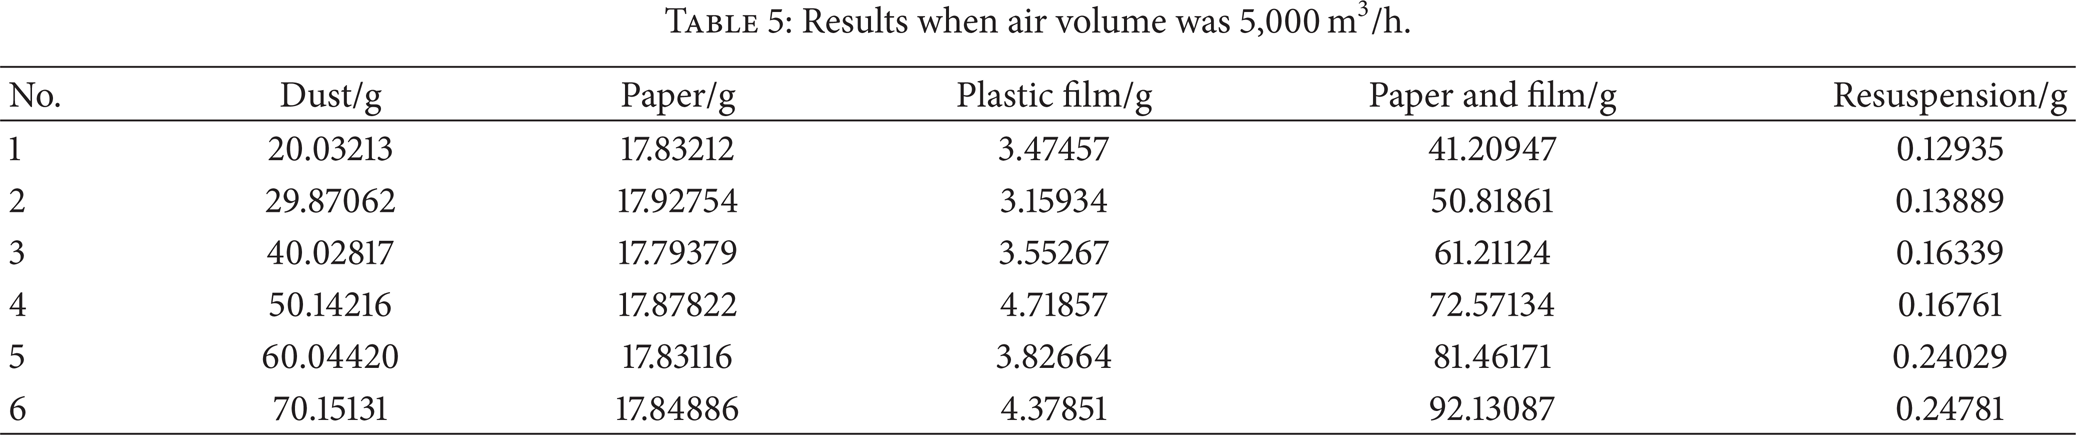
Results when air volume was 5,000 m3/h.
According to Table 4, the maximum relative error of the resuspension was 10.920% in experiment 1, with most of them being around 5%. Therefore, the results were considered acceptable.
(b) Air Volume 5,000 m3/h. See Table 5.
Absolute and relative errors of the resuspension were calculated in Table 5, and the results are listed in Table 6.
Absolute and relative errors of the resuspension when air volume was 5,000 m3/h.

According to Table 6, the maximum relative error of the resuspension was 7.7619% in experiment 1, so the results were considered reliable.
2.3. Data Analysis
Using the original data, the mass of deposited dust per meter squared can be calculated by
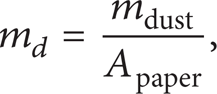
where m d is the mass of deposited dust per meter squared and Apaper is the area of the paper. The ratio of the mass of resuspension per meter squared per hour and the mass of deposited dust per meter squared can be calculated as follows:

where m r is the mass of resuspension per meter squared per hour and t is the time the experiment lasts. Consider
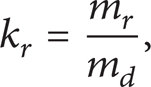
where k r is the ratio of the mass of resuspension per meter squared per hour and the mass of deposited dust per meter squared.
The results of the two groups of experiments are listed in Tables 7 and 8.
Results when air volume was 3,000 m3/h.

Results when air volume was 5,000 m3/h.

To analyze the relationship between the resuspension and deposited dust, two models are discussed here.
Model 1: Linear Model. To obtain the relationship between the mass of the resuspension and the mass of the deposited dust, the linear least-squares method was used to fit the data. When the air volume was 3,000 m3/h, the equation fitted by the linear least-squares method was m r = 1.1 × 10⁻³m d + 0.082 and R2 = 0.9511.
When the air volume was 5,000 m3/h, the equation fitted by the linear least-squares method was m r = 0.9 × 10⁻³m d + 0.128 and R2 = 0.8971.
As shown in Figures 3 and 4, the points demonstrated a strong linear relationship. However, the slope and the intercept could not be obtained easily, and there was no significant relationship between them.

Relationship between the raised and deposited dust when the air volume was 3,000 m3/h.

Relationship between raised and deposited dust when the air volume was 5,000 m3/h.
Model 2: Proportion Model. According to Figure 5 most of the points were scattered between 0.0010 and 0.0016 and near the line k r = 0.0014 h−1 at the same time. We assumed, therefore, that ratio k r was constant when air volume fluctuated. However, only two air volumes were used in these experiments, so further research is required.

Relationship between k r and m d with different air volumes.
With the above data, the ratio k r value was estimated to be the mean value of the points. Points far from the average line were removed from the data set. A k r value of 0.00138 h−1 (3.83 × 10⁻⁷ s−1) was obtained with this method. And the result is near to Mortazavi's [15] research as showed in Figure 6.

Resuspension rate in different air speeds [15].
3. Deposition Model
3.1. Three-Layer Model
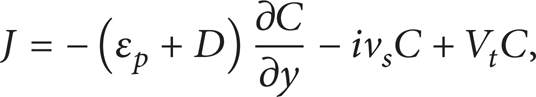
Lai and Nazaroff [1] considered three different particle transport mechanisms, that is, Brownian diffusion, turbulent diffusion, and gravitational settling. The three-layer particle deposition model was put forward and can be described by a modified form of Fick's law; that is,

where J is the particle flux, ∊ p is the particle eddy diffusivity in the boundary layer, D is the Brownian diffusivity of the particle, C is the particle concentration, y is the normal distance to the surface, v s is the settling velocity, and i characterizes the orientation of the surface. If the surface on which the particles are deposited is an upward facing horizontal surface (floor), then i equals 1, if it is a downward facing horizontal surface (ceiling), then i equals −1, and if it is a vertical surface, then i equals 0.
3.2. Improved Model
Based on the three-layer particle deposition model of Lai and Nazaroff [1], Zhao and Wu [7] modified the particle flux as follows:
where V t is the turbophoretic velocity.
Equation (10) can be rewritten as a dimensionless equation
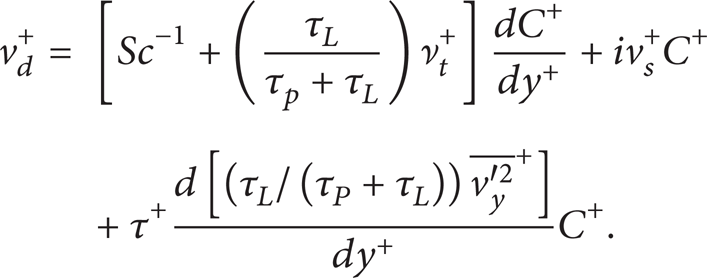
Boundary conditions are

Consider the following equations:
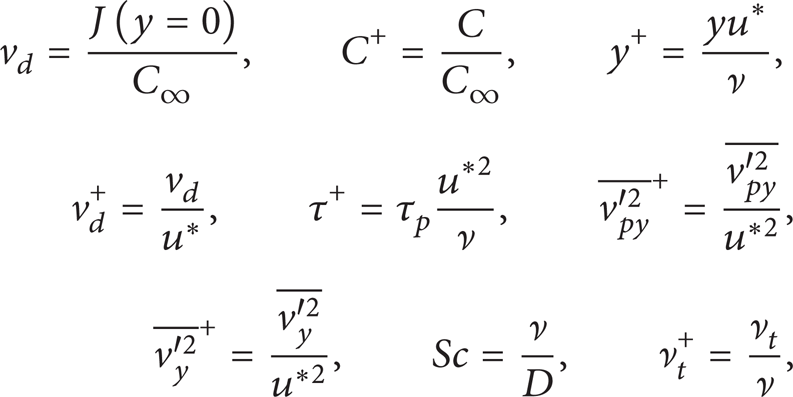
where C∞ is the particle concentration outside the concentration boundary layer, u* is the friction velocity, ν is the molecular kinematic viscosity of air, τ
p
is the particle relaxation time,
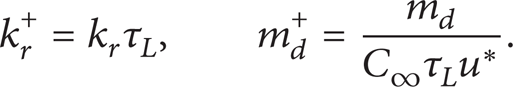
3.3. Model Improvement
From the experiment, resuspension parameter k r is a constant for given deposition condition. Thus, resuspension velocity is linked to the mass of deposed duct. While the deposed duct can be described by deposition model and resuspension, so they must be considered in one equation.
The model was improved by Zhao and Wu [7] as follows:

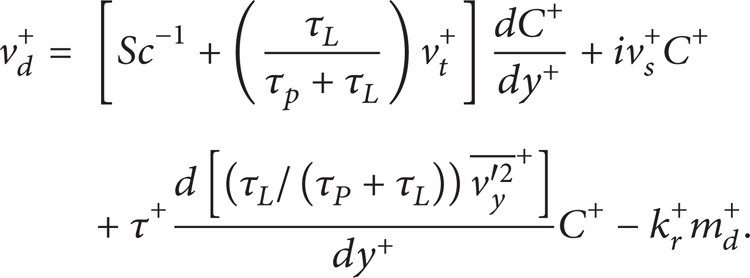
Adding the resuspension item into the equation, we get

Nondimensionalizing (15) as above we get
Equation (15) can be then rewritten as a dimensionless equation
For the deposited dust, we have the equation

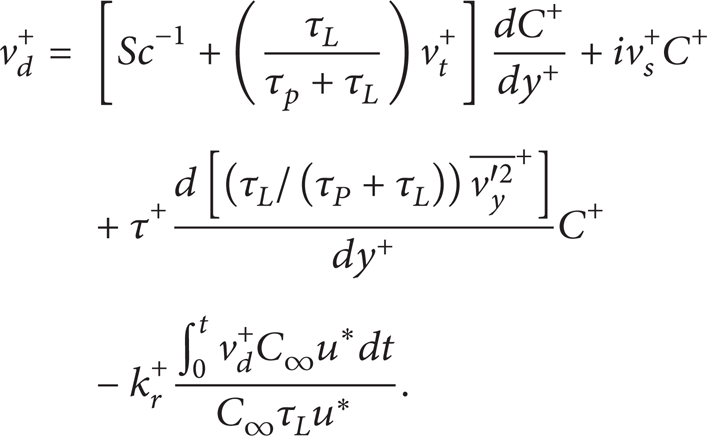
Move the last item to the left of the equal sign

And then, using Kreyszig and Zhao and Wu's solution [7], we get
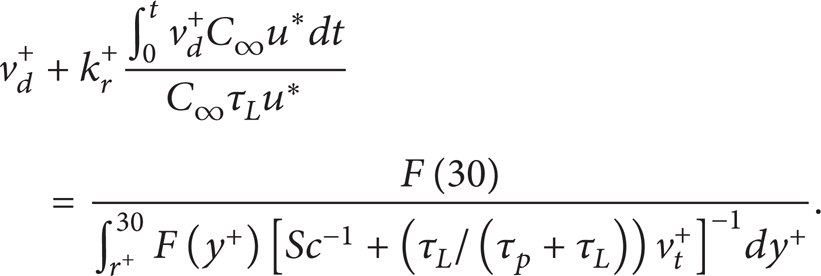
Assuming that the concentration of the aerosol is constant, the right side of the equation is also a constant number. Consider

The air velocity and the concentration of the aerosol are constants, so C∞, u*, k d +, and τ L are constant in time. So we have

By deriving the above equation,

The solution is
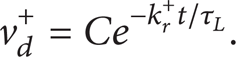
When t equals 0,
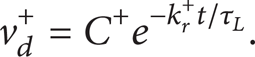
Then,

According to the above equation, the dimensionless deposition velocity is an exponential curve, which decreases continuously to zero with time. When v d + is zero, the mass of deposited dust will not increase. So the mass of the deposited dust was limited and can be calculated by


4. Conclusions
In this paper, a set of experiments were designed and conducted. The phenomenon of resuspension was observed during the experiments, and data was analyzed and discussed. The relationship between the deposited dust and resuspension was shown to be linear. However, the slope and the intercept were not obtained easily, and there was no significant relationship between them. Thus, the proportion model was put forward. According to the data, we assumed that the ratio k r was constant when air volume changed. Due to limitations, there are just two groups of experiments; more experiments and researches are needed in the future.
The particle deposition model was improved to a time-varying equation by adding a dust raising item to the equation, and the analysis solution was derived in the article. According to the solution, the dimensionless deposition velocity was an exponential curve, and it decreased to zero with time. Therefore, the deposited dust mass was limited, the maximum of which was derived in the article.