
Abstract
Considering the influence of lateral distance on consecutive vehicles, this paper proposes a new car following model based on the artificial potential field theory (APF). Traditional car following behaviors all assume that the vehicles are driving along the middle of a lane. Different from the traditional car following principles, this incorporation of APF offers a potential breakthrough in the fields of car following theory. The individual vehicle can be represented as a unit point charge in electric field, and the interaction of the attractive potential energy and the repellent potential energy between vehicles simplifies the various influence factors on the target vehicle in actual following behavior. Consequently, it can make a better analysis of the following behavior under the lateral separation. Then, the proposed model has been demonstrated in simulation environment, through which the space-time trajectories and the potential energy change regulation are obtained. Simulations verify that the following vehicle's behavior is vulnerable to be affected by lateral distance, where the attractive potential energy tends to become repellent potential energy as the longitudinal distance decreases. The search results prove that the proposed model quantifies the relations between headway and potential energy and better reflects the following process in real-world situation.
1. Introduction
The classical car following behaviors assume that the vehicles are travelling along the middle of a lane, but this assumption is not fit for the realistic driving behavior which is influenced by various factors, such as irregular driver attitudes or bad weather (rainy, snowy, etc.). The vehicle's travel route easily deviates from the lane line unless the lanes are clearly separated by road markings with good visibility and drivers cautiously obeying the driving rules. In this case, the lateral distance between the leading vehicle and following vehicle will significantly affect the follower's decision. For example, the lateral distance will play an important role in car following process (Figure 2).
Jin [1] proposed time-to-collision equation according to the lateral separation between the leading vehicle and the follower in order to revise the description by general motors model; Gunay[2] defined the term lane-based driving discipline as the tendency to drive within a lane by keeping to the centre as closely as possible (unless in lane changing). As shown in Figure 1, central positions of vehicles were recorded in Germany, and these vehicles positioned themselves laterally within their lanes according to normal distribution.
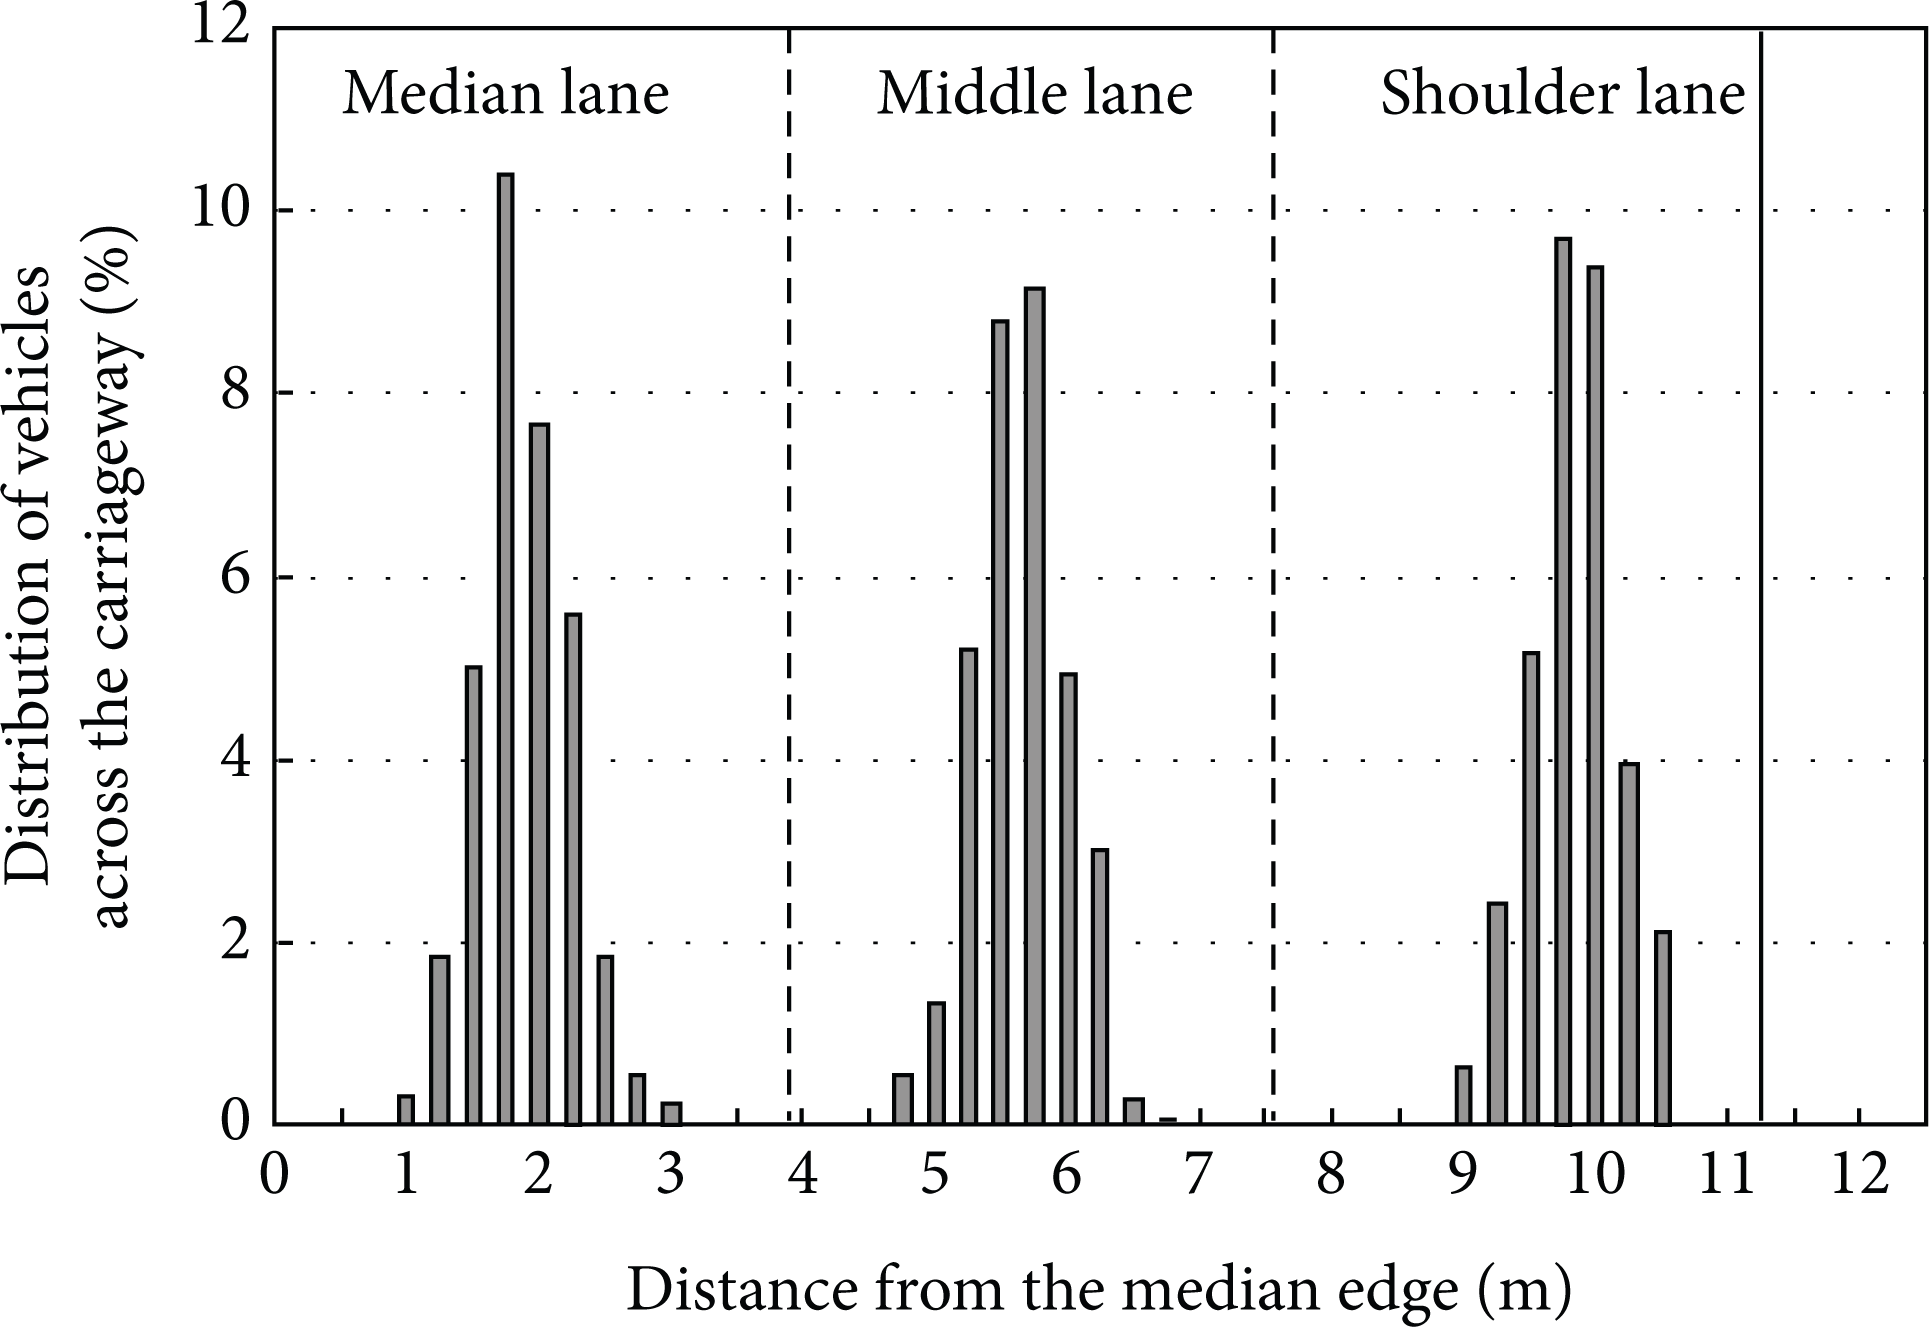
Distribution of vehicles across the carriageway with lateral separation [2].

Lateral distance between the consecutive vehicles.
The statistical data as follows was investigated at G1 segment of Changchun's beltways which show the relation between the time headway and the lateral distance (LD) of two consecutive vehicles (Figure 3). We can see that the time headway is decreasing as the LD increases.

Relationship of the lateral distance and time headways.
These studies illustrate that the LD plays an important role in following behaviors, and in this paper, the research is based on the above research. The rest of this paper is organized as follows. First, we review the classic car-following theories; then we propose a new car following model with lateral distance based on the APF; thirdly, the proposed model is verified by the simulated experiments. Finally, conclusions are drawn.
2. A Brief Review of Classic Car Following Theory
Reuschel (1950) and Pipes (1953) [3] first termed the concept of car following, which assumed the objective vehicle (the follower) to go after the leader and it would take action while the leader decelerates or accelerates. After 60 years of development, dozens of important car following models have been built, but the ideas of mathematical modeling, model structure, and the value of parameters calibration of these models are not the same. Meanwhile, the application condition is as various as the human factors involved; so these factors are closely related to driver's characteristics, for instance, driving habits, cultural diversity, and social circumstance. As we know, the research target is a vehicle which is traveling on the road, apparently, under the constantly changing road conditions (such as road traffic control strategy) and vehicle's performance (such as speed, acceleration/deceleration). These are the influencing factors on the actual driving behavior. The classical car following models can be broadly categorized as follows.
General Motors (GM model) [4] studied the driver's response to the stimulation from leading vehicle in longitudinal car following process. This model demonstrated that the object vehicle would speed up or slow down after reaction time. Gradually linear and nonlinear car following models were proposed based on the GM principle. It is generally agreed that the car following in reality is an approximate process which can be substituted as a process of human decision and response.
Wiedemann (1974) [5] put forward mentality-physical following model. Currently, this model is the core of the simulated software VISSIM (produced by PTV Co.). He thought that he driver of the objective vehicle would accelerate while the longitudinal distance from the leading vehicle is less than the psychological safe distance. Whereas the following driver can not accurately estimate the speed of leading car, so the following speed could maintain at a lower level over a period of time. Further, the follower will slow accelerating when the distance between the two vehicles reaches another psychological safe distance. Finally, cycles of accelerate-decelerate-accelerate are formed.
Safe-distance model is also known as collision avoidance (CA) model which is proposed by Kometani and Sasaki (1959) [5]. Instead of the interrelation of stimulus-response in GM model, the safe-distance model termed a specific distance by using the fundamental theorem of Newtonian mechanics. Gipps [6, 7] modified safe-distance model on the bases of acceleration constraint and safe-distance constraint. The modified model combined some influence factors of driver behaviors, and this model has been widely used. For example, it has been used in the simulated software: CORSIM and FRESIM which were developed by the American Federal Highway Administration (FHWA) [8]. This paper is also based on the safe-distance idea in order to keep the following process closer to realistic environment.
The related simulations of the above models were all set in the environment in the middle of a carriageway, which was introduced in Wiedemann's report [9]. When lane discipline is not maintained, it is necessary to be concerned about lateral distance influence between vehicles. In order to describe the interaction between the vehicles with lateral separation, this paper proposed a new perspective of car following model by using the artificial potential field (APF). It can be demonstrated not only by the space-time trajectory in microscopic angle, but also by the angle of energy changing.
Khatib[11] initially proposed the concept of APF, and it was used to avoid collision when the robot hand moves to capture objects. In APF, the robot's working environment is converted to potential field where all the barriers are treated as high potential energy [10, 12] (the cylinders are shown in Figure 4). Meanwhile, the robot is regarded as a sphere always rolling to the low potential energy area from the high potential field area. This rule also can be applied to microscopic traffic flow. The following process of vehicles is a continuous field energy changing process. The repellent field energy increases when longitudinal distance decreases (closer to the safe-distance), and the followed vehicle may take action to decelerate or overtake [13–15]. On the contrary, when longitudinal distance is apparently farther than the safe-distance, the follower will accelerate due to the attractive potential energy affection. The ideas of APF modeling simplify the interference of road environment, which can solve the insufficiency of isolated model and systemic weaknesses. The subject of this paper is based on the above advantages.
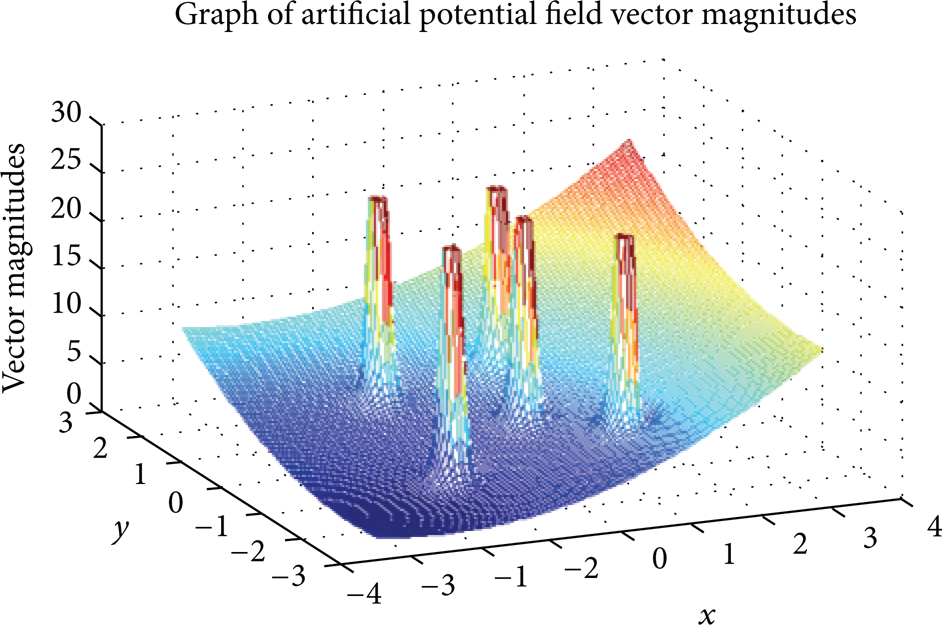
Graph of artificial potential field vector magnitudes [10].
3. Models
3.1. Lateral Distance Influence
Different from the traditional vehicle following behavior, the follower does not need to slow down to zero. Instead, when the leading vehicle decelerated, the follower has opportunity to shift for overtaking because of the lateral distance. That is fit for the actual driving situation (Figure 5). Therefore, the vertical speed V p of the overtaking speed depends on the width of the lateral distance.

The schematic plot of the following vehicle moving with lateral distance.
Figure 6 shows the variation of longitudinal distance between the leader and the follower in two different states: (a) the follower's speed is lower than the leader's at initial stage; then the follower accelerates till the distance between the two vehicles become stable, which is less than the traditional following distance; (b) the follower's speed is faster than the leader's at the beginning, while the object decides to overtake after precisely estimating the speed difference, but the speed V p through the overtaking process is constrained by lateral distance.
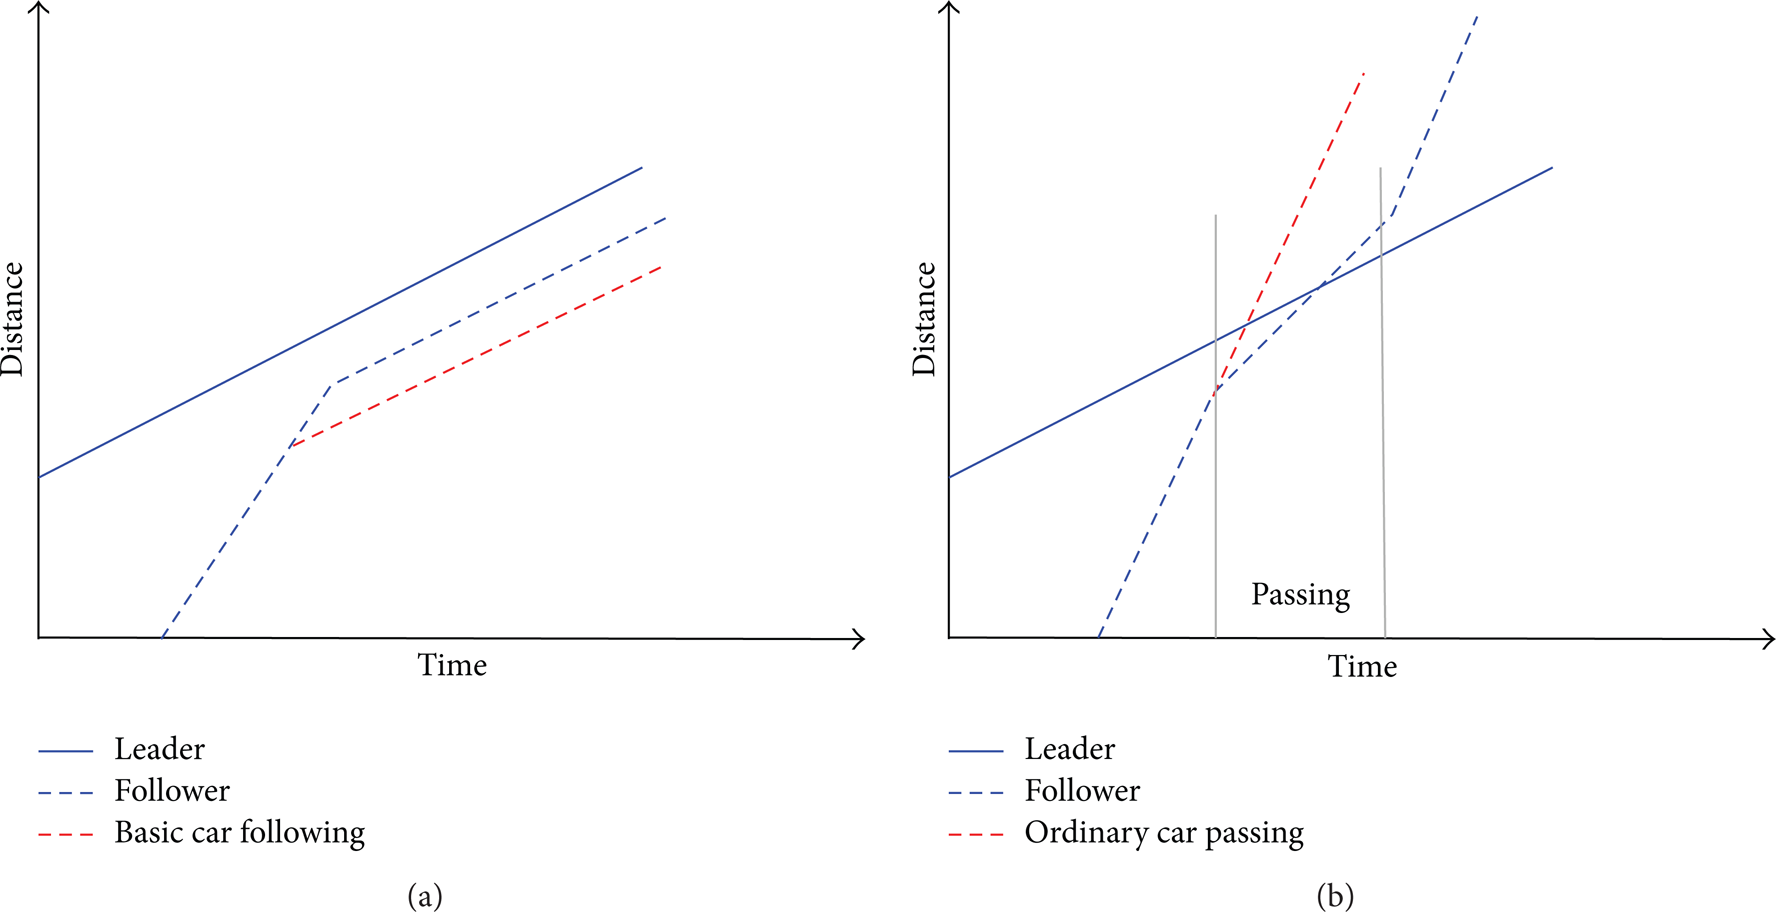
Two different behaviors of the following car: (a) the space-time trajectory of the following process and (b) the space-time trajectory of the overtaking process.
3.2. Attractive Field Energy
The attraction is the motivation of the followed car, which represents the driver's desire for accelerating. Assuming that the speed of the following car V n (t) is less than the leading ones Vn – 1(t) meanwhile the leading vehicle's acceleration is an – 1(t) ≥ 0, the vehicle ahead will appeal to the followed vehicle at this stage. The formula can be expressed by


where k p is the positive gain of the influence on the speed with lateral distance. Here, we term the desired speed v d , which is a constant value. v d is the ideal speed of drivers' intention. It is the maximum safe speed without a leading car.
The relation between the lateral distance and the overtaking speed V p is similar to quadratic function (3). The coefficients a, b, and c are undetermined. For better understanding, Figure 7 shows a quadratic function sketch of V p . And k p can be calculated by (2). Consider


The affection plot of the lateral distance influence on the object vehicle.
The object vehicle speed v n can be written as v n (t) = v n (t0) + a n (t) · t according to the classical Newton's second law. a n (t) is the acceleration of the object vehicle, and it is inversely proportional to v d . We obtain
3.3. Repellant Field Energy
For a safe distance to the leader, the repellant reflects the driver's perception and reaction when the longitudinal decreases. The interactive repellent potential field between two vehicles is as follows:

where ϖ is a gain coefficient inversely proportional to lateral distance. So, the larger the lateral distance, the smaller influence on the follower. ρ sd is the vertical distance at time t, and ρ0 is the minimum safe distance. The following criterion of ρ sd and ρ0 should be met as follows:
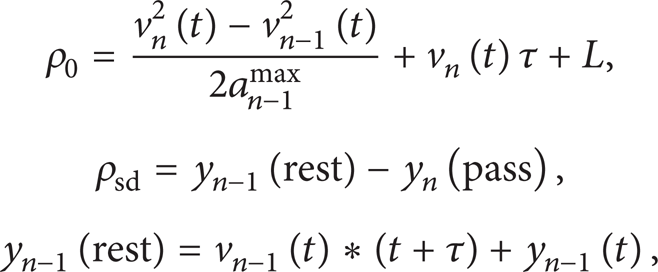
where τ is the driver's reaction time. L is the length of a standard vehicle. When yn – 1(rest) – L ≥ y n (pass), the follower will not collide with the leader. The trajectory formula of the following vehicle is shown as follows:

4. Simulation Results and Analysis
The simulated experiment is conducted under the C++ language. The reaction time is 0.667 s the same as the simulated step, the vehicle's acceleration refers to the research of Płaczek [16], the normal value is 1.7 m/s2, and the standard deviation is 0.3 m/s2. That is to say that the maximum acceleration is 2.0 m/s2.
The width of a vehicle is 2.2 m to 2.5 m and the length is 4 m to 6 m for standard cars. This paper assumes that the width of a vehicle is 2.4 m and that the vehicle length L is 5 m. According to the calibration of formula (2) based on the survey data of the G1 segment of Changchun's beltways, the coefficients are a = – 17.2, b = 77.6, and c = 0.7, respectively. As shown in Figure 8, the larger the lateral distance, the bigger the v p when LD ∊ [0.5, 1.5] m. The effect can be ignored when lateral distance is over 2 m.

Relationship between v p and LD.
Assuming that the leader's speed is 30 Km/h and that the follower's speed is 90 Km/h, the model is simulated in the four lateral distance conditions as follows: 0.5 m, 1.0 m, 1.5 m, and 2.0 m, respectively. The speed difference between the leader and the follower is shown in Figure 9.

The speed difference between the leader and the follower under four lateral distance situations.
As the above figures show, the following behavior is constrained by the leading vehicle's state when lateral distance does not exceed 0.5 m. For a safe moving passage, the followed vehicle will keep the speed the same as the leading vehicle. But when the lateral distance is bigger than the 0.5 m, the follower may overtake the leader in order to reach desired speed; meanwhile, the speed difference becomes larger again. The acceleration process of the following vehicle will become large because of good lateral vision, and the speed will be maintained in the desire speed range.
Figure 10 shows the space-time trajectories where the follower's overtaking tendency with lateral distance increases. These graphs better describe the real driving behavior in reality, and it can supplement the car following rules intraffic simulated softs.

Simulated space-time trajectories of the vehicles under four lateral distance situations.
To analyze from the potential field angle, the energy (attractive or repellent) is tending to minimize to zero through the following process. As mentioned above, the acceleration of the following vehicle is constrained by the leader's movement and the lateral distance. The red area shows a great attractive potential field area in Figure 11(a). Since the longitudinal distance decreases, the attractive potential field reduces, which progressively decreases to zero. On the contrary, the repellent potential field increases (Figure 11(b)).

Figures of potential field changing during the car following process.
Simulated time headways of consecutive vehicles are shown in Figure 12. Time headway is decreasing as the lateral distance increases. And the distributions of attractive potential energy and repellent potential energy are shown as the blue cylinder and the red cylinder, respectively.

Simulated time headways of consecutive vehicles with the potential energy transferring in different later distance situations.
According to the above analysis, there is good performance of car following based on the APF theory. By treating the individual vehicle as a unit point charge in electric field, it can simulate the two basic behaviors (attract and repel). Based on that, the proposed model can ensure that every vehicle in the system traveling within the design expectation headway in advance. Furthermore, the potential sum of these individuals is minimal.
5. Conclusion
This study proposed a new model to research the car following process with lateral distance. Traditional car following theories all assume that the vehicle moves along the middle of a lane, which is not applicable in real-word situations. As known, each vehicle is not only constrained by the longitudinal distance from the one in front, but also influenced by the lateral distance between the consecutive vehicles. Hence, this paper introduced the APF theory to simplify the various influence factors on the object vehicle in order to better analyze the following behavior with lateral separation in a potential field perspective. The model coefficients were calibrated by the measured data which was investigated at G1 segment of Changchun's beltways, and a series of simulations for the proposed model is conducted to explore the space-time trajectories and the potential energy changing during the following processes. The simulation results showed that the proposed model is adept at describing the actual driving behavior. In addition, it can explain the interrelation between the attractive potential energy and the repellent potential energy in microscopic traffic flow, which is the key research of macroscopic traffic in future.
Conflict of Interests
The authors declare that there is no conflict of interests regarding the publication of this paper.
Footnotes
Acknowledgments
The authors express their sincere appreciation to the Chinese National High Technology Research and Development Program Committee for the financial support providing under Grants no. 2012AA112307 and Project 20121100 supported by the Graduate Innovation Fund of Jilin University for the financial support of this project.